CW3E Coastal Landfalling AR Catalog
Primary support by the California Atmospheric Rivers Program and U.S. Army Corps of Engineers FIRO Program. Return to CW3E Homepage
 
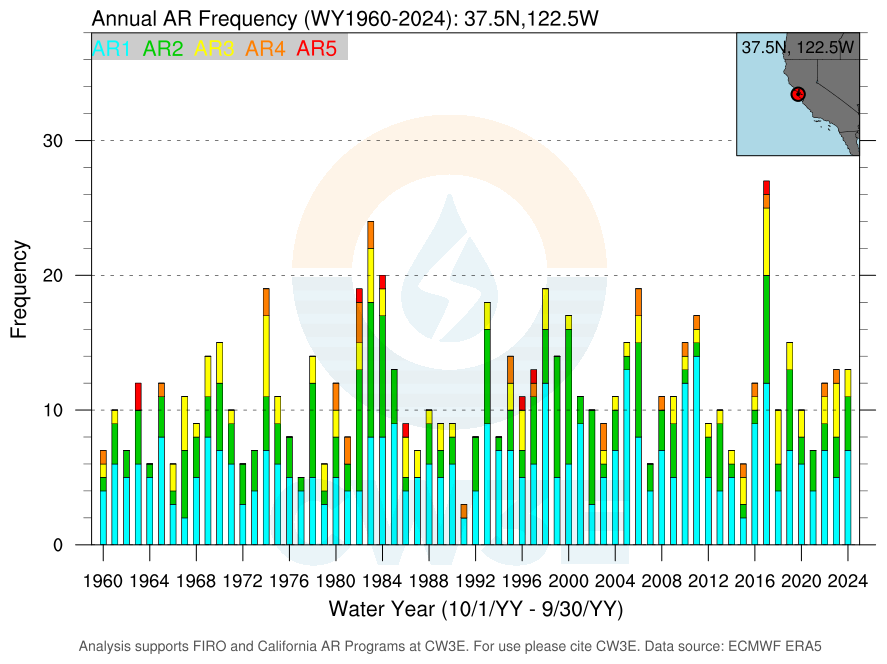
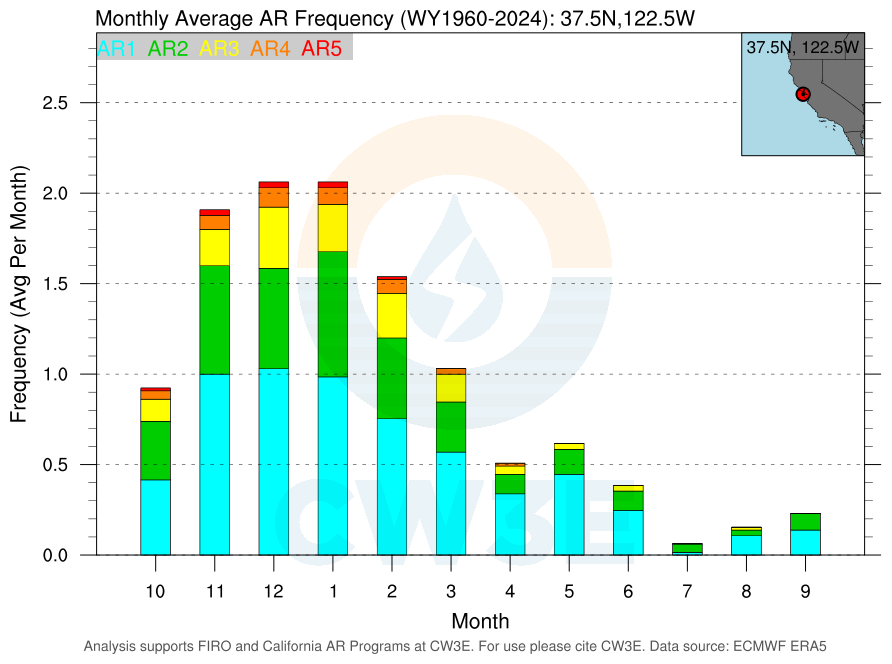
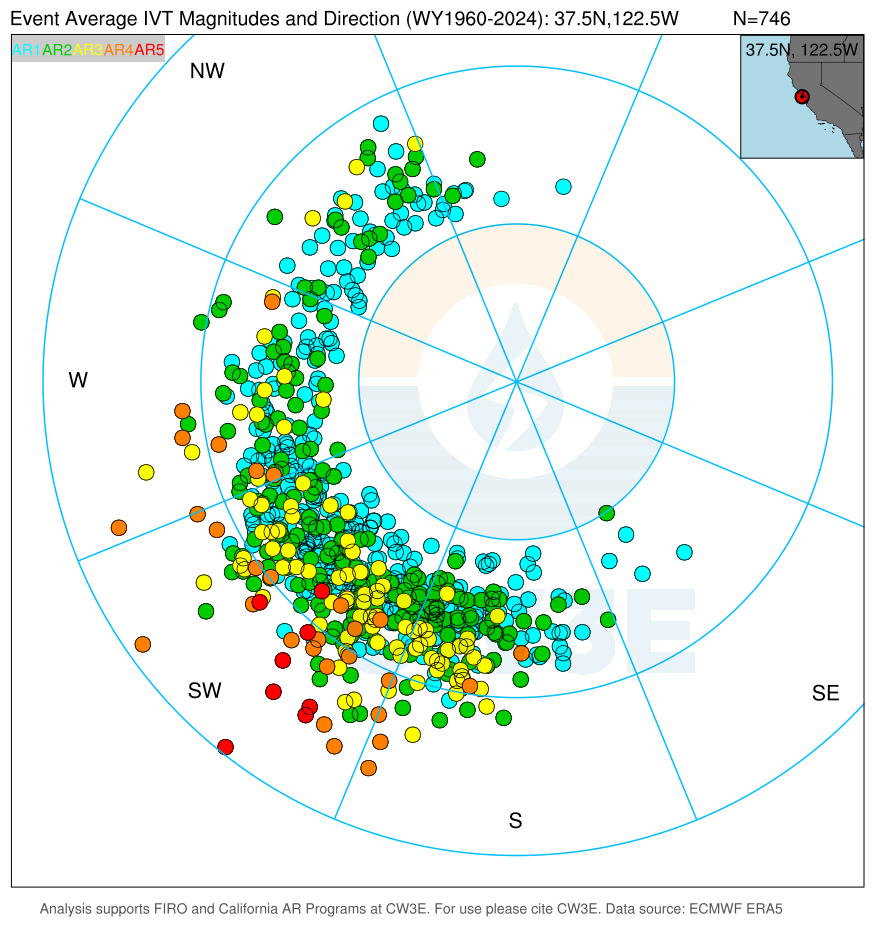
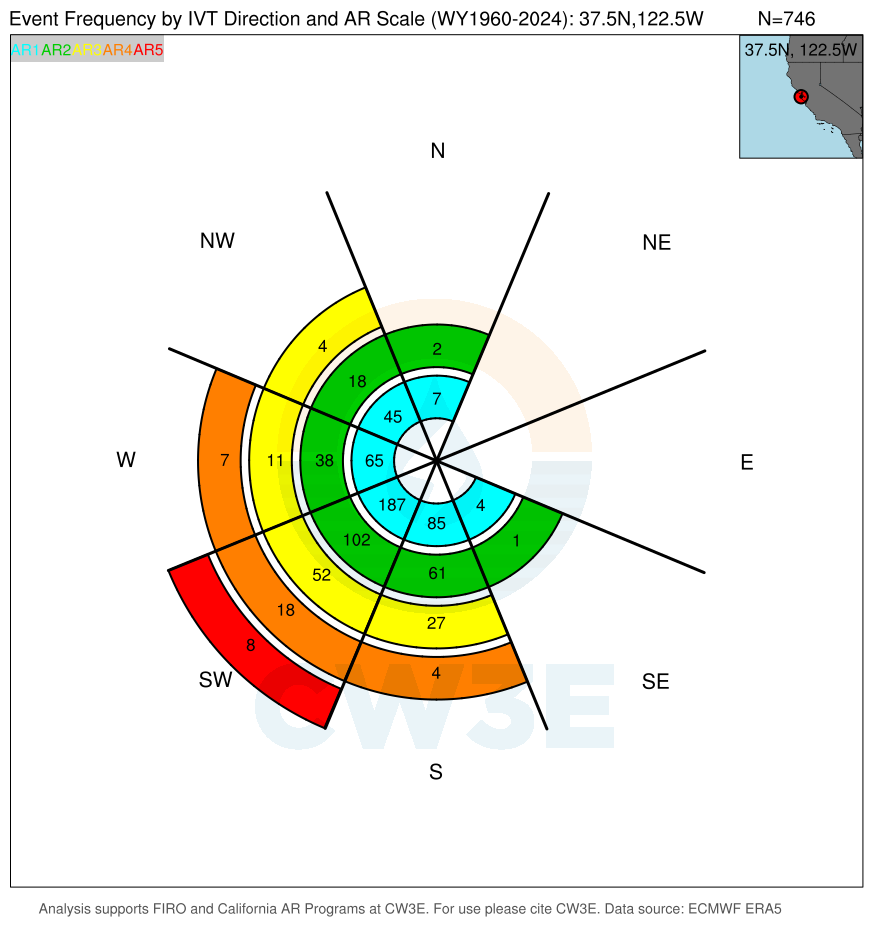
Landfalling AR Scale Frequencies (Annual, Monthly, Intensity/Direction) at 37.5N

Figure Descriptions:
  • Left Map: Map of coastal locations. Click these points to change analyses.
  • Upper Left Chart: Annual frequency of AR events shaded according to the Ralph et al. (2019) AR scale.
  • Upper Right Chart: Monthly average frequency of AR events shaded according to the AR scale.
  • Lower Left Chart: "Radial" diagram of event-average IVT magnitude (distance from center) and event-average IVT direction (meteorological direction/quadrants) shaded by AR Scale. Range rings start at 250 kg/ms and include 500, 750 kg/ms rings. Event-average direct is average of u component and v component. Hurricanes in the dataset in Baja mess this up; check it out.
  • Lower Right Chart: A summary of AR direction by AR scale.
  • All data are derived from the ERA5 Reanalysis.
Summary of Event Characteristics for AR2+ storms and Imagery for 37.5N - updated through Sep 2023 (NOT 2024)
The right-most column contains a link 'View Map' to view analyses at the time of maximum IVT for each event.
Download Data for 37.5N
Hourly ERA5 IVT and IWV Information for 37.5N, 122.5W
The csv file contains hourly information for 0000 UTC 1 January 1959 through 2300 UTC 10 October 2024. The columns do not contain headers:
  • Column 1: date (YYYYMMDDHH, integer),
  • Column 2: IVT magnitude (kg/ms, float),
  • Column 3: u-component of the IVT (kg/ms,float),
  • Column 4: v-component of the IVT (kg/ms,float),
  • Column 5: IWV (mm,float)
The file size is ~20-22 MB. Please cite the Center for Western Weather and Water Extremes (CW3E), Scripps Institution of Oceanography, University of California San Diego and notify Dr. Jay Cordeira (jcordeira@ucsd.edu). Data are provided as is. Download here.

AR Event Information for 37.5N, 122.5W
The csv file contains event information for ARs at the point above following the methodology of the AR Scale established by Ralph et al. (2019) for all storms with a start date between 0000 UTC 1 October 1959 and 2300 UTC 30 September 2024. The columns of this file are numerous and do not contain headers:
  • Column 1: Start Date of AR (YYYYMMDDHH, integer),
  • Column 2: Date of maximum IVT magnitude (YYYYMMDDHH, integer),
  • Column 3: End Date of AR (YYYYMMDDHH, integer),
  • Column 4: Duration in hours (hours, integer),
  • Column 5: Maximum IVT magnitude (kg/ms, float),
  • Column 6: AR Scale (number, integer),
  • Column 7: Average IVT magnitude (kg/ms, float),
  • Column 8: direction of Maximum IVT magnitude (degrees, float),
  • Column 9: Average IVT direction (degrees, float),
  • Column 10: Maximum IWV (mm, float),
  • Column 11: Average IWV (mm, float),
  • Column 12: Avearge uIVT (kg/ms, float),
  • Column 13: Average vIVT (kg/ms, float),
The file size is between 25 KB and 200 KB. Please cite the Center for Western Weather and Water Extremes (CW3E), Scripps Institution of Oceanography, University of California San Diego and notify Dr. Jay Cordeira (jcordeira@ucsd.edu). Data are provided as is. Download here.