Climatology of Events based on Ralph et al. (2019) AR Scale Rank
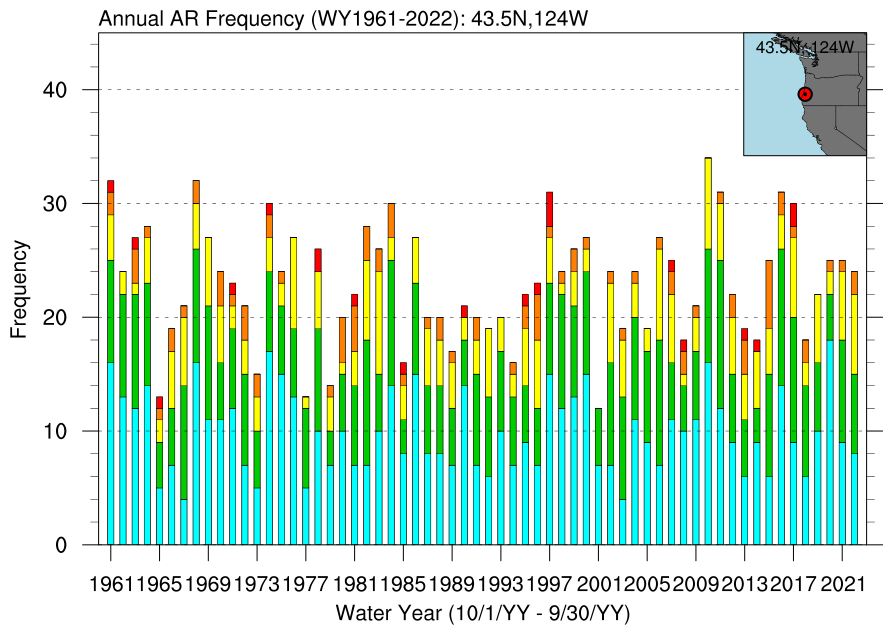
Top-left: Annual frequency of AR1+ storms by year categorized by scale rank 1-5 (blue, green, yellow, orange, red, respectively) for WY1961-2022. Data source: ERA5.
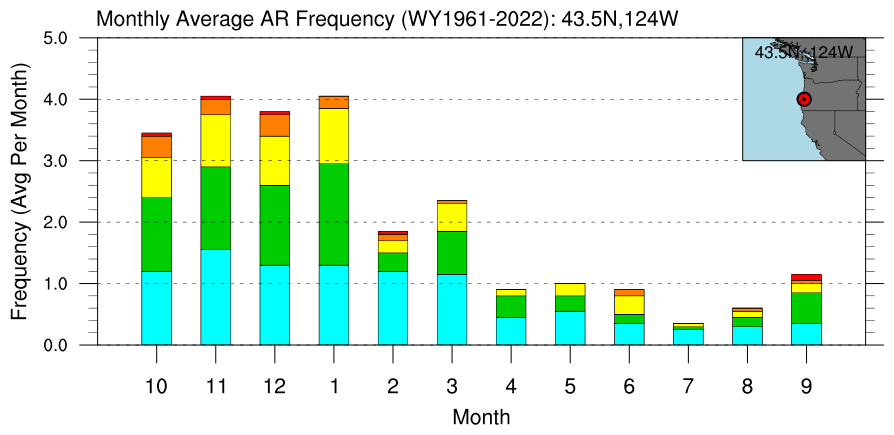
Top-right: Monthly average frequency by rank based on start time.
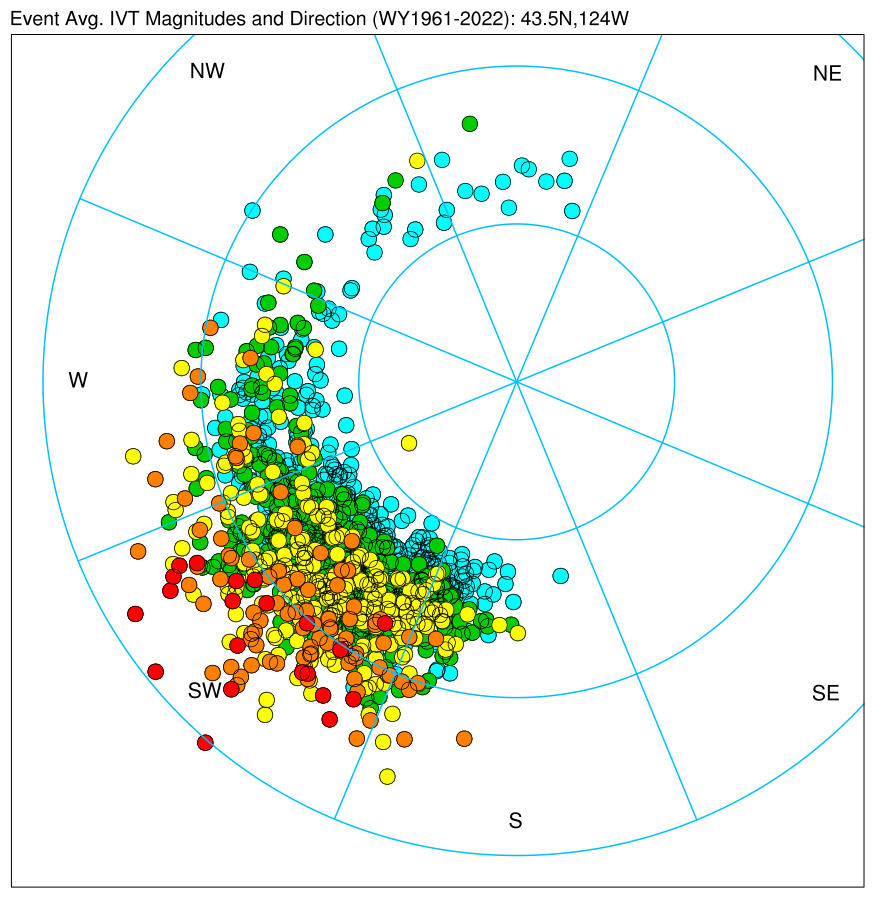
Botton-left: AR event IVT characteristics based on event-averaged hourly u-component and v-components. Radius is event-average IVT magnitude starting/every 250 kg/ms (based on components). Arc-theta is event average direction using meteorological compass. Evenst shaded by scale.
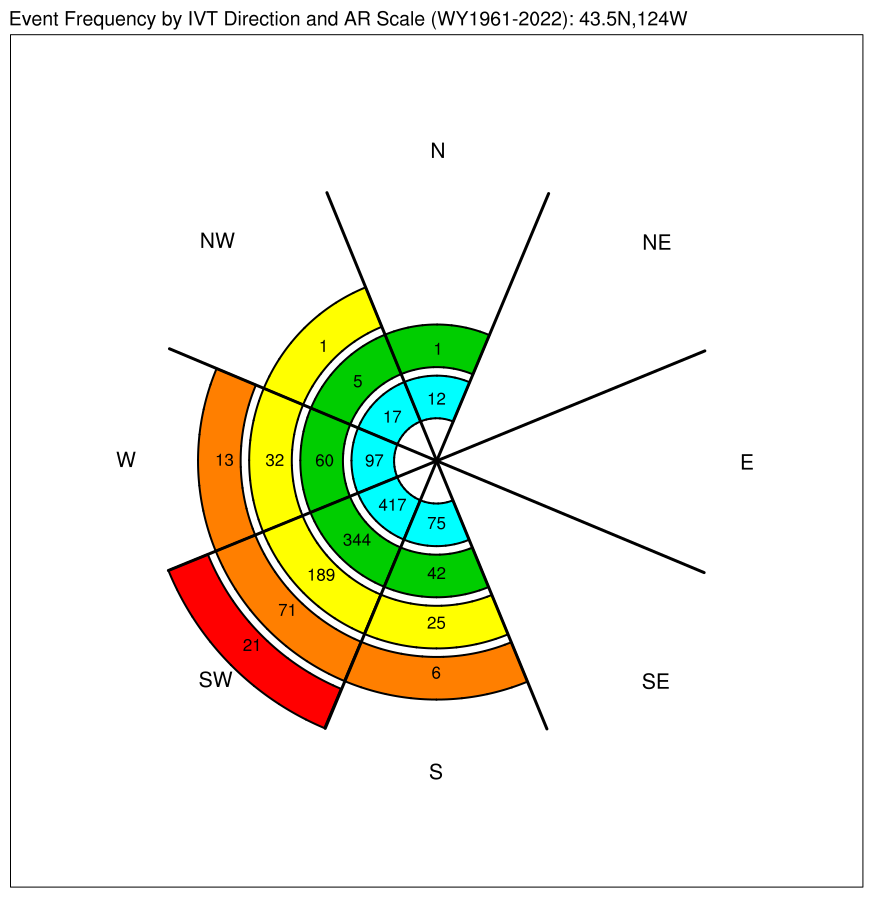
Bottom-right: Summary of event average IVT directions by AR rank.
Sortable Table of Landfalling Events for just AR3+
You can sort by clicking on the headers. You can select the values in either "ID/Start" or "Max Date" to view an animated gif of the event, a map at the time of maximum IVT magnitude, and a time series of the event IVT magnitude.
Maps of IVT Magnitude and Direction for Selected Events AR3+
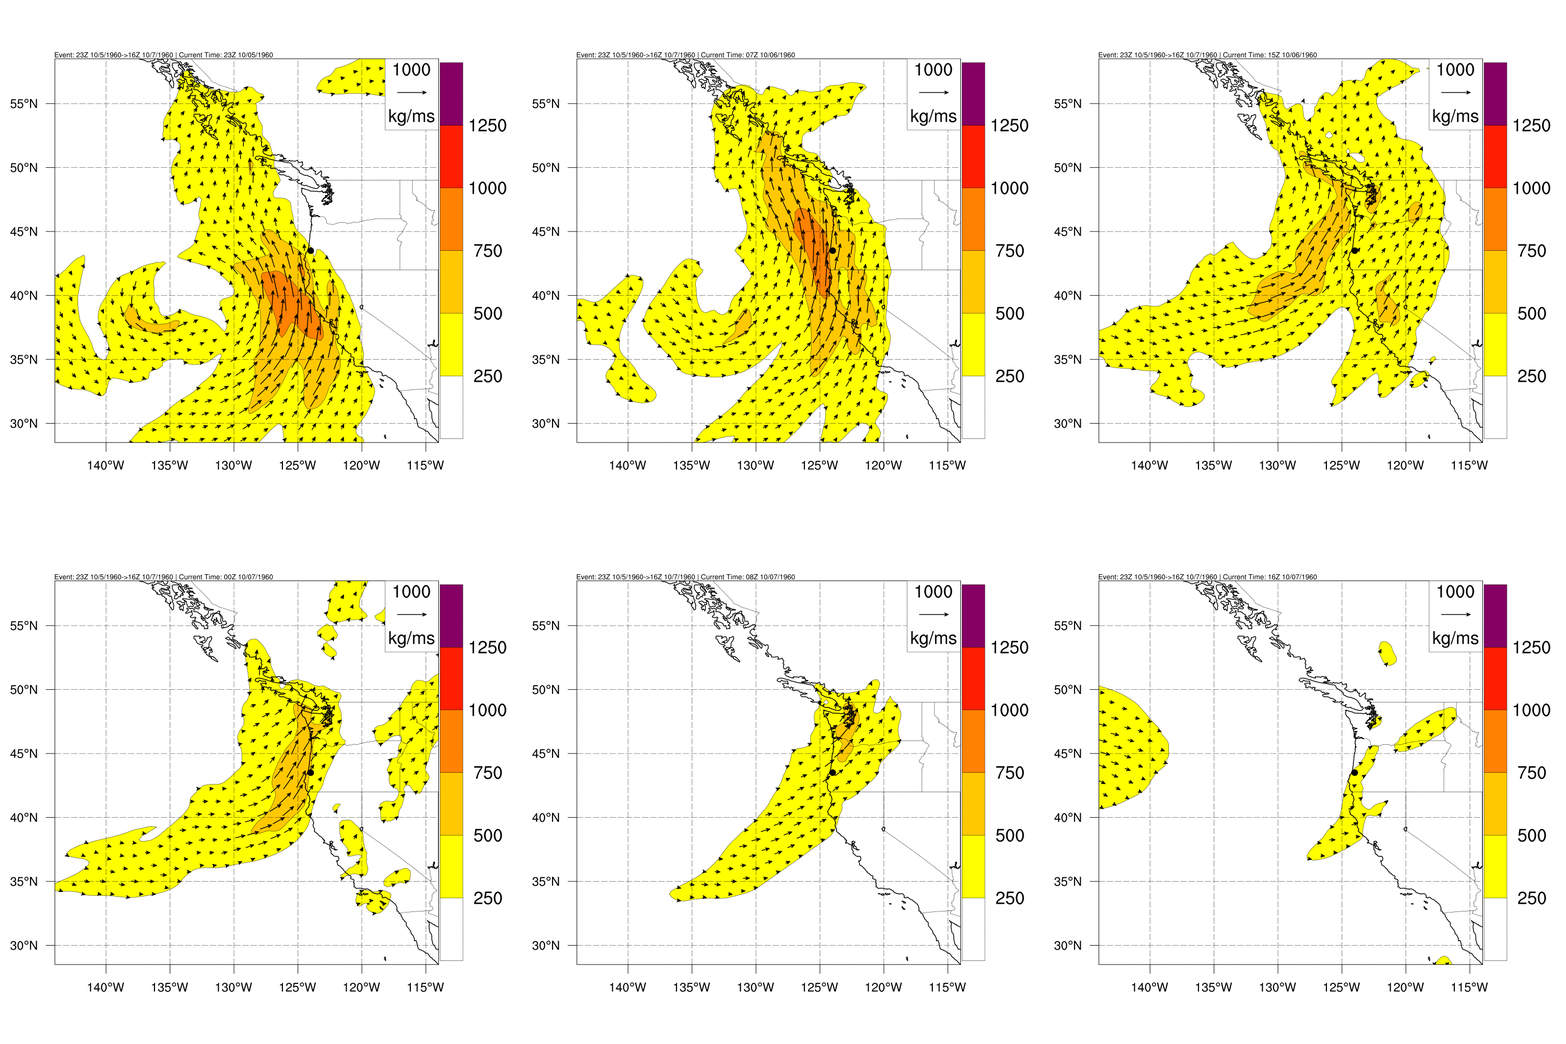
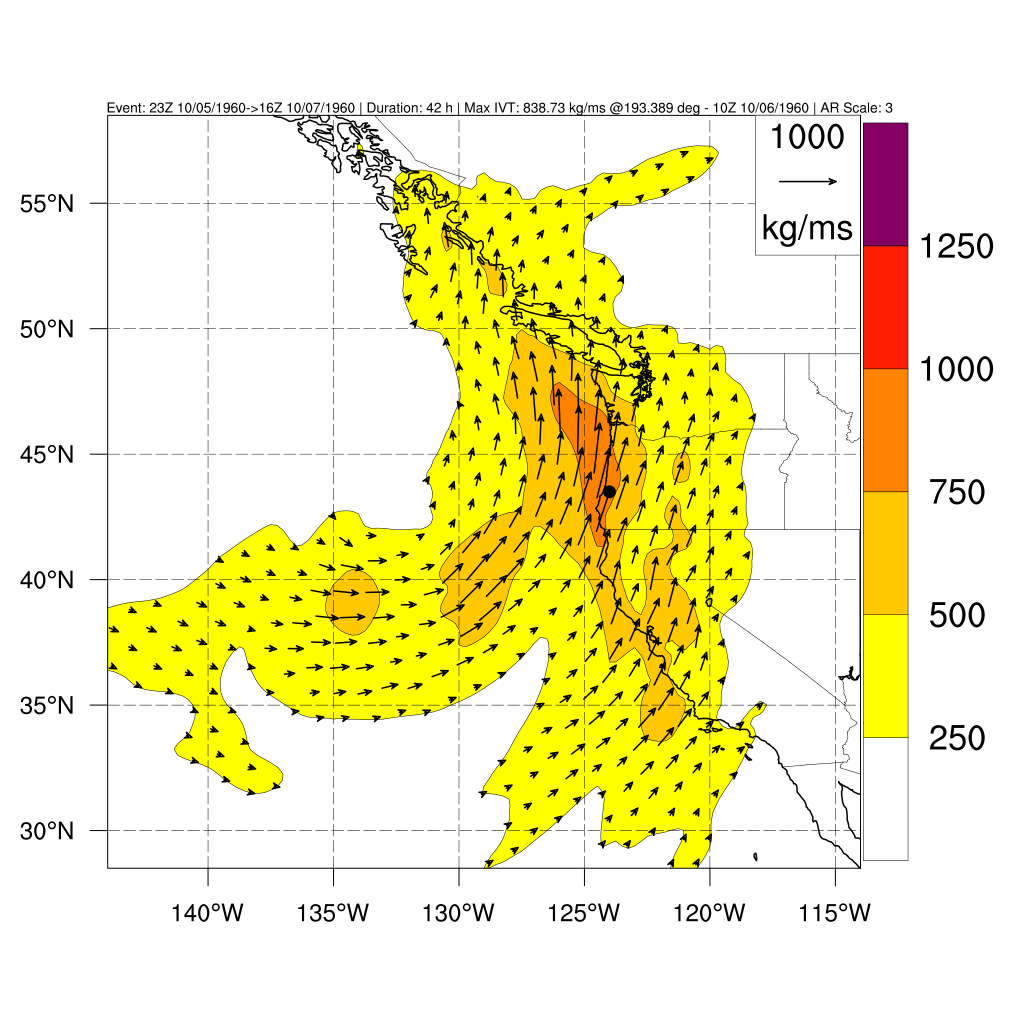
The left image is an animated GIF of IVT magnitude (shaded in kg/ms according to scale) and IVT vectors (magnitude and direction) according to the reference vector in the upper-right corner of each panel. The dot represents the location of the analyses. Choose a new map by selecting values in the table above.
Time Series of IVT Magnitude for Events AR3+
Time series of IVT magnitude (kg/ms) from the first time of IVT magnitudes >=250 kg/ms to the last time of IVT magnitudes >=250 kg/ms. Chart is semi-interactive; you can get the time and values by hovering your cursor over the line. Choose a new time series by selecting values in the table above.
Maps of Precipitation for Selected Events AR3+
The left image is the storm-total precipitation accumulated between the start and end time of the landfalling AR at the point identified. The precipitation is the sum of hourly precipitation that has been averaged over each watershed. The data source is the AORC precipitatoin dataset. Units are millimeters. Data only for events 1979-2020.
