| Return to CW3E Homepage |
| | Intro | California Obs | AR Forecasts | Watershed Precip | Watershed Freezing Level | S2S Outlook | | CW3E Home |
| ...GFS and ECMWF Ensemble Freezing-Level Data Are Loading... |
|
Note: Clicking the GEFS/ECMWF radio button will load precipitation-derived map data for each ensemble member allowing you to click an individual watershed to see its respective ensemble-plume diagram. Clicking the third radio button option will produce a white map, but will allow you to see both model system's ensemble-plume diagrams after you click a watershed. |
|
| Map Description: This map uses GFS and ECMWF ensemble forecasts to show the evolution of the freezing level above, within, or below a watershed's terrain, i.e., forecast near-surface temperatures being above or below freezing, and precipitation falling as rain or snow. The maps show the percent of period ensemble-mean precipitation that falls with freezing levels above/below a watershed's terrain height (i.e., near-surface temperatures below freezing) and HUC8 watershed boundaries are shown. If you click on a watershed, you will get additional information regarding the evolution of the ensemble freezing level at that watershed. | |
| FIRO Watersheds in Northern California: | |
Russian River - GEFS:
|
Russian River - ECMWF: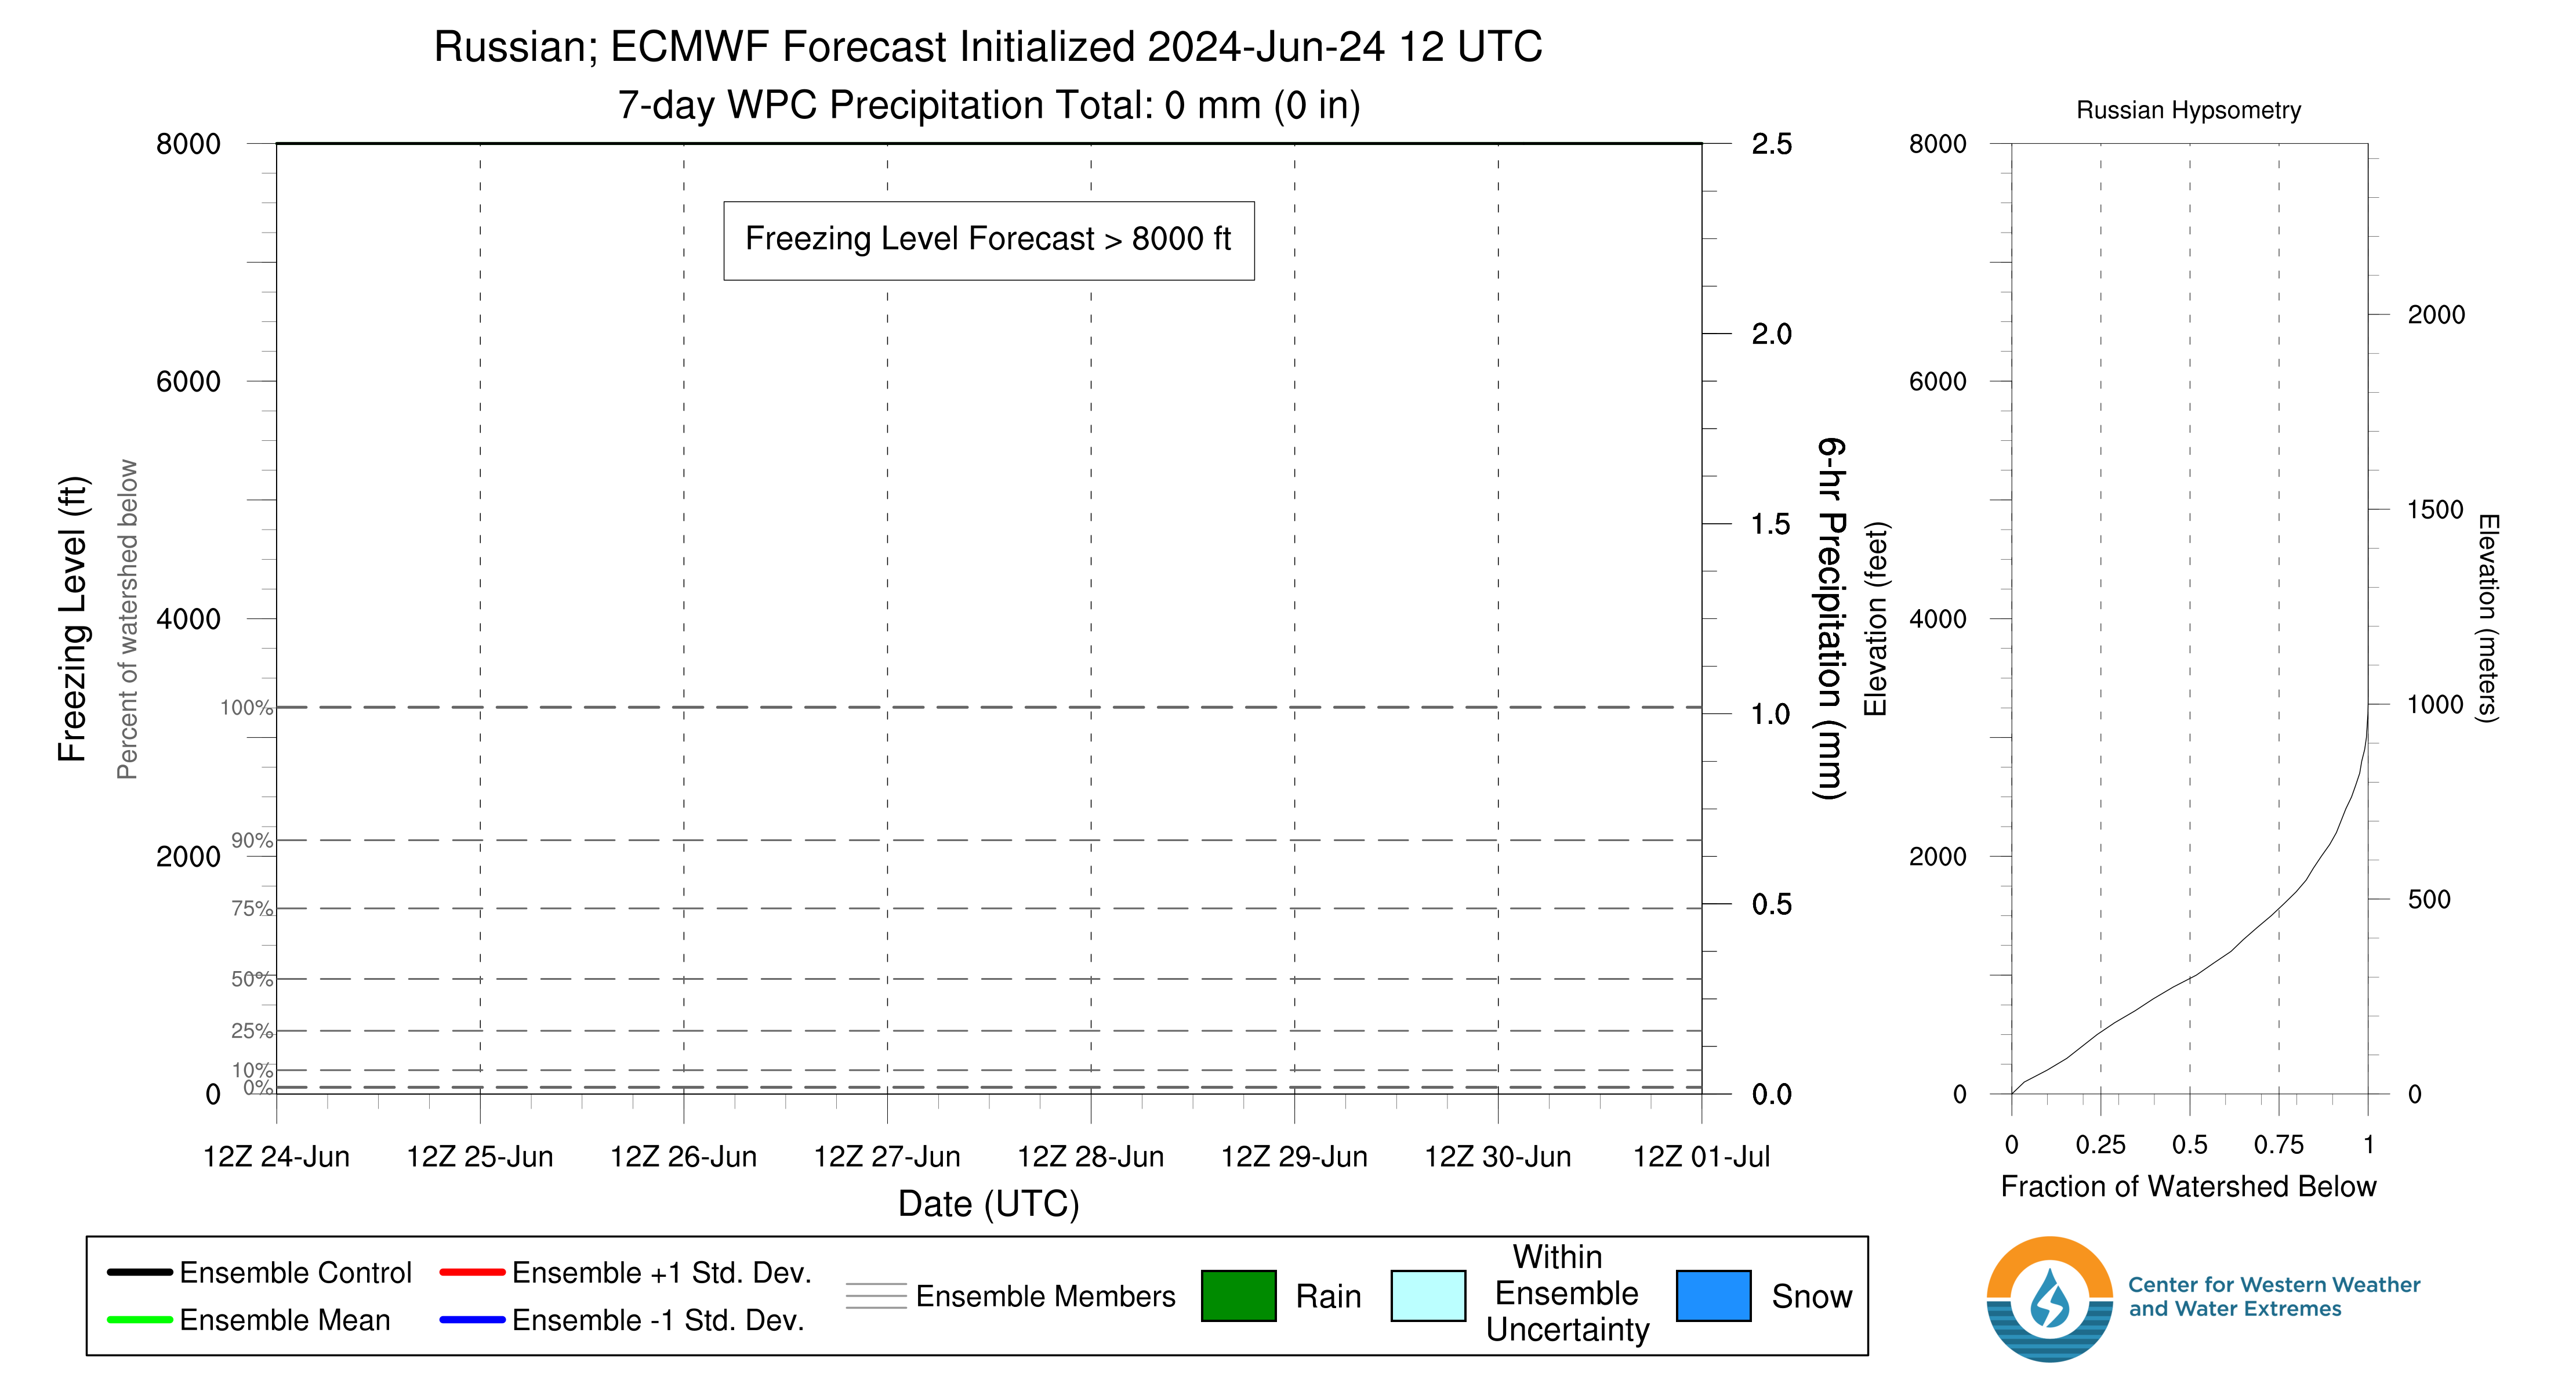
|
Upper Yuba River - GEFS:
|
Upper Yuba River - ECMWF:
|
Middle Fork Feather River - GEFS:
|
Middle Fork Feather River - ECMWF:
|
| Image Description: The HUC8 watershed plots show time series of GEFS/ECMWF freezing levels (left axis) and fraction of basin terrain below the freezing level (right axis), for each ensemble member (gray lines) and the ensemble mean (black dashed line). Ensemble members are color-coded at each time to show whether they are warmer (red, higher freezing level) or cooler (blue, lower freezing level). Lines at the top and bottom of the plot indicate that the freezing level is above or below the watershed terrain, respectively. Bars show NOAA WPC 6-hourly precipitation totals for the watershed in mm, and bar shading indicates what fraction of the watershed precipitation falls as rain (at terrain elevations below ensemble freezing level), rain or snow (at elevations within the ensemble), and snow (at elevations above the ensemble). The right-hand plot shows the distribution of terrain versus elevation for the watershed. | |
| NOAA ESRL Snow-Level Graphics, from their website at https://www.esrl.noaa.gov/psd/data/obs/datadisplay/ | |
Oroville Snow-Level (Vertical Velocity): |
Oroville Snow-Level (Signal-to-Noise/BB): |
Colfax Snow-Level (Vertical Velocity): |
Colfax Snow-Level (Signal-to-Noise/BB): |
| Image Description: Most recent snow-level radar plots provided by the NOAA Earth Systems Research Laboratory. The two images are loaded include a time-height anlaysis of doppler vertical velocity and a time-height analysis of reflectivity. Each plot shows color shading of vertical radial velocity and circles depicting the freezing level indicated by a radar bright band when bright band precipitation is present. Each plot shows the previous 48 hours of data with time moving from left to right. Data are updated each hour and are provided by NOAA ESRL. | |
For more information regarding the previous bias-corrected version, please contact Brian Henn. For questions regarding this current webpage, please contact B. Kawzenuk (UCSD) or J. Cordeira (UCSD/PSU). Please contact them directly with any questions. Page last updated by J. Cordeira 18 Sep 2024 |
F. Martin Ralph, PhD., Director Center For Western Weather and Water Extremes (CW3E) |
CW3E Partners California Department of Water Resources |
More Information Return to CW3E homepage |