Functions | |
| def | create_results_df (*network, T, name) |
| def | plot_time_series (*ax, df, col, parameter=None, legend=None, title=None, scenarios=[], fontSz=9, yMin=0, yMax=None, xMin=None, xMax=None, lineWidth=1.5, legendLoc='best', lineStyle='-', lineColor=plt.rcParams['axes.prop_cycle'].by_key()['color']) |
| def | plot_hydrograph_elev (*ax, df, col, hypso, parameter=None, legend=None, title=None, scenarios=[], fontSz=9, yMin=0, yMax=None, xMin=None, xMax=None, lineWidth=1.5, legendLoc='best') |
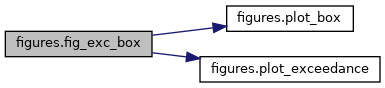
| def | plot_exceedance (*ax, df, col, legend, scenarios=[None], parameter=None, title=None, fontSz=9, yMin=0, yMax=None, lineWidth=1.5, legendLoc='best', lineStyle='-', lineColor=plt.rcParams['axes.prop_cycle'].by_key()['color'], xAxisScale='linear', yAxisScale='linear') |
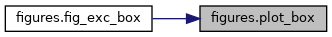
| def | plot_box (*ax, df, col, scenarios, legend, title=None, parameter=None, fontSz=9, yMin=0, yMax=None, lineWidth=1.5, yAxisScale='linear') |
| def | fig_exc_box (*df, col, parameter, scenarios, legend, title=None, fontSz=9, yMin=0, yMax=None, lineWidth=1.5, legendLoc='best', xAxisScale='linear', yAxisScale='linear') |
Function Documentation
◆ create_results_df()
| def figures.create_results_df | ( | * | network, |
| T, | |||
| name | |||
| ) |
Definition at line 14 of file figures.py.
◆ fig_exc_box()
| def figures.fig_exc_box | ( | * | df, |
| col, | |||
| parameter, | |||
| scenarios, | |||
| legend, | |||
title = None, |
|||
fontSz = 9, |
|||
yMin = 0, |
|||
yMax = None, |
|||
lineWidth = 1.5, |
|||
legendLoc = 'best', |
|||
xAxisScale = 'linear', |
|||
yAxisScale = 'linear' |
|||
| ) |
◆ plot_box()
| def figures.plot_box | ( | * | ax, |
| df, | |||
| col, | |||
| scenarios, | |||
| legend, | |||
title = None, |
|||
parameter = None, |
|||
fontSz = 9, |
|||
yMin = 0, |
|||
yMax = None, |
|||
lineWidth = 1.5, |
|||
yAxisScale = 'linear' |
|||
| ) |
◆ plot_exceedance()
| def figures.plot_exceedance | ( | * | ax, |
| df, | |||
| col, | |||
| legend, | |||
scenarios = [None], |
|||
parameter = None, |
|||
title = None, |
|||
fontSz = 9, |
|||
yMin = 0, |
|||
yMax = None, |
|||
lineWidth = 1.5, |
|||
legendLoc = 'best', |
|||
lineStyle = '-', |
|||
lineColor = plt.rcParams['axes.prop_cycle'].by_key()['color'], |
|||
xAxisScale = 'linear', |
|||
yAxisScale = 'linear' |
|||
| ) |

◆ plot_hydrograph_elev()
| def figures.plot_hydrograph_elev | ( | * | ax, |
| df, | |||
| col, | |||
| hypso, | |||
parameter = None, |
|||
legend = None, |
|||
title = None, |
|||
scenarios = [], |
|||
fontSz = 9, |
|||
yMin = 0, |
|||
yMax = None, |
|||
xMin = None, |
|||
xMax = None, |
|||
lineWidth = 1.5, |
|||
legendLoc = 'best' |
|||
| ) |

◆ plot_time_series()
| def figures.plot_time_series | ( | * | ax, |
| df, | |||
| col, | |||
parameter = None, |
|||
legend = None, |
|||
title = None, |
|||
scenarios = [], |
|||
fontSz = 9, |
|||
yMin = 0, |
|||
yMax = None, |
|||
xMin = None, |
|||
xMax = None, |
|||
lineWidth = 1.5, |
|||
legendLoc = 'best', |
|||
lineStyle = '-', |
|||
lineColor = plt.rcParams['axes.prop_cycle'].by_key()['color'] |
|||
| ) |
