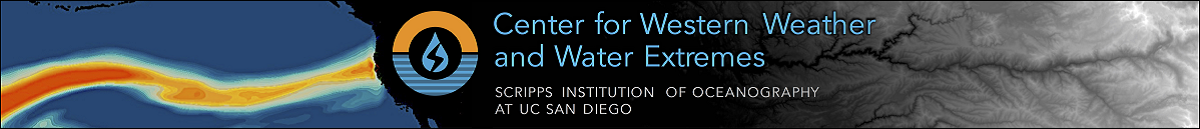
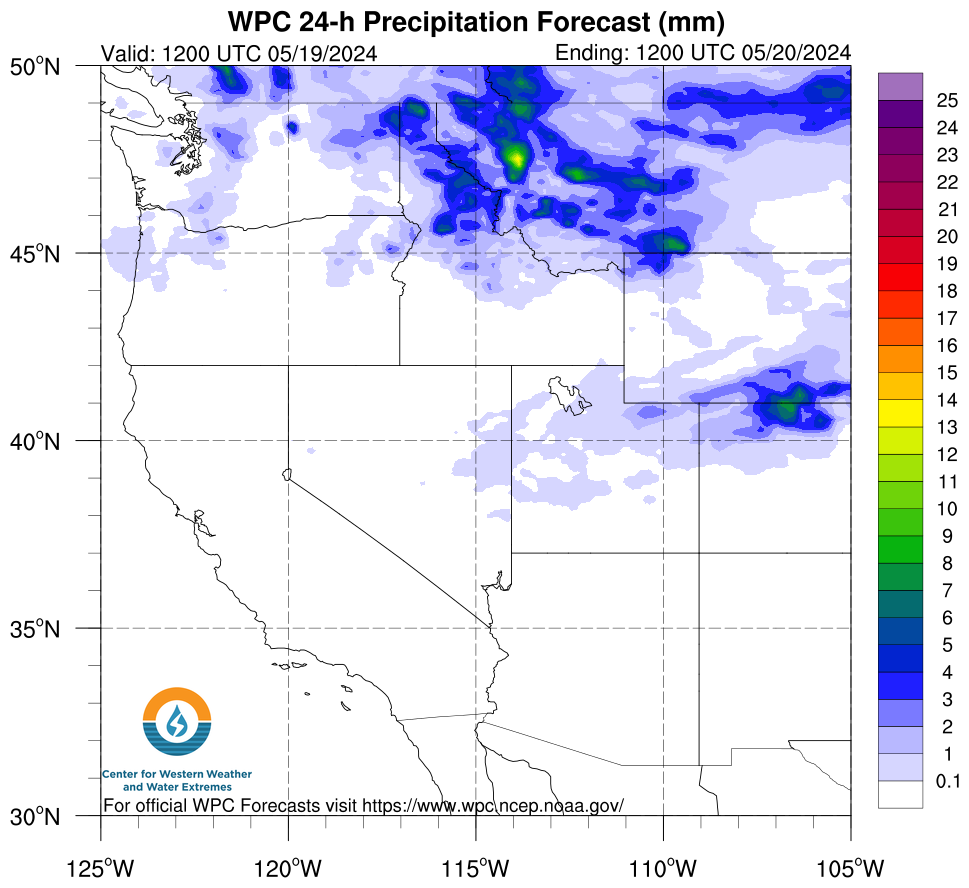
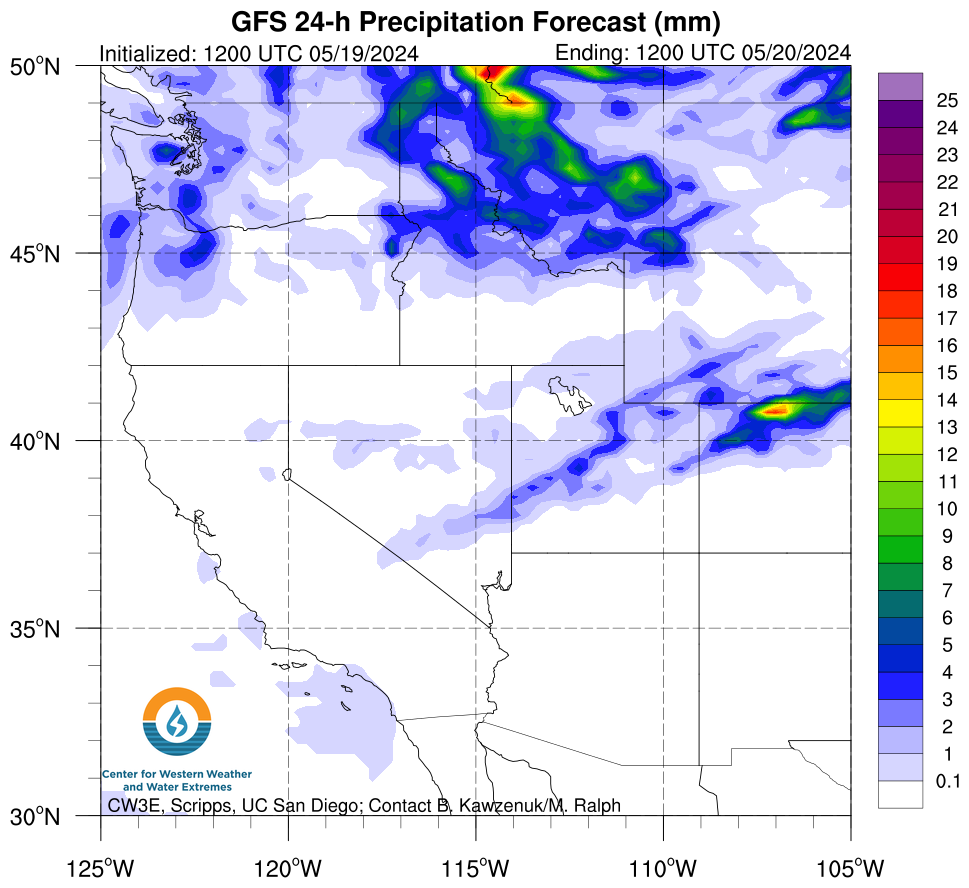
Quantitative Precipitation Forecasts
The products are provided “as is” and are intended for research purposes only (disclaimer).
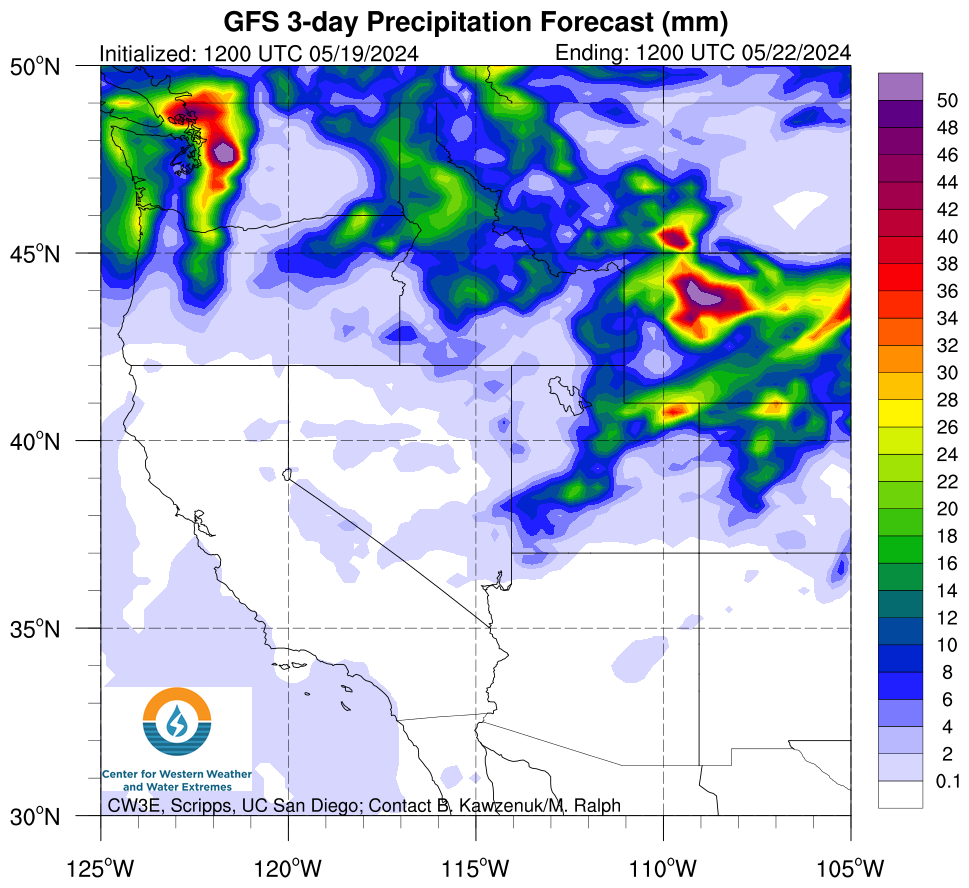
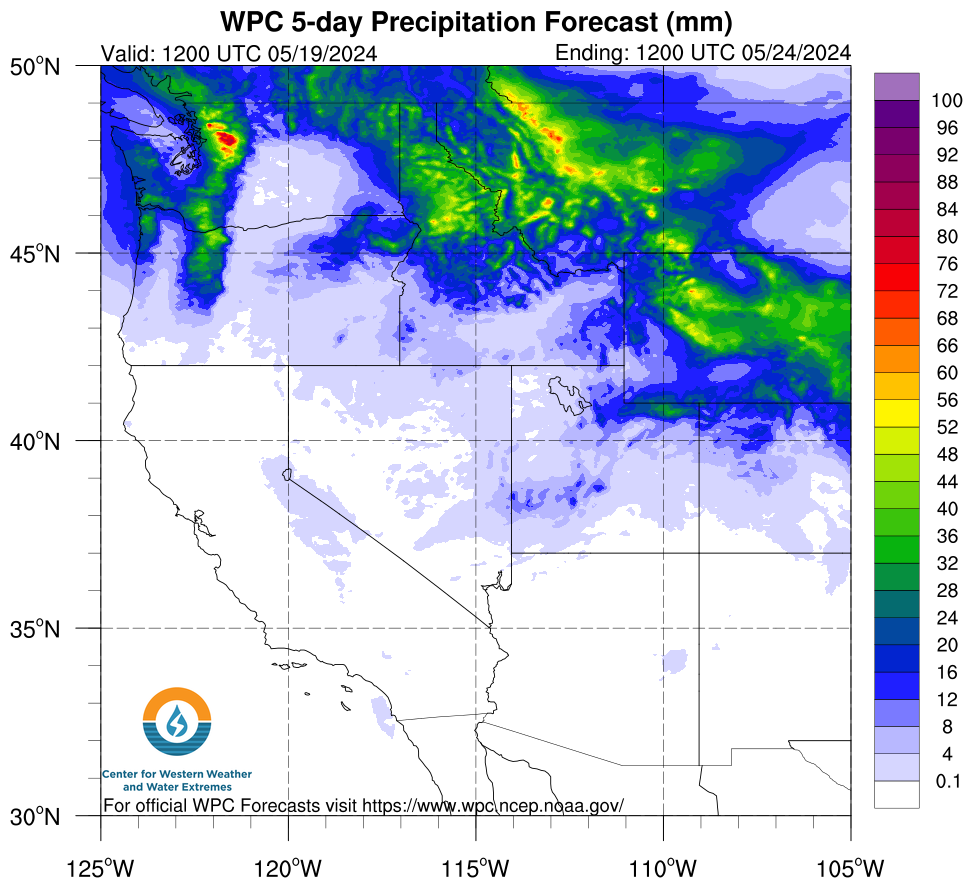
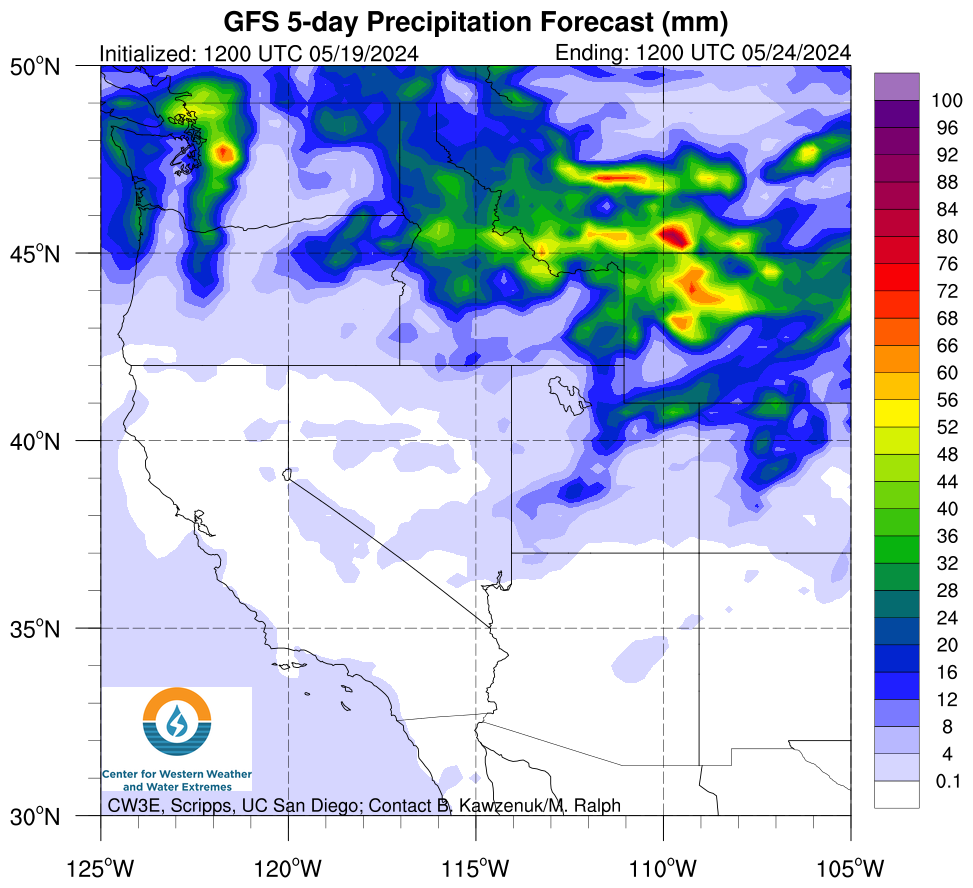
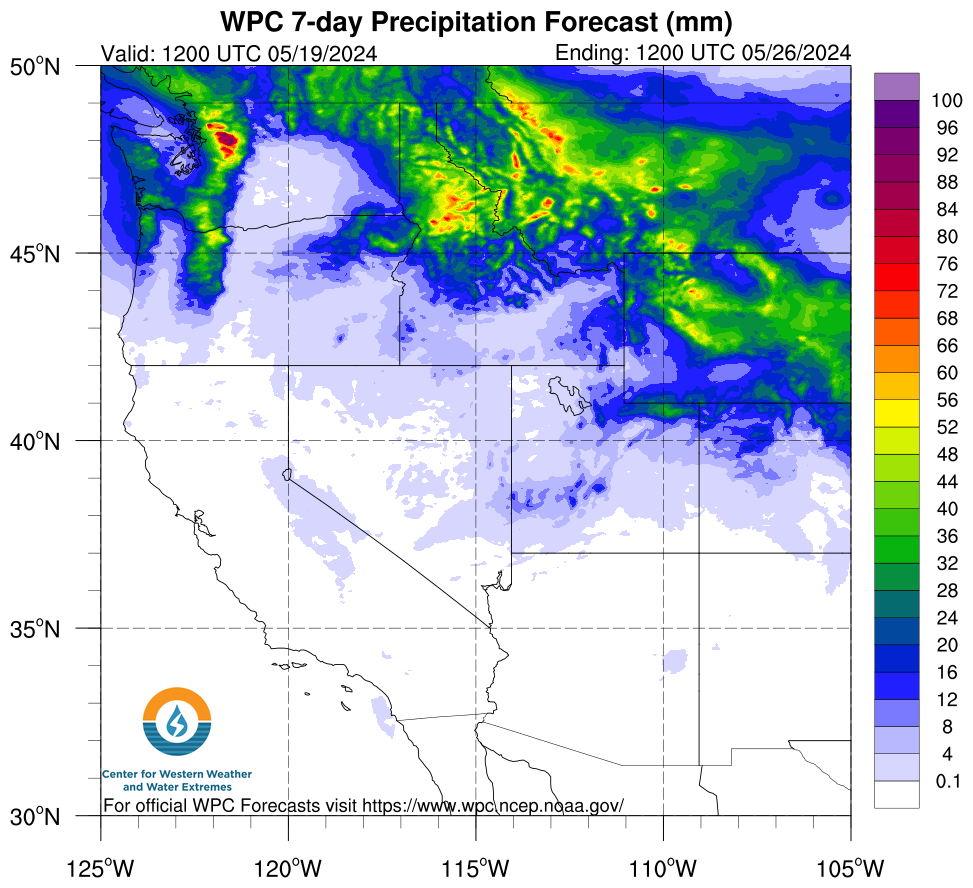
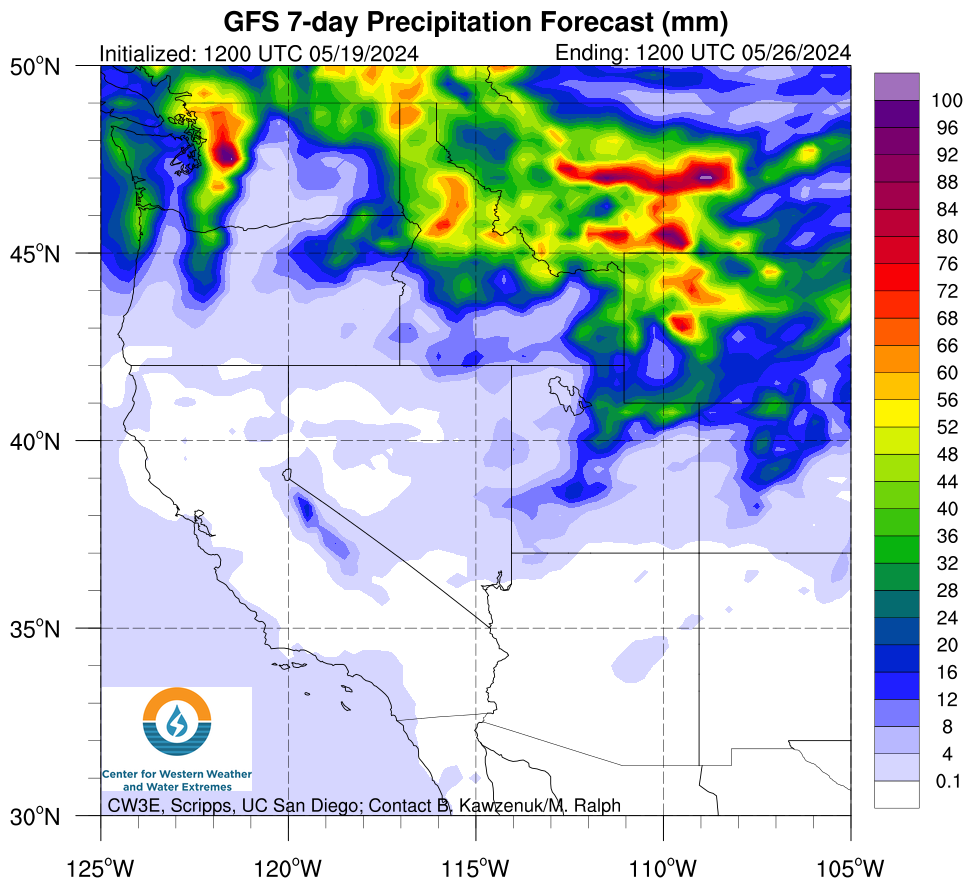
This page contains 1, 3, 5, and 7-day Quantitative Precipitation Forecasts (QPF) from the NCEP Weather Prediction Center (WPC), the NCEP Global Forecast System (GFS) Model, and the European Centre for Medium-Range Weather Forecasts (ECMWF) model. Below are links for 6-hourly QPF maps from the GFS and ECMWF and 3 and 24-hourly QPF maps from the West-WRF.
| 6-hourly QPF | West-WRF hourly QPF | West-WRF Accumulated QPF |
Weather Prediction Center (WPC) |
NCEP Global Forecast System (GFS) |
European Centre for Medium-Range Weather Forecasts (ECMWF) |
|
1-day QPF |
 |
 |
 |
3-day QPF |
 |
 |
 |
5-day QPF |
 |
 |
 |
7-day QPF |
 |
 |
 |
Odds of Reaching 100% of Normal Water Year Precipitation
Drought status is often represented by maps of how much precipitation has fallen in the year to date, or how that amount differs from normal amounts of precipitation to date. A somewhat different viewpoint on the development of drought considers how much precipitation has fallen (or not) and how much is likely to fall in coming months, based on climatology. Click the image below to see maps of this and previous years’ drought development that explicitly takes both of these aspects into account.
