CW3E Observations
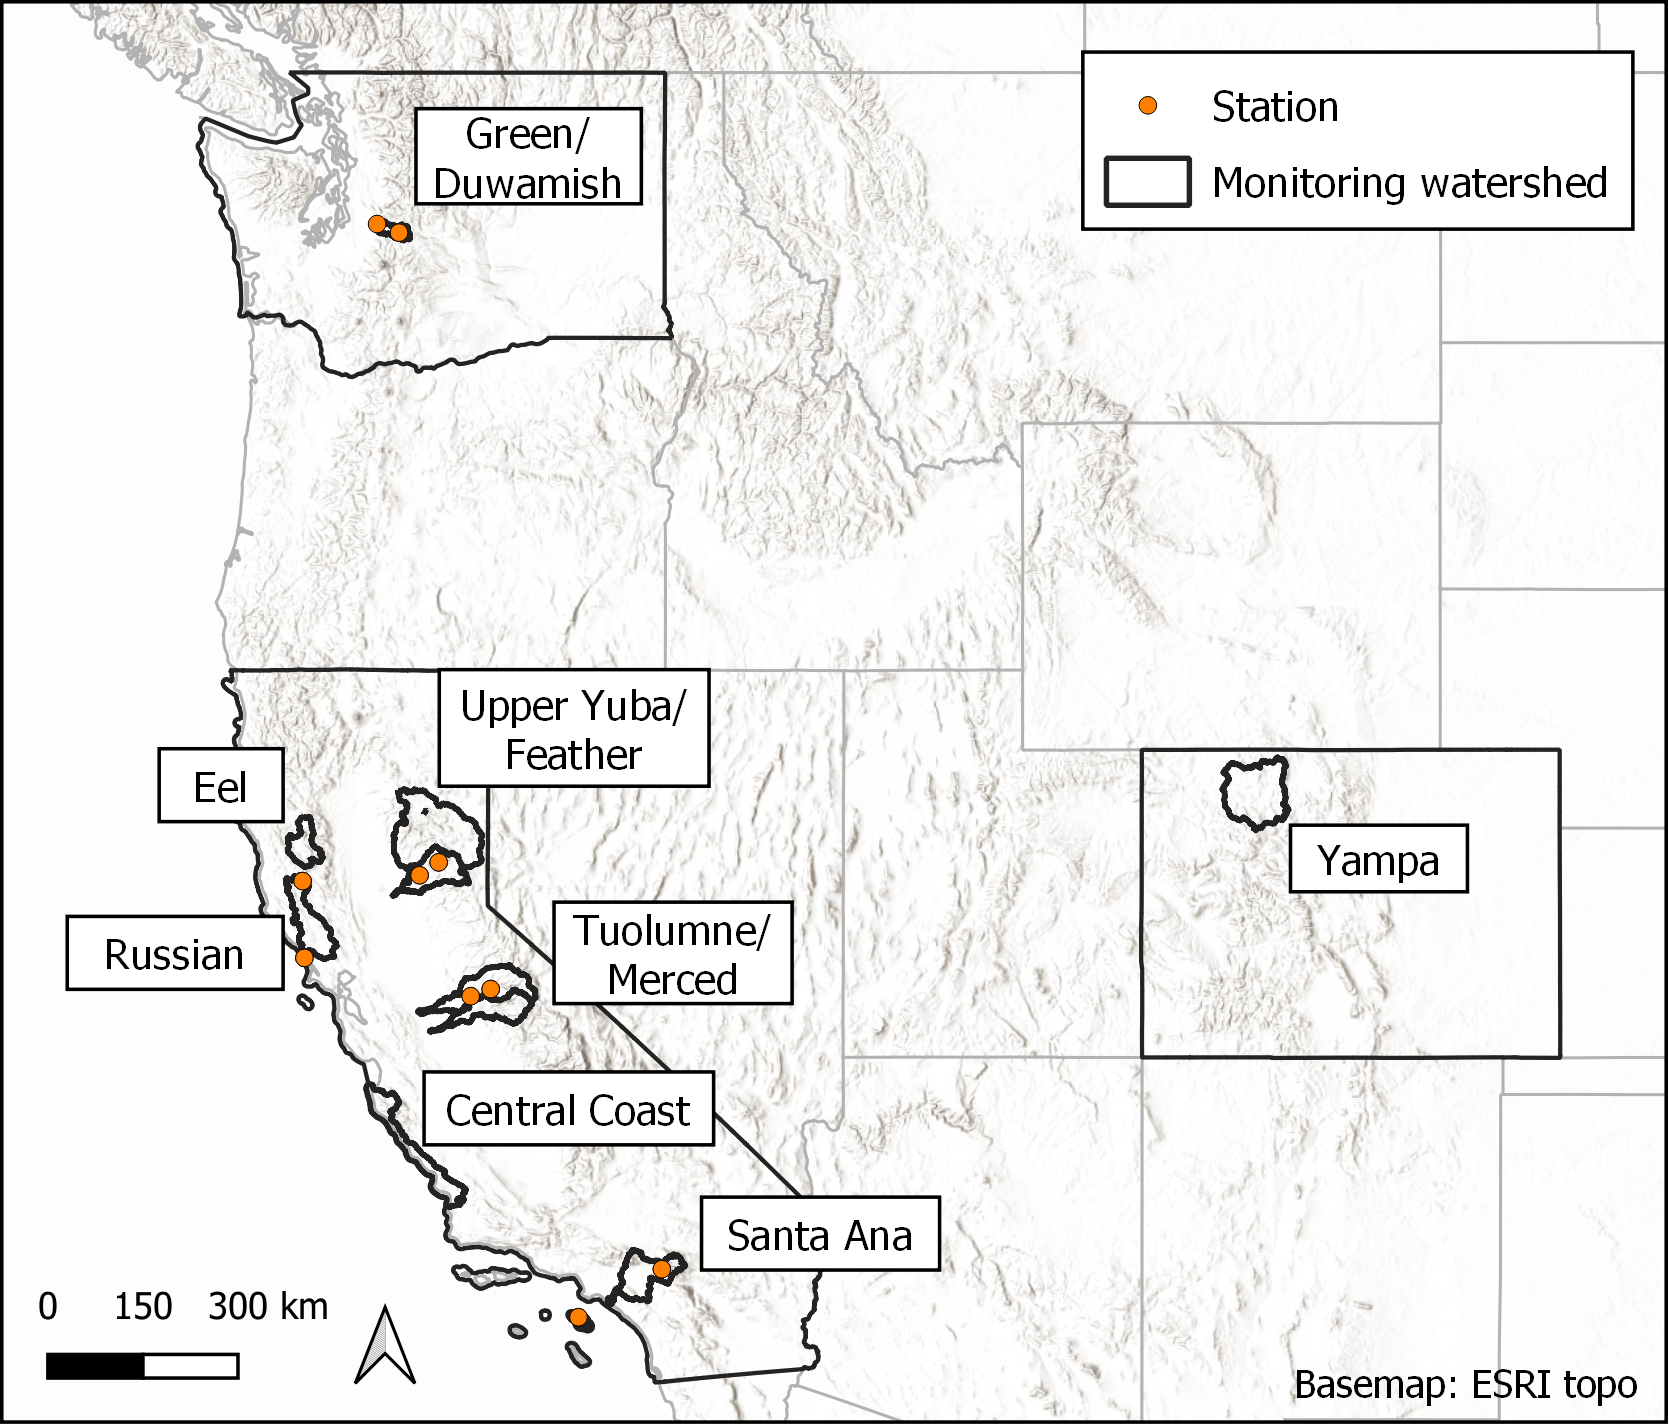
MicroRain Radars
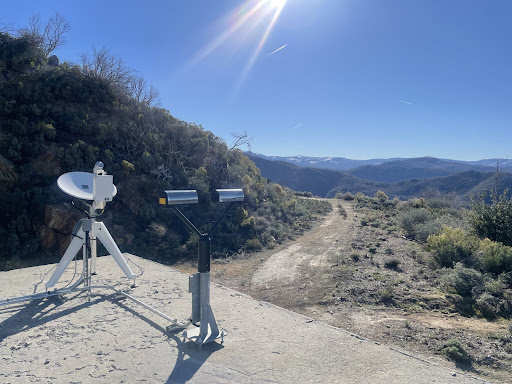
As part of CW3E’s goals to observe the hydrometeorology of the western United States, we have deployed vertically pointing MicroRain Radars (MRRs), which measure the reflectivity and fall velocity up to 3,000 meters above the instrument. These sensors collect raw spectra at 10 second intervals. The following plots, which indicate the snow level and rain type, are updated at least once per day and up to once per hour, depending on the station. The majority of our MRRs are co-located with disdrometers as well as surface meteorological stations. Below is an image of the MRR set up as well as plots from current MRR data.
CW3E would like to acknowledge our sponsors as well as our partners and collaborators that supported these instruments and allowed the deployment of these stations on their property. For more information about CW3E’s sponsors and collaborators on the MRR stations, please see the bottom of the page.
CW3E snow level data calculated from the MRRs is also available on CDEC.
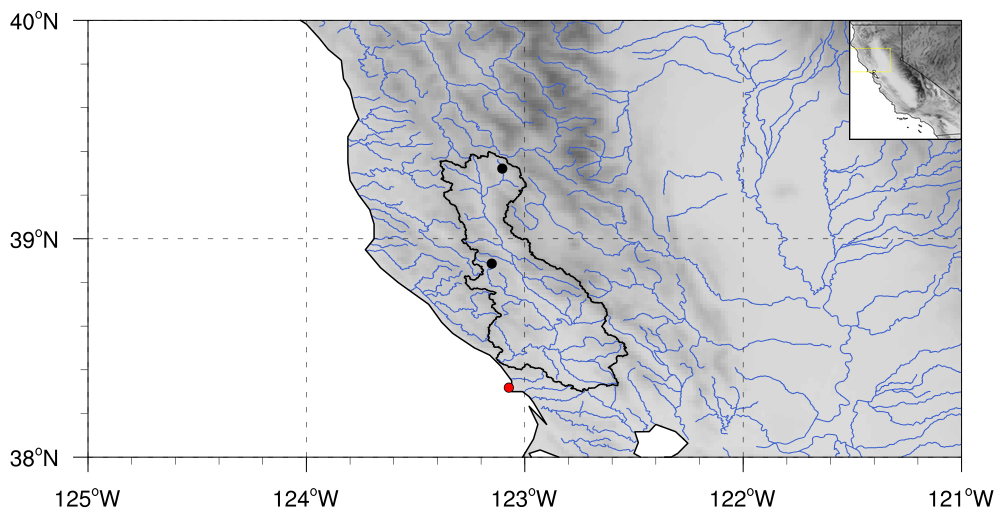
Plot description: The following plots show data collected from the MRR station highlighted on the map. The top panel shows reflectivity shaded by color and the bottom panel shows vertical velocity. MRR data are processed using an algorithm based on Maahn and Kollias 2012 but modified to improve the representation of heavy rain. Black circles represent the snow level indicated by a radar bright band when bright band precipitation is present. The bar at the bottom of each chart shows the precipitation type (bright band:light gray, hybrid:medium gray, or non-bright band:dark gray). Both the snow level and precipitation type are derived using an algorithm modified from White et al. 2003. Raw spectra measurements are collected every 10 seconds. Each plot shows the current day’s data, with time moving from left to right. Data is updated at least once per day and up to once every hour, depending on station. Time is in UTC. For an archive of processed 5 minute data and images click here.
|
 |
Our sponsors and collaborators
We would like to acknowledge our sponsors as well as our partners and collaborators that supported these instruments and allowed the deployment of these stations on their property.
CW3E’s stations in the Tuolumne-Merced watershed were initially sponsored by NOAA and are now supported by California Department of Water Resources (DWR). Station location support comes from our partners at San Francisco Public Utilities Commission, National Parks Service and private landowners. In the Russian River, the stations are sponsored by USACE, and the sites were made possible through collaboration with Potter Valley Fire Department and UC Davis Bodega Marine Lab. The stations in the Yuba-Feather watershed are sponsored by the Department of Water Resources and Yuba Water Agency and sites were made possible through Yuba Water Agency and private landowners. In the Santa Ana watershed, CW3E stations are sponsored by USACE, and sites were made possible in collaboration with San Bernardino County Flood Control District and University of Southern California Wrigley Marine Science Center.
The products are provided “as is” and are intended for research purposes only (disclaimer). All products on this page are considered experimental.