Atmospheric River Reconnaissance
Goal: Support water management decisions and flood forecasting by developing and testing the potential of targeted airborne and buoy observations over the Northeast Pacific to improve forecasts of the landfall and impacts of atmospheric rivers on the U.S. West Coast at lead times of 1-5 days. Innovations in targeting methods, data assimilation and regional forecast skill requirements are pursued through collaborative, cross-disciplinary, science-based strategies.
AR Recon is proud to be a World Weather Research Program endorsed project as of 2024.
|
PI: |
F. Martin Ralph (UC San Diego/Scripps Institution of Oceanography/CW3E) |
Co-PI: |
Vijay Tallapragada (NOAA/NWS/NCEP/Environmental Modeling Center) |
|
Primary Sponsors: |
US Army Corps of Engineers, California Dept. of Water Resources, US Air Force Reserve Command 53rd Weather Reconnaissance Squadron, and NOAA OMAO |
|
Facility Partners: |
US Air Force Reserve Command 53rd Weather Reconnaissance Squadron, NOAA Aircraft Operations Center |
|
Modeling Partners: |
CW3E (Ralph), NCEP/EMC (Tallapragada), NRL (Doyle), NCAR (Davis), ECMWF (Pappenberger), CU Boulder (Subramanian) |
|
Other Key Partners: |
NWS Western Region, Northern Illinois University, SUNY Albany, WindBorne Systems |
AR Recon Modeling and Data Assimilation Steering Committee:
|
Name |
Title |
Institution |
Role |
|
F. Martin Ralph |
Director, Center for Western Weather and Water Extremes |
Scripps Institution of Oceanography, UC San Diego |
AR Recon PI and steering committee co-chair |
|
Vijay Tallapragada |
Chief, Modeling and Data Assimilation Branch, National Centers for Environmental Prediction |
National Oceanic and Atmospheric Administration |
AR Recon co-PI and steering committee co-chair |
|
James Doyle |
Senior Scientist, Marine Meteorology Division |
Naval Research Laboratory |
AR Recon adjoint modeling lead and steering committee member |
|
Aneesh Subramanian |
Assistant Professor |
University of Colorado Boulder |
AR Recon data assimilation lead and steering committee member |
|
Luca Delle Monache |
Deputy Director, Center for Western Weather and Water Extremes |
Scripps Institution of Oceanography, UC San Diego |
Data assimilation steering committee member |
|
Chris Davis |
Associate Director, Mesoscale and Microscale Meteorology Laboratory |
National Center for Atmospheric Research |
AR Recon observation targeting lead and steering committee member |
|
Florian Pappenberger |
Director of Forecasts |
European Centre for Medium-Range Weather Forecasts |
Data assimilation steering committee member |
|
Carolyn Reynolds |
Lead Scientist, Probabilistic Prediction Research Office |
Naval Research Laboratory |
Data assimilation steering committee member |
AR Recon Overview
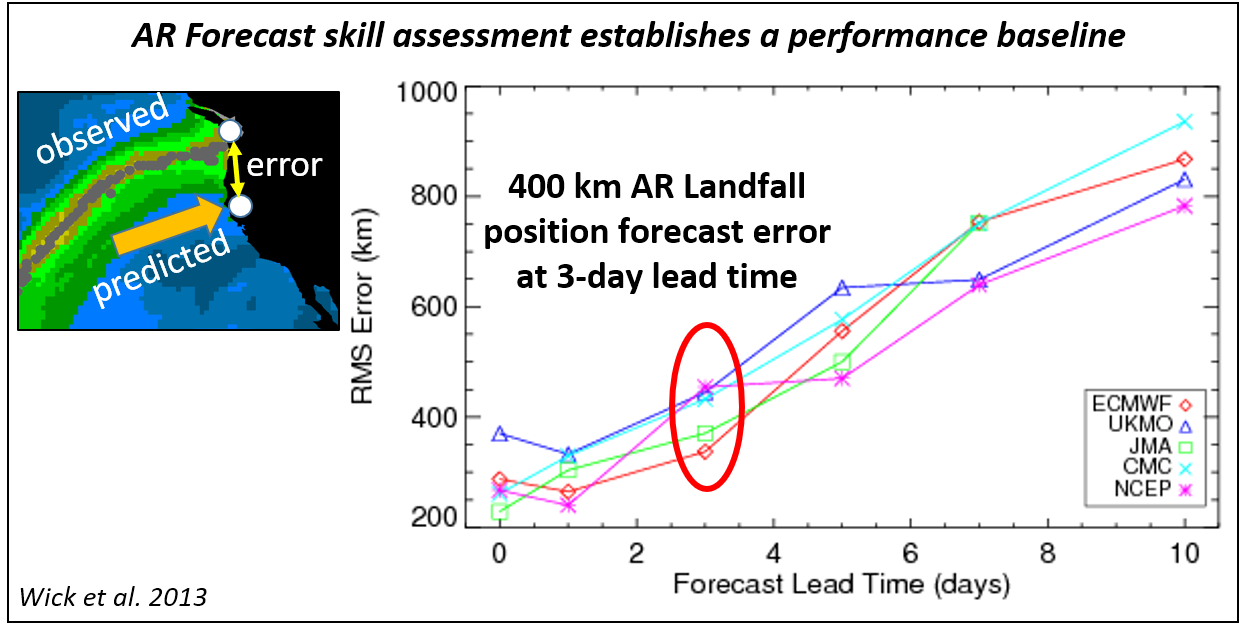
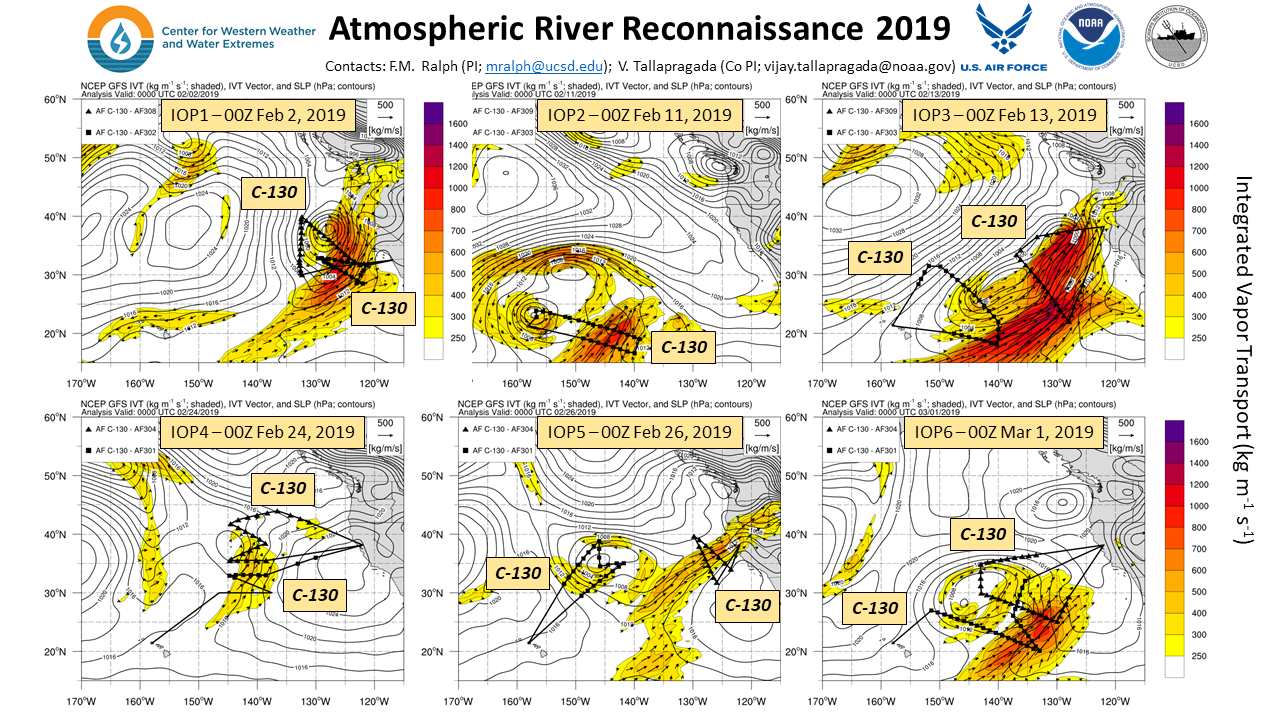
CW3E works directly with water managers in the West to develop science and tools designed to better prepare for the variability inherent in the western US climate. Atmospheric River (AR) Reconnaissance (AR Recon) campaigns support improved prediction of landfalling ARs on the U.S. west coast. ARs are a type of storm that is key to the region’s precipitation, flooding, and water supply. Forecasts of landfalling ARs are critical to precipitation prediction and yet are in error by +/- 400 km at even just 3-day lead time (see figure to the right; Wick et al. 2013). The concept for AR Recon was first recommended in a report to the Western States Water Council (Ralph et al. 2014) that was prepared by a broad cross-disciplinary group in 2013. AR Recon was conducted with 3 missions in 2016, 6 in 2018, and 6 in 2019 (shown in figures below). USACE and the California Department of Water Resources were key sponsors of the AR Recon 2018 and 2019 campaigns.
 |
 |
 |
|
Summary of flights for the IOPs in 2016 (left), 2018 (center), and 2019 (right). Colorfill and vectors on the maps represent Integrated Vapor Transport (IVT), contours show sea level pressure, flights tracks are shown by black lines, and dropsonde locations with various symbols. |
||
AR Recon is a collaborative effort led by CW3E involving several partners in the U.S. and abroad, with experts on midlatitude dynamics, ARs, airborne reconnaissance, and numerical modeling. In addition to CW3E at UC San Diego’s Scripps Institution of Oceanography, involved organizations include NOAA (NWS’ NCEP and Western Region, OMAO/Aircraft Operations Center), NRL, the Air Force Reserve Command 53rd Weather Reconnaissance Squadron, NCAR, SUNY Albany, Northern Illinois University, WindBorne Systems, the Lagrangian Drifter Laboratory, and ECMWF. Researchers from the universities and centers participated in the forecasting, flight planning, and modeling experiments. Analysis of the impact of the data is ongoing, including the development of specialized assimilation methods. The following are key investigators in the forecasting and flight planning efforts:
- PI and Mission Director: F. M. Ralph (CW3E)
- Co-PIs: V Tallapragada (NCEP)
- Adjoint Sensitivity: J. Doyle (NRL) and C. Reynolds (NRL)
- Ensemble Sensitivity: R. Torn (SUNY Albany), X. Wu (NCEP), P. Black (NCEP), K. Wu (NCEP), and T. Elless (NCEP)
- Flight Execution: Major R. Rickert (AF) and J. Parrish (NOAA G-IV)
- Coordinators: A. Wilson and A. Cobb (Overall Coordinator – CW3E), F. Cannon and A. Cobb (Flight Track Coordinator – CW3E)
- Target Advisors: C. Davis (NCAR), J. Rutz (NWS Western Region), J. Cordeira (Plymouth State), L. Bosart (SUNY Albany), C. Reynolds (NRL), F. Cannon (CW3E), and M. Zheng (CW3E)
- Forecasting Team: C. Hecht (CW3E), B. Kawzenuk (CW3E), Chris Castellano (CW3E), J. Cordeira (Plymouth State Univ.), A. Michaelis (Northern Illinois Univ.), A. Cobb (CW3E), J. Rutz (NWS), D. Lavers (ECMWF), A. Subramanian (UC Boulder), and M. DeFlorio (CW3E)
- Airborne Radio Occultation (ARO) Profiles: P.I. J.Haase (Scripps/UCSD), ARO Observations Lead Bing Cao (Scripps/UCSD)
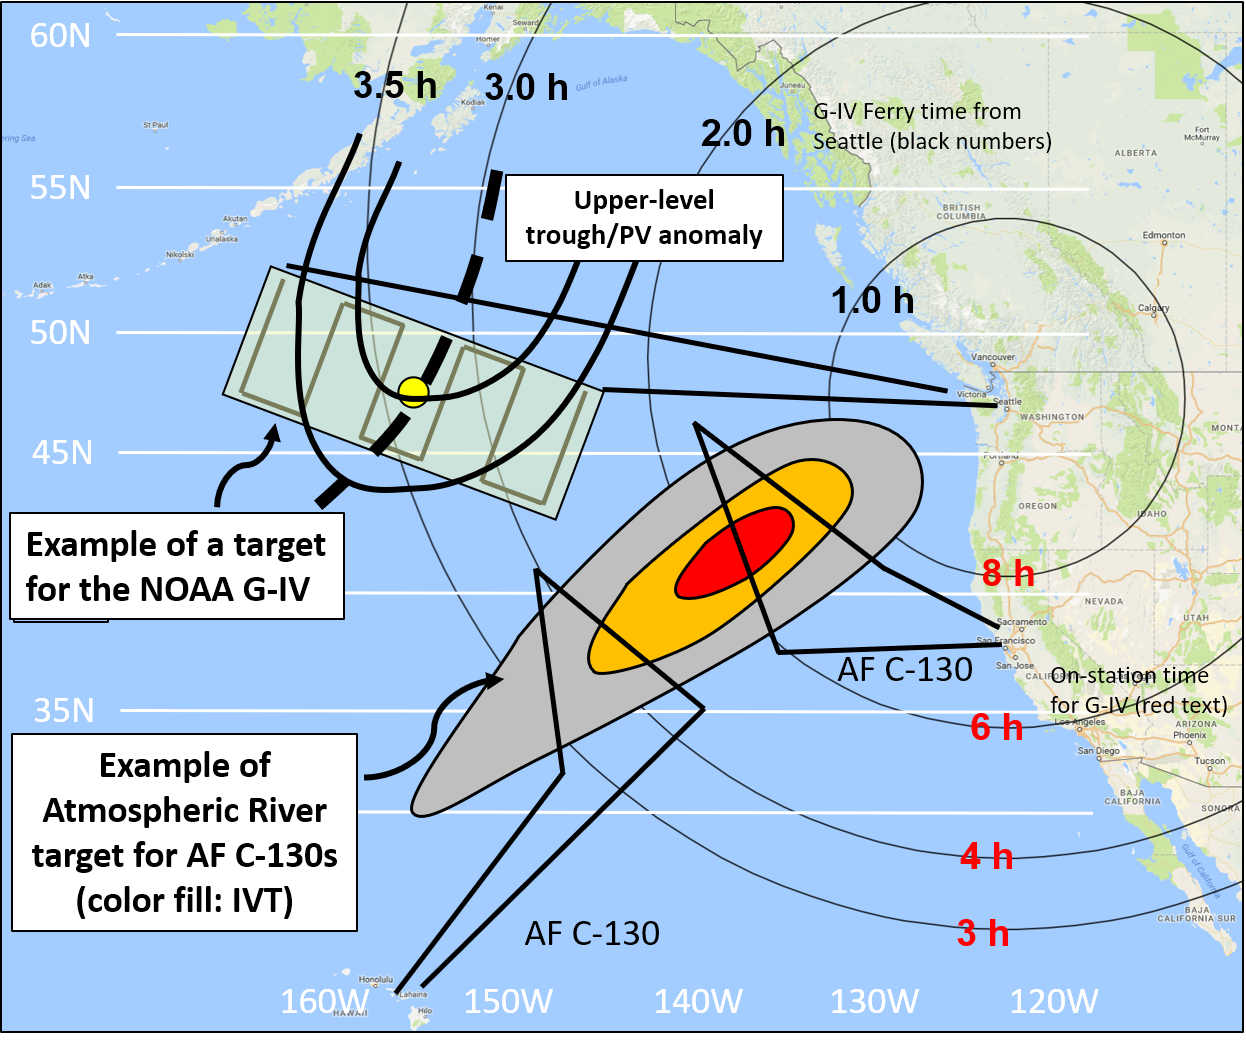
Aircraft that are normally used for hurricane reconnaissance were deployed over the northeast Pacific to collect observations to support improved AR forecasts. The data were assimilated by global modeling centers in real-time. These aircraft included two of the Air Force Reserve Command 53rd Weather Reconnaissance Squadron’s WC-130J Hurricane Hunter aircraft, and in 2018, the NOAA’s Gulfstream IV (G-IV). An example flight strategy utilizing these three aircraft is shown to the right. The primary data collected were from the release of dropsondes, which record temperature, wind, and relative humidity at very high resolution throughout the atmosphere. In 2018, Scripps researchers flew additional instrumentation aboard the NOAA G-IV to characterize the upper atmosphere poleward of the ARs. A simplified version of the GNSS Instrument System for Multistatic and Occultation Sensing was used to measure profiles of the atmospheric environment to the sides of the aircraft while dropsondes measured profiles directly below the aircraft. In 2021 and 2022, WindBorne Systems launched Global Sounding Balloons from South Korea, Alaska and Hawaii and collected observations of temperature, pressure, wind, and relative humidity as they balloons crossed the Pacific. The balloons were directed to repeatedly ascend and descend from near surface (~1.5km) to lower stratosphere (~15km) to collect vertical profiles.
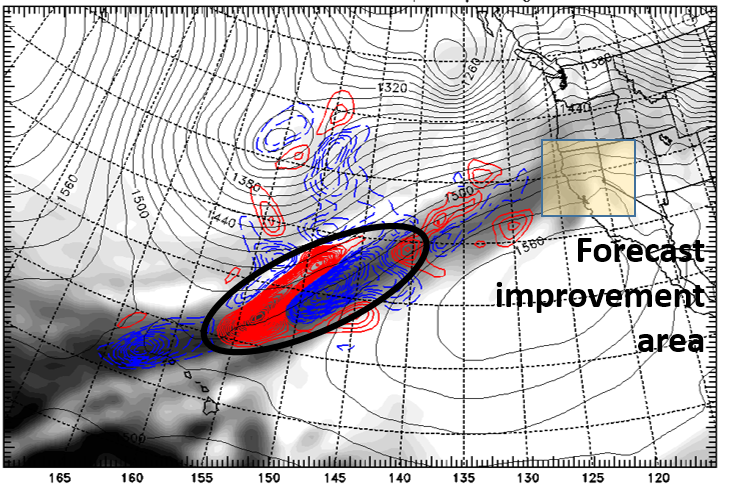
Color contours show the forecast sensitivity to 850-hPa water vapor (grey shading) uncertainty for a 36-hour precipitation forecast over Northern California. Figure from J. Doyle.
AR Recon in 2018 and 2019 made use of different models that quantitatively pinpoint locations of greatest sensitivity in the forecast – which is centered typically on the atmospheric river core (forecast example to the right). This moisture sensitivity is substantially larger than temperature, wind, or any other sensitivity. The field campaign refined how the tools work, and that information was combined with knowledge of dynamically significant meteorological features such as the upper-level jet, cold-air troughs, and other features to specify each mission’s detailed flight tracks. The targeted dropsonde profiles collected in the otherwise data sparse ocean may be part of the solution to improve AR predictability. Not only were these data assimilated into operational forecast models, but the information collected will be used in research studies to further understand the dynamics and processes that are the main drivers of key AR characteristics such as strength, position, length, orientation, and duration.
Below is a table summarizing the aircrafts used, number of dropsondes deployed, flight hours of each flight, takeoff and landing location for each flight, and the number of dropsondes assimilated into NCEP, ECMWF, and U.S. Navy atmospheric models.
Date |
IOPs |
Flights |
AF C-130J |
AF C-130J |
NOAA G-IV |
Assimilated Drops (18/00/06 UTC)* | ||
Dropsondes (Bad drops) / Flight hours |
NCEP |
ECMWF |
Navy | |||||
2024 Totals |
40 |
57 |
647 (14) / 226.4 |
203 (3) / 67.8 |
616 (12) / 148.3 |
|||
2023 Totals |
39 |
51 |
825 (66) / 283.8 |
555 (47) / 132 |
22 / 1207 / 10 |
20 / 844 / 0 | ||
2022 Totals |
25 |
32 |
465 (41) / 177.3 |
27 (3) / 10.1 |
310 (12) / 79.6 |
0 / 742 / 0 |
123 / 451/ 0 |
0 / 685 / 0 |
2021 Totals |
29.5 |
46 |
613 (72) / 216.9 |
103 (4) / 34.7 |
563 (65) / 137.9 |
20 / 1029 / 13 |
102/906/0 |
20 / 1098 / 21 |
2020 Totals |
17 |
31 |
177 (17) / 68.3 |
231 (16) / 97.5 |
409 (23) / 105.3 |
3/620/5 |
66/559/0 |
3/456/3 |
2019 Totals |
6 |
11 |
169 (17) / 54.5 |
122 (10) / 41.4 |
0/262/2 |
17/244/0 |
256 | |
2018 Totals |
6 |
13 |
131 (2) / 47.1 |
125 (5) / 46.6 |
115 (3) / 24.6 |
2/333/0 |
311 |
333 |
2016 Totals |
3 |
6 |
155 / 33.4 |
115 / 31.3 |
157 |
|||
Date |
AF C-130J |
AF C-130J |
NOAA G-IV |
Assimilated Drops (18/00/06 UTC)* | ||
2024 |
Dropsondes (Bad drops)/Flight hours/Location** |
NCEP |
ECMWF |
Navy | ||
00 UTC 29 Feb 2024 |
25 (1)/8/MA |
|||||
00 UTC 28 Feb 2024 |
19 (4)/8.7/MA |
|||||
00 UTC 25 Feb 2024 |
26 (1)/7.3/MA |
|||||
00 UTC 19 Feb 2024 |
17 (0)/5.1/MA |
|||||
00 UTC 17 Feb 2024 |
25 (1)/9.2/MA |
|||||
00 UTC 16 Feb 2024 |
25 (1)/9.5/MA |
|||||
00 UTC 15 Feb 2024 |
25 (0)/8.9/MA |
|||||
00 UTC 14 Feb 2024 |
4 (0)/4.6/MA |
|||||
00 UTC 07 Feb 2024 |
24 (0)/8.2/MA |
|||||
00 UTC 04 Feb 2024 |
30 (0)/9/MA |
|||||
00 UTC 03 Feb 2024 |
18 (1)/7.3/MA |
|||||
00 UTC 31 Jan 2024 |
18 (2)/5.8/MA |
|||||
00 UTC 30 Jan 2024 |
3 (0)/5.3/MA |
|||||
00 UTC 27 Jan 2024 |
25 (0)/9.2/MA |
31 (1)/7.3/HI |
||||
00 UTC 26 Jan 2024 |
25 (0)/9.5/MA |
|||||
00 UTC 25 Jan 2024 |
19 (1)/7.5/MA |
16 (1)/7.7/HI |
31 (1)/6.8/HI |
|||
00 UTC 24 Jan 2024 |
19 (3)/4.2/GB |
|||||
00 UTC 23 Jan 2024 |
25 (0)/10.7/HI |
30 (0)/7.3/HI |
||||
00 UTC 22 Jan 2024 |
21 (1)/7/MA |
12 (2)/7.6/HI |
||||
00 UTC 21 Jan 2024 |
27 (2)/8.7/MA |
|||||
00 UTC 20 Jan 2024 |
25 (0)/9.9/MA |
33 (0)/ /GM |
0/25/0 |
0/25/0 | ||
00 UTC 19 Jan 2024 |
37 (2)/9/MA |
10 (0)/9.5/GM |
30 (0)/7.5/HI |
0/65/0 |
0/59/0 | |
00 UTC 18 Jan 2024 |
26 (1)/9.9/MA |
31 (1)/7.9/HI |
0/55/0 |
0/55/0 | ||
00 UTC 17 Jan 2024 |
25 (0)/9.5/GM |
30 (0)/7/HI |
0/30/0 |
0/30/0 | ||
00 UTC 16 Jan 2024 |
23 (1)/7.8/MA |
25 (0)/10.4/GM |
35 (0)/7.7/HI |
0/57/0 |
0/57/0 | |
00 UTC 13 Jan 2024 |
28 (2)/8.8/MA |
30 (0)/7/HI |
5/51/0 |
0/51/0 | ||
00 UTC 12 Jan 2024 |
26 (1)/10.2/GM |
30 (0)/ /HI |
0/30/0 |
0/0/0 | ||
00 UTC 11 Jan 2024 |
26 (1)/8.3/MA |
25 (0)/10.2/GM |
30 (0)/ /HI |
0/55/0 |
0/55/0 | |
00 UTC 10 Jan 2024 |
25 (0)/10.4/MA |
30 (0)/6.9/HI |
0/55/0 |
0/55/0 | ||
00 UTC 07 Jan 2024 |
12 (0)/ /GB |
0/12/0 |
0/12/0 | |||
00 UTC 07 Jan 2024 |
29 (1)/10.6/MA |
0/30/0 |
0/30/0 | |||
12 UTC 18 Dec 2023 |
10 (0)/ /GB |
|||||
00 UTC 18 Dec 2023 |
10 (0)/ /GB |
|||||
00 UTC 17 Dec 2023 |
10 (0)/ /GB |
31 (1)/7.9/HI |
0/30/0 |
0/30/0 | ||
00 UTC 16 Dec 2023 |
3 (0)/ /MA |
30 (0)/7.5/HI |
0/33/0 |
0/33/0 | ||
00 UTC 15 Dec 2023 |
31 (0)/7.4/HI |
0/30/2 |
2/32/2 | |||
00 UTC 09 Dec 2023 |
30 (0)/8.1/HI |
0/30/1 |
1/31/1 | |||
00 UTC 08 Dec 2023 |
30 (0)/8.1/HI |
0/30/0 |
0/30/0 | |||
00 UTC 07 Dec 2023 |
31 (1)/8.1/HI |
0/30/0 |
0/30/0 | |||
00 UTC 06 Dec 2023 |
30 (0)/7.9/HI |
0/30/0 |
0/30/0 | |||
00 UTC 05 Dec 2023 |
31 (3)/8.3/HI |
0/28/0 |
0/28/0 | |||
00 UTC 04 Dec 2023 |
34 (4)/8.2/HI |
0/30/0 |
0/30/0 | |||
00 UTC 03 Dec 2023 |
26 (1)/10.4/MA |
0/24/1 |
4/23/0 |
0/24/1 | ||
00 UTC 15 Nov 2023 |
12 (0)/ /MA |
0/12/0 |
3/9/0 |
0/12/0 | ||
Date |
AF C-130J |
AF C-130J |
NOAA G-IV |
Assimilated Drops (18/00/06 UTC)* | ||
2023 |
Dropsondes (Bad drops)/Flight hours/Location** |
NCEP |
ECMWF |
Navy | ||
00 UTC 14 Mar 2023 |
26 (1)/8/MA |
0/25/0 |
||||
00 UTC 13 Mar 2023 |
26 (0)/6.9/MA |
0/18/0 |
||||
00 UTC 11 Mar 2023 |
26 (2)/7.8/MA |
0/24/0 |
0/24/0 | |||
00 UTC 10 Mar 2023 |
26 (2)/7/MA |
0/24/0 |
0/24/0 | |||
00 UTC 4 Mar 2023 |
14 (0)/6.6/GB |
0/14/0 |
||||
00 UTC 3 Mar 2023 |
26 (1)/5.7/GB |
0/25/0 |
||||
00 UTC 28 Feb 2023 |
22 (5)/4.5/MA |
3/14/0 |
3/14/0 | |||
00 UTC 27 Feb 2023 |
26 (0)/10.4/MA |
1/22/3 |
||||
00 UTC 25 Feb 2023 |
27 (1)/8.9/MA |
0/21/4 |
1/21/0 | |||
00 UTC 24 Feb 2023 |
26 (0)/9.4/MA |
1/25/0 |
||||
00 UTC 23 Feb 2023 |
22 (2)/7.9/MA |
1/19/0 |
1/19/0 | |||
00 UTC 21 Feb 2023 |
28 (2)/10/MA |
1/25/0 |
||||
00 UTC 20 Feb 2023 |
28 (2)/10.1/MA |
1/25/0 |
1/25/0 | |||
00 UTC 19 Feb 2023 |
30 (4)/10.2/MA |
0/25/0 |
1/25/0 | |||
00 UTC 7 Feb 2023 |
29 (5)/9.8/MA |
1/23/0 |
||||
00 UTC 5 Feb 2023 |
9 (0)/4.1/MA |
1/8/0 |
1/8/0 | |||
00 UTC 4 Feb 2023 |
7 (0)/4.8/MA |
0/7/0 |
0/7/0 |
0/7/0 | ||
00 UTC 3 Feb 2023 |
25 (0)/9.2/MA |
0/24/1 |
0/25/0 | |||
00 UTC 1 Feb 2023 |
0/5.7/MA |
3 (0)/ /HI |
3/0/0 |
3/0/0 |
3/0/0 | |
00 UTC 31 Jan 2023 |
28 (5)/9.5/MA |
30 (0)/7.8/HI |
1/36/0 |
1/36/0 | ||
00 UTC 30 Jan 2023 |
24 (2)/8.4/MA |
31 (1)/7.6/HI |
1/51/0 |
1/51/0 | ||
00 UTC 28 Jan 2023 |
34 (4)/7.7/HI |
0/30/0 |
||||
00 UTC 27 Jan 2023 |
31 (1)/7.4/HI |
0/30/0 |
0/30/0 | |||
00 UTC 18 Jan 2023 |
26 (2)/9.2/MA |
0/24/0 |
0/24/0 | |||
00 UTC 17 Jan 2023 |
25 (1)/9.5/MA |
33 (3)/7.9/HI |
0/53/0 |
0/54/0 | ||
00 UTC 16 Jan 2023 |
25 (0)/7.4/MA |
33 (4)/8.1/HI |
0/54/0 |
0/51/0 |
0/54/0 | |
00 UTC 15 Jan 2023 |
34 (4)/7/HI |
0/30/0 |
0/26/0 |
|||
00 UTC 14 Jan 2023 |
26 (1)/8.5/MA |
31 (1)/7.8/HI |
2/53/0 |
0/21/0 |
2/53/0 | |
00 UTC 13 Jan 2023 |
34 (10)/8.9/MA |
33 (3)/8/HI |
0/54/0 |
0/50/0 |
0/54/0 | |
00 UTC 12 Jan 2023 |
31 (1)/9.6/MA |
4/26/0 |
0/24/0 |
4/26/0 | ||
00 UTC 11 Jan 2023 |
26 (2)/9.3/MA |
32 (3)/7.8/HI |
0/53/0 |
0/48/0 |
0/53/0 | |
00 UTC 10 Jan 2023 |
28 (4)/6.7/MA |
36 (7)/8/HI |
0/53/0 |
0/51/0 |
0/53/0 | |
00 UTC 9 Jan 2023 |
31 (1)/7.5/HI |
0/30/0 |
0/29/0 |
0/30/0 | ||
00 UTC 8 Jan 2023 |
26 (5)/9.2/MA |
30 (0)/7.7/HI |
0/50/0 |
|||
00 UTC 7 Jan 2023 |
26 (1)/9.8/MA |
32 (2)/7.8/HI |
1/54/0 |
1/54/0 | ||
00 UTC 6 Jan 2023 |
27 (5)/9.6/MA |
0/22/0 |
2/21/0 |
0/22/0 | ||
00 UTC 18 Dec 2022 |
32 (2)/7.8/HI |
0/30/0 |
||||
00 UTC 10 Dec 2022 |
36 (7)/7.9/HI |
0/29/0 |
0/29/0 | |||
00 UTC 9 Dec 2022 |
33 (4)/8.2/HI |
0/29/0 |
2/27/0 |
0/29/0 | ||
00 UTC 6 Nov 2022 |
25 (0)/10.8/MA |
0/25/0 |
||||
00 UTC 5 Nov 2022 |
25 (0)/10.4/MA |
0/23/2 |
||||
2023 Totals |
825 (66) / 283.8 |
555 (47) / 132 |
22 / 1207 / 10 |
20 / 844 / 0 | ||
Date |
AF C-130J |
AF C-130J |
NOAA G-IV |
Assimilated Drops (18/00/06 UTC)* | ||
2022 |
Dropsondes (Bad drops)/Flight hours/Location** |
NCEP |
ECMWF |
Navy | ||
00 UTC 15 Mar 2022 |
8 (0)/4.3/TR |
|
|
0/8/0 |
|
|
00 UTC 14 Mar 2022 |
27 (3)/9.8/TR |
|
|
0/24/0 |
|
|
00 UTC 13 Mar 2022 |
4 (0)/4.5/TR |
|
4 (0)/ /FERRY |
0/8/0 |
|
0/8/0 |
00 UTC 12 Mar 2022 |
19 (1)/7.2/TR |
|
32 (3)/ 7.9/HI |
0/47/0 |
|
0/47/0 |
00 UTC 11 Mar 2022 |
25 (1)/9.7/TR |
|
31 (1)/ 8.1/HI |
0/54/0 |
|
0/54/0 |
00 UTC 10 Mar 2022 |
25 (0)/9.3/TR |
|
31 (1)/ 8.4/HI |
0/54/0 |
|
0/54/0 |
00 UTC 9 Mar 2022 |
|
|
30 (0)/8.1/HI |
0/30/0 |
|
0/30/0 |
00 UTC 4 Mar 2022 |
27 (2)/9.6/TR |
|
|
0/23/0 |
6/21/0 |
0/23/0 |
00 UTC 2 Mar 2022 |
25 (0)/8.7/TR |
|
|
0/25/0 |
5/23/0 |
0/25/0 |
00 UTC 1 Mar 2022 |
25 (0)/9.4/TR |
|
|
0/25/0 |
4/22/0 |
|
00 UTC 28 Feb 2022 |
25 (2)/10.8/TR |
|
|
0/23/0 |
6/20/0 |
0/23/0 |
00 UTC 27 Feb 2022 |
25(1)/9.6/TR |
|
|
0/24/0 |
7/22/0 |
0/24/0 |
00 UTC 26 Feb 2022 |
18 (4)/9.8/TR |
|
|
0/14/0 |
5/11/0 |
0/14/0 |
00 UTC 25 Feb 2022 |
26 (3)/10.9/TR |
|
27 (2)/ 7.9/HI |
0/48/0 |
11/46/0 |
0/48/0 |
00 UTC 24 Feb 2022 |
|
|
30 (0)/8.3/HI |
0/30/0 |
9/30/0 |
0/30/0 |
00 UTC 23 Feb 2022 |
28 (3)/9.8/TR |
|
|
0/24/0 |
6/21/0 |
0/24/0 |
00 UTC 4 Feb 2022 |
26 (4)/9.3/TR |
27 (3)/ 10.1/TR |
|
0/45/0 |
2/23/0 |
0/45/0 |
00 UTC 3 Feb 2022 |
|
|
32 (2)/7.7/HI |
0/30/0 |
8/27/0 |
0/30/0 |
00 UTC 30 Jan 2022 |
27 (2)/9.4/TR |
|
|
0/25/0 |
4/23/0 |
0/25/0 |
00 UTC 29 Jan 2022 |
20 (2)/7.3/TR |
|
31 (1)/ 8.0/HI |
0/48/0 |
10/44/0 |
0/48/0 |
00 UTC 28 Jan 2022 |
|
|
31 (1)/7.4/HI |
0/30/0 |
11/26/0 |
0/30/0 |
00 UTC 27 Jan 2022 |
|
|
31 (1)/7.8/HI |
0/30/0 |
8/27/0 |
0/30/0 |
00 UTC 13 Jan 2022 |
25 (0)/9.5/TR |
|
|
0/25/0 |
7/22/0 |
0/25/0 |
00 UTC 12 Jan 2022 |
28 (7)/8.6/TR |
|
|
0/21/0 |
7/18/0 |
0/21/0 |
00 UTC 11 Jan 2022 |
32 (5)/9.8/TR |
|
|
0/27/0 |
7/24/0 |
0/27/0 |
2022 Totals |
465 (41) / 177.3 |
27 (3) / 10.1 |
310 (12) / 79.6 |
0 / 742 / 0 |
123 / 451/ 0 |
0 / 685 / 0 |
Date |
AF C-130J |
AF C-130J |
NOAA G-IV |
Assimilated Drops (18/00/06 UTC)* | ||
2021 |
Dropsondes (Bad drops)/Flight hours/Location** |
NCEP |
ECMWF |
Navy | ||
00 UTC 18 Mar 2021 |
30 (2)/9.9/TR |
27 (3)/7.5/TR |
6/46/0 |
8/44/0 |
6/46/0 | |
00 UTC 16 Mar 2021 |
10 (0)/ /FERRY |
3/7/0 |
6/4/0 |
3/7/0 | ||
00 UTC 14 Mar 2021 |
17 (1)/6.4/RN |
31 (1)/8.3/HI |
1/45/0 |
7/39/0 |
1/45/0 | |
00 UTC 13 Mar 2021 |
31 (14)/8.9/RN |
39 (9)/8.3/HI |
4/43/0 |
9/38/0 |
4/43/0 | |
00 UTC 12 Mar 2021 |
28 (3)/9.5/RN |
38 (9)/8.4/HI |
0/54/0 |
6/47/0 |
0/54/0 | |
00 UTC 11 Mar 2021 |
20 (6)/6.9/RN |
35 (5)/8.4/HI |
0/44/0 |
2/42/0 |
0/44/0 | |
00 UTC 10 Mar 2021 |
28 (3)/10.1/RN |
0/25/0 |
2/23/0 |
0/25/0 | ||
00 UTC 9 Mar 2021 |
29 (4)/9.5/RN |
41 (11)/8.4/HI |
0/55/0 |
7/48/0 |
0/55/0 | |
00 UTC 8 Mar 2021 |
37 (2)/10.3/RN |
39 (6)/7.9/HI |
5/63/0 |
11/ 57/0 |
5/63/0 | |
00 UTC 5 Mar 2021 |
27 (1)/8.9/RN |
0/25/0 |
2/23/0 |
1/25/0 | ||
00 UTC 4 Mar 2021 |
28 (4)/9.3/RN |
0/24/0 |
3/20/0 |
0/24/0 | ||
00 UTC 3 Mar 2021 |
20 (0)/8.6/RN |
0/20/0 |
3/16/0 |
0/20/0 | ||
00 UTC 25 Feb 2021 |
25 (0)/10.4/RN |
0/25/0 |
2/22/0 |
0/25/0 | ||
00 UTC 24 Feb 2021 |
27 (2)/7.9/HI |
0/25/0 |
0/21/0 |
0/25/0 | ||
00 UTC 23 Feb 2021 |
34 (4)/7.7/HI |
0/21/9 |
0/26/0 |
0/21/9 | ||
00 UTC 22 Feb 2021 |
26 (4)/9.7/RN |
32 (2)/8.5/HI |
0/54/0 |
2/46/0 |
0/54/0 | |
00 UTC 21 Feb 2021 |
28 (4)/10.3/RN |
0/24/0 |
1/21/0 |
0/24/0 | ||
00 UTC 12 Feb 2021 |
4/6.3/RN |
0/4/0 |
3/1/0 |
0/4/0 | ||
00 UTC 10 Feb 2021 |
28 (3)/10.1/RN |
0/25/0 |
2/20/0 |
0/25/0 | ||
00 UTC 2 Feb 2021 |
30 (4)/10.1/RN |
31 (1)/7.7/HI |
0/54/0 |
6/45/0 |
0/56/0 | |
00 UTC 1 Feb 2021 |
27 (2)/8.9/RN |
32 (2)/7.9/HI |
0/55/0 |
5/47/0 |
0/55/0 | |
00 UTC 31 Jan 2021 |
13 (1)/6.5/RN |
1/11/0 |
3/9/0 |
0/11/0 | ||
00 UTC 28 Jan 2021 |
26 (1)/8.2/RN |
23 (1)/8.2/HI |
0/47/0 |
0/43/0 |
0/47/0 | |
00 UTC 27 Jan 2021 |
29 (4)/8/RN |
31 (1)/8.1/HI |
0/30/0 |
1/25/0 |
0/52/3 | |
00 UTC 26 Jan 2021 |
22 (3)/8.2/HI |
0/19/0 |
0/16/0 |
0/19/0 | ||
00 UTC 25 Jan 2021 |
30 (0)/8.1/HI |
0/30/0 |
4/23/0 |
0/30/0 | ||
00 UTC 24 Jan 2021 |
27 (2)/9.8/RN |
26 (1)/8.9/RN |
33 (3)/7.7/HI |
0/30/0 |
0/28/0 |
0/75/5 |
00 UTC 23 Jan 2021 |
35 (5)/8.2/HI |
0/26/4 |
0/27/0 |
0/26/4 | ||
00 UTC 20 Jan 2021 |
27 (2)/10.2/RN |
25 (0)/8.3/RN |
0/50/0 |
3/43/0 |
0/50/0 | |
00 UTC 17 Jan 2021 |
28 (5)/10.1/RN |
25 (0)/10/RN |
0/48/0 |
4/41/0 |
0/48/0 | |
2021 Totals |
613 (72)/216.9 |
103 (4)/34.7 |
563 (65)/137.9 |
20/1029/13 |
102/906/0 |
20/1098/21 |
Date |
AF C-130J |
AF C-130J |
NOAA G-IV |
Assimilated Drops (18/00/06 UTC)* | ||
2020 |
Dropsondes (Bad drops) / Flight hours / Location** |
NCEP |
ECMWF |
Navy | ||
00 UTC 11 Mar 2020 |
2 (0) / 5.3 / RN |
0/2/0 |
1/1/0 |
0/2/0 | ||
00 UTC 10 Mar 2020 |
30 (0) / 10.6 / RN |
27 (0) / 8.4 / PDX |
5/51/0 |
|||
00 UTC 9 Mar 2020 |
23 (3) / 7.8 / RN |
29 (0) / 8.1 / PDX |
3/26/0 |
|||
00 UTC 8 Mar 2020 |
28 (3) / 11.4 / RN |
31 (1) / 8.1 / PDX |
0/54/1 |
5/49/0 |
0/54/1 | |
00 UTC 7 Mar 2020 |
31 (1) / 8.0 / PDX |
0/30/0 |
4/26/0 |
0/30/0 | ||
00 UTC 2 Mar 2020 |
27 (5) / 8.3 / RN |
25 (1) / 9.4 / PDX |
30 (0) / 8.0 / PDX |
0/74/2 |
4/72/0 |
0/74/0 |
00 UTC 24 Feb 2020 |
29 (3) / 8.6 / HI |
32 (2) / 8.0 / PDX |
1/55/0 |
5/51/0 |
||
00 UTC 21 Feb 2020 |
30 (0) / 8.6 / PDX |
1/29/0 |
4/26/0 |
1/29/0 | ||
00 UTC 16 Feb 2020 |
30 (0) / 7.2 / PDX |
0/30/0 |
3/27/0 |
0/30/0 | ||
00 UTC 15 Feb 2020 |
26 (1) / 11.2 / HI |
31 (6) / 8.4 / RN-PDX |
35 (5) / 8.0 / PDX |
0/78/2 |
8/73/0 |
1/78/2 |
00 UTC 14 Feb 2020 |
30 (0) / 8.2 / PDX |
0/27/0 |
2/28/0 |
0/30/0 | ||
00 UTC 6 Feb 2020 |
25 (3) / 9.5 / HI |
26 (1) / 10.1 / PDX |
35 (5) / 8.1 / PDX |
0/59/0 |
5/54/0 |
0/59/0 |
00 UTC 5 Feb 2020 |
34 (4) / 8.5 / PDX |
0/30/0 |
0/30/0 |
0/30/0 | ||
00 UTC 4 Feb 2020 |
19 (4) / 9.7 / HI |
25 (0) / 10.1 / TR-PDX |
35 (5) / 8.1 / PDX |
0/70/0 |
5/65/0 |
|
00 UTC 31 Jan 2020 |
25 (1) / 10.5 / TR |
0/24/0 |
2/22/0 |
|||
00 UTC 29 Jan 2020 |
26 (1) / 10.8 / HI |
2 (0) / 5.1 / TR |
0/21/0 |
4/23/0 |
||
00 UTC 24 Jan 2020 |
25 (0) / 10.2 / HI |
14 (1) / 8.8 / TR |
1/37/0 |
6/32/0 |
1/40/0 | |
2020 Totals |
177 (17) / 68.3 |
231 (16) / 97.5 |
409 (23) / 105.3 |
3/620/5 |
66/559/0 |
3/456/3 |
Date |
AF C-130J |
AF C-130J |
NOAA G-IV |
Assimilated Drops (18/00/06 UTC)* | ||
2019 |
Dropsondes (Bad drops) / Flight hours / Location** |
NCEP |
ECMWF |
Navy | ||
00 UTC 1 Mar 2019 |
31 (1) / 9.4 / HI-TR |
33 (4) / 10.2 / TR |
0/59/0 |
5/50/0 |
59 | |
00 UTC 26 Feb 2019 |
22 (1) / 9.8 / HI |
14 (0) / 5.9 / TR |
0/35/0 |
2/33/0 |
35 | |
00 UTC 24 Feb 2019 |
28 (6) / 10.4 / TR-HI |
24 (1) / 9.7 / TR |
0/45/0 |
2/43/0 |
45 | |
00 UTC 13 Feb 2019 |
27 (2) / 8.1 / HI |
26 (3) / 9.5 / TR |
0/47/1 |
5/43/0 |
40 | |
00 UTC 11 Feb 2019 |
26 (2) / 8.9 / HI |
0/24/0 |
3/21/0 |
24 | ||
00 UTC 2 Feb 2019 |
35 (5) / 7.9 / SD |
25 (2) / 6.1 / SD |
0/52/1 |
0/52/0 |
53 | |
2019 Totals |
169 (17) / 54.5 |
122 (10) / 41.4 |
0/262/2 |
17/244/0 |
256 | |
Date |
AF C-130J |
AF C-130J |
NOAA G-IV |
Assimilated Drops (18/00/06 UTC)* | ||
2018 |
Dropsondes (Bad drops) / Flight hours / Location** |
NCEP |
ECMWF |
Navy | ||
00 UTC 28 Feb 2018 |
25 (0) / 9.6 / TR |
0/25/0 |
25 |
25 | ||
00 UTC 26 Feb 2018 |
30 (0) / 8.7 / HI |
0 |
0 |
0 | ||
00 UTC 3 Feb 2018 |
25 (0) / 9.9 / HI |
25 (1) / 9.7 / TR |
39 (2) / 8.1 / PDX |
0/86/0 |
86 |
86 |
00 UTC 1 Feb 2018 |
25 (0) / 8.5 / HI |
25 (1) / 9.2 / TR |
40 (1) / 8.2 / PDX |
0/88/0 |
79 |
88 |
00 UTC 29 Jan 2018 |
25 (2) / 8.1 / HI |
24 (1) / 8.5 / TR |
1/47/0 |
41 |
47 | |
00 UTC 27 Jan 2018 |
26 (0) / 10.4 / HI |
26 (2) / 9.3 / TR |
36 (0) / 8.3 / PDX |
1/87/0 |
80 |
87 |
2018 Totals |
131 (2) / 47.1 |
125 (5) / 46.6 |
115 (3) / 24.6 |
2/333/0 |
311 |
333 |
Date |
AF C-130J |
AF C-130J |
NOAA G-IV |
Assimilated Drops (18/00/06 UTC)* | ||
2016 |
Dropsondes (Bad drops) / Flight hours / Location** |
NCEP |
ECMWF |
Navy | ||
00 UTC 22 Feb 2016 |
58 / 10.9 / HI |
37 / 9.8 / TR |
*** |
46 |
||
00 UTC 16 Feb 2016 |
39 / 10.4 / HI |
41 / 10.8 / MC |
*** |
42 |
||
00 UTC 14 Feb 2016 |
58 / 12.1 / HI |
37 / 10.7 / MC |
*** |
69 |
||
2016 Totals |
155 / 33.4 |
115 / 31.3 |
157 |
|||
*Dropsonde assimilation data are not currently available for all IOPs. For IOPs and models with three values listed these values represent the number of dropsondes assimilated into the 18 UTC, 00 UTC, and 06 UTC assimilation windows respectively. IOPs with one value listed are representative of the total number of dropsondes assimilated across all windows. This table will continue to be updated as data becomes available.
**Location abbreviations: GB: Gulfport-Biloxi International Airport; Gulfport MS; GM: Guam; HI: Hawaii; MA: Mather Airport, Mather CA; MC: McChord Air Force Base, Tacoma WA; PDX: Portland, OR; RN: Reno, NV; SD: San Diego, CA; TR: Travis Air Force Base, Fairfield, CA
***During 2016 the NOAA G-IV and NASA Global Hawk conducted research flights as part of the NOAA El Niño Rapid Response (ENRR) field campaign. The Global Hawk partially sampled ARs in coordination with the AR Recon C-130s. The G-IV sampled tropical conditions south of Hawaii based on ENRR’s primary airborne objectives, which focused on tropical convection. Dropsonde assimilation numbers for 2016 only include dropsondes from the AR Recon C-130s. For more information on the ENRR Global Hawk and G-IV flights, see Dole at al. 2018 (Bull. Amer. Meteor. Soc.).
Note: Data is also provided on this website for the CalWater campaigns, which were scientific field studies to better understand the dynamics of ARs offshore and aerosol transports.
Ralph, F.M., M.D. Dettinger, A. White, D. Reynolds, D. Cayan, T. Schneider, R. Cifelli, K. Redmond, M. Anderson, F. Gehrke, J. Jones, K. Mahoney, L. Johnson, S. Gutman, V. Chandrasekar, J. Lundquist,, N. Molotch, L. Brekke, R. Pulwarty, J. Horel, L. Schick, A. Edman, P. Mote, J. Abatzaglou, R. Pierce and G. Wick, 2014: A vision for future observations for Western U.S. extreme precipitation and flooding. Journal of Contemporary Water Research and Education, 153, 16-32. https://doi.org/10.1111/j.1936-704X.2014.03176.x
Wick, G.A., P.J. Neiman, F.M. Ralph, and T.M. Hamill, 2013: Evaluation of forecasts of the water vapor signature of atmospheric rivers in operational numerical weather prediction models. Weather and Forecasting, 28, 1337-1352. https://doi.org/10.1175/WAF-D-13-00025.1