ECMWF Ensemble Forecast Products
CW3E products are *generally* provided “as is” and are intended for research purposes only (disclaimer); however, the ECMWF forecast products specifically support the California AR Program and are solely intended for research purposes.
West Coast AR Landfall Tool
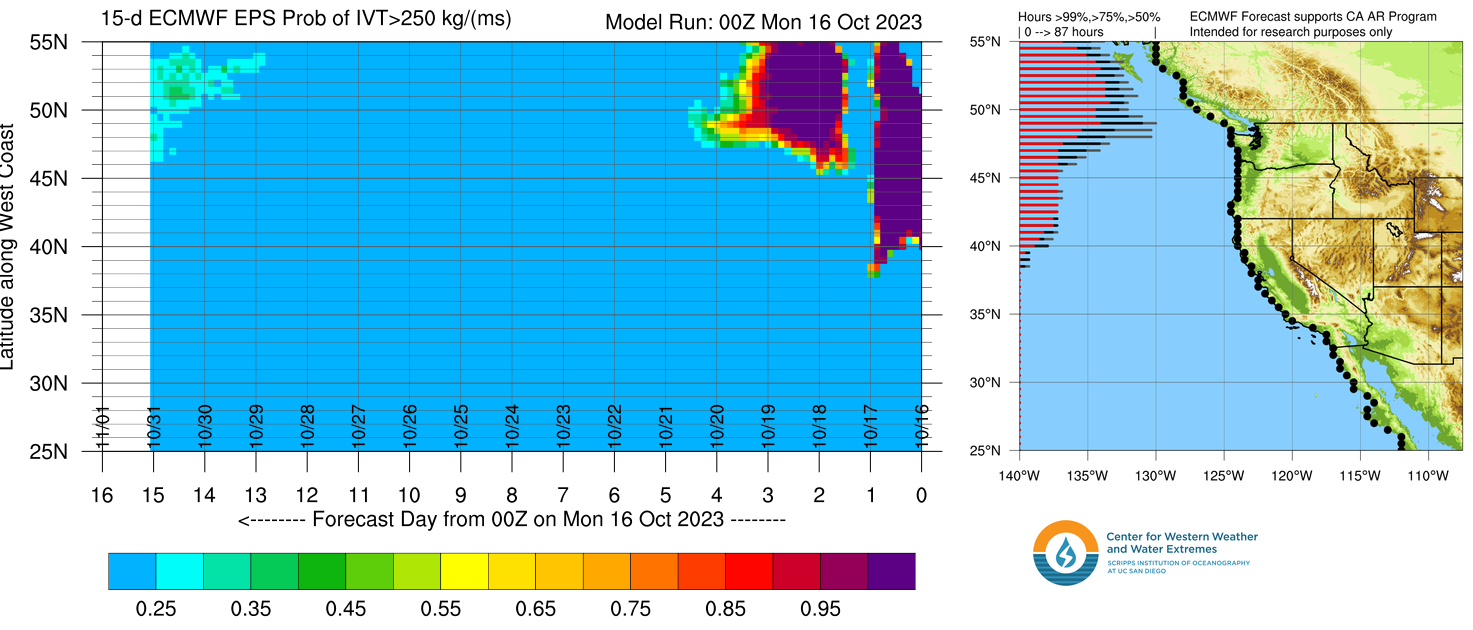
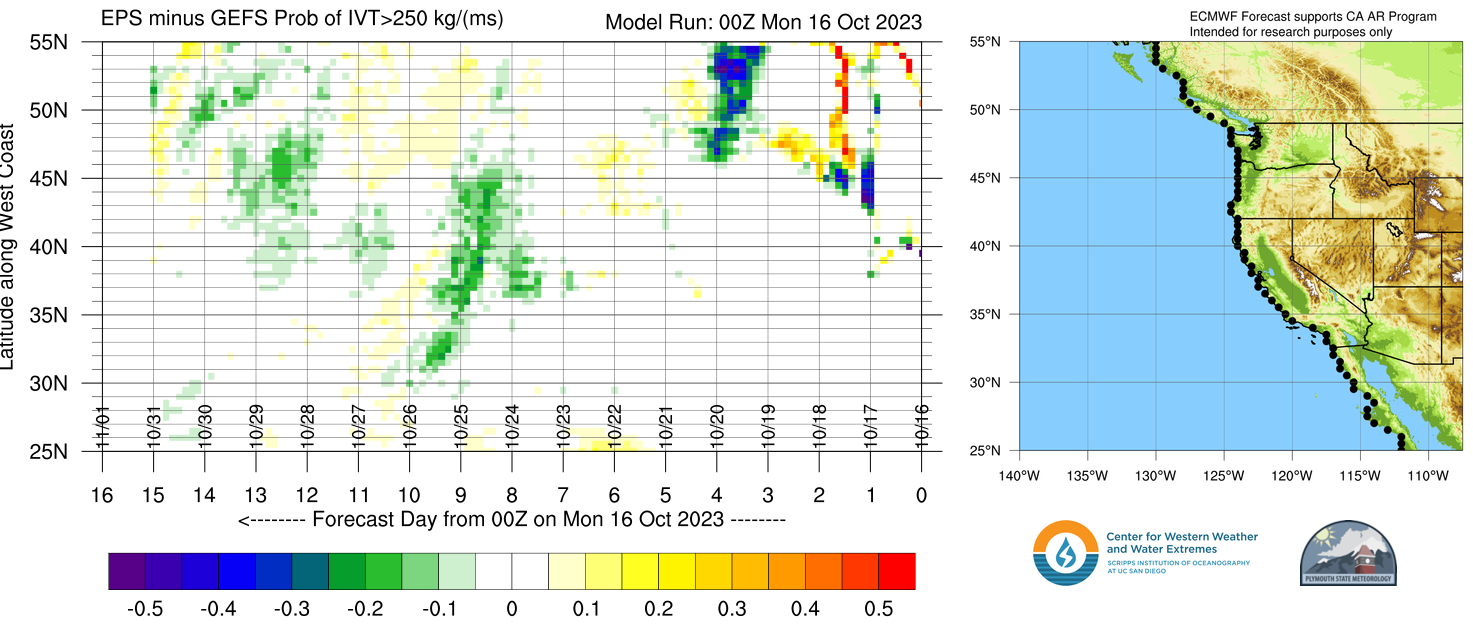
The CW3E AR Landfall Tool displays the likelihood and timing of AR conditions at each point on the map in a line along the U.S. West Coast or inland derived from the ECMWF over the next 15 days. The probability of AR conditions represents the number of ensemble members that predict IVT to be greater than the chosen threshold at the given location and time. Other options include viewing the ensemble mean IVT magnitude or the ensemble control IVT magnitude forecasts. We also display the difference of the ECMWF and the GEFS model solutions. Forecast tool developed in collaboration with Dr. Jay Cordeira at Plymouth State University.
Select variable to be displayed and location to generate plot, click image to open in a new tab.


ECMWF West Coast IVT Plume Diagrams
Developed in collaboration with Dr. Jay Cordeira, Plymouth State University
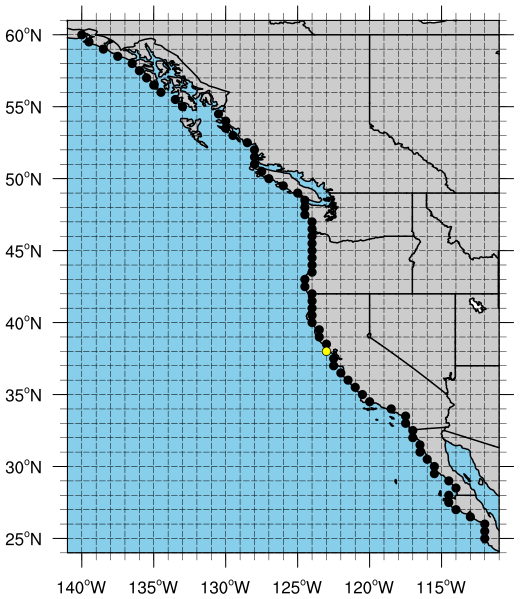
The plume diagrams below represent the integrated water vapor transport (IVT) magnitude forecast for each of the 50 perturbed ECMWF ensemble models (thin gray lines), the unperturbed ECMWF control forecast (“C”; black line), the 50-member ensemble mean (“M”; green line), and the +1/-1 standard deviation values of the ensemble (red/blue lines and gray shading). The dot on the map indicates the location of the current plot. The 10-day plume with GFS illustrates a combined plume diagram from the combined 70-member distribution.
Select forecast length of plot and coastal location to generate plot. Click image to open in new tab.
 |
 |
