GFS and ECMWF Ensemble Temperature Meteograms
The products are provided “as is” and are intended for research purposes only (disclaimer). All products on this page are considered experimental.
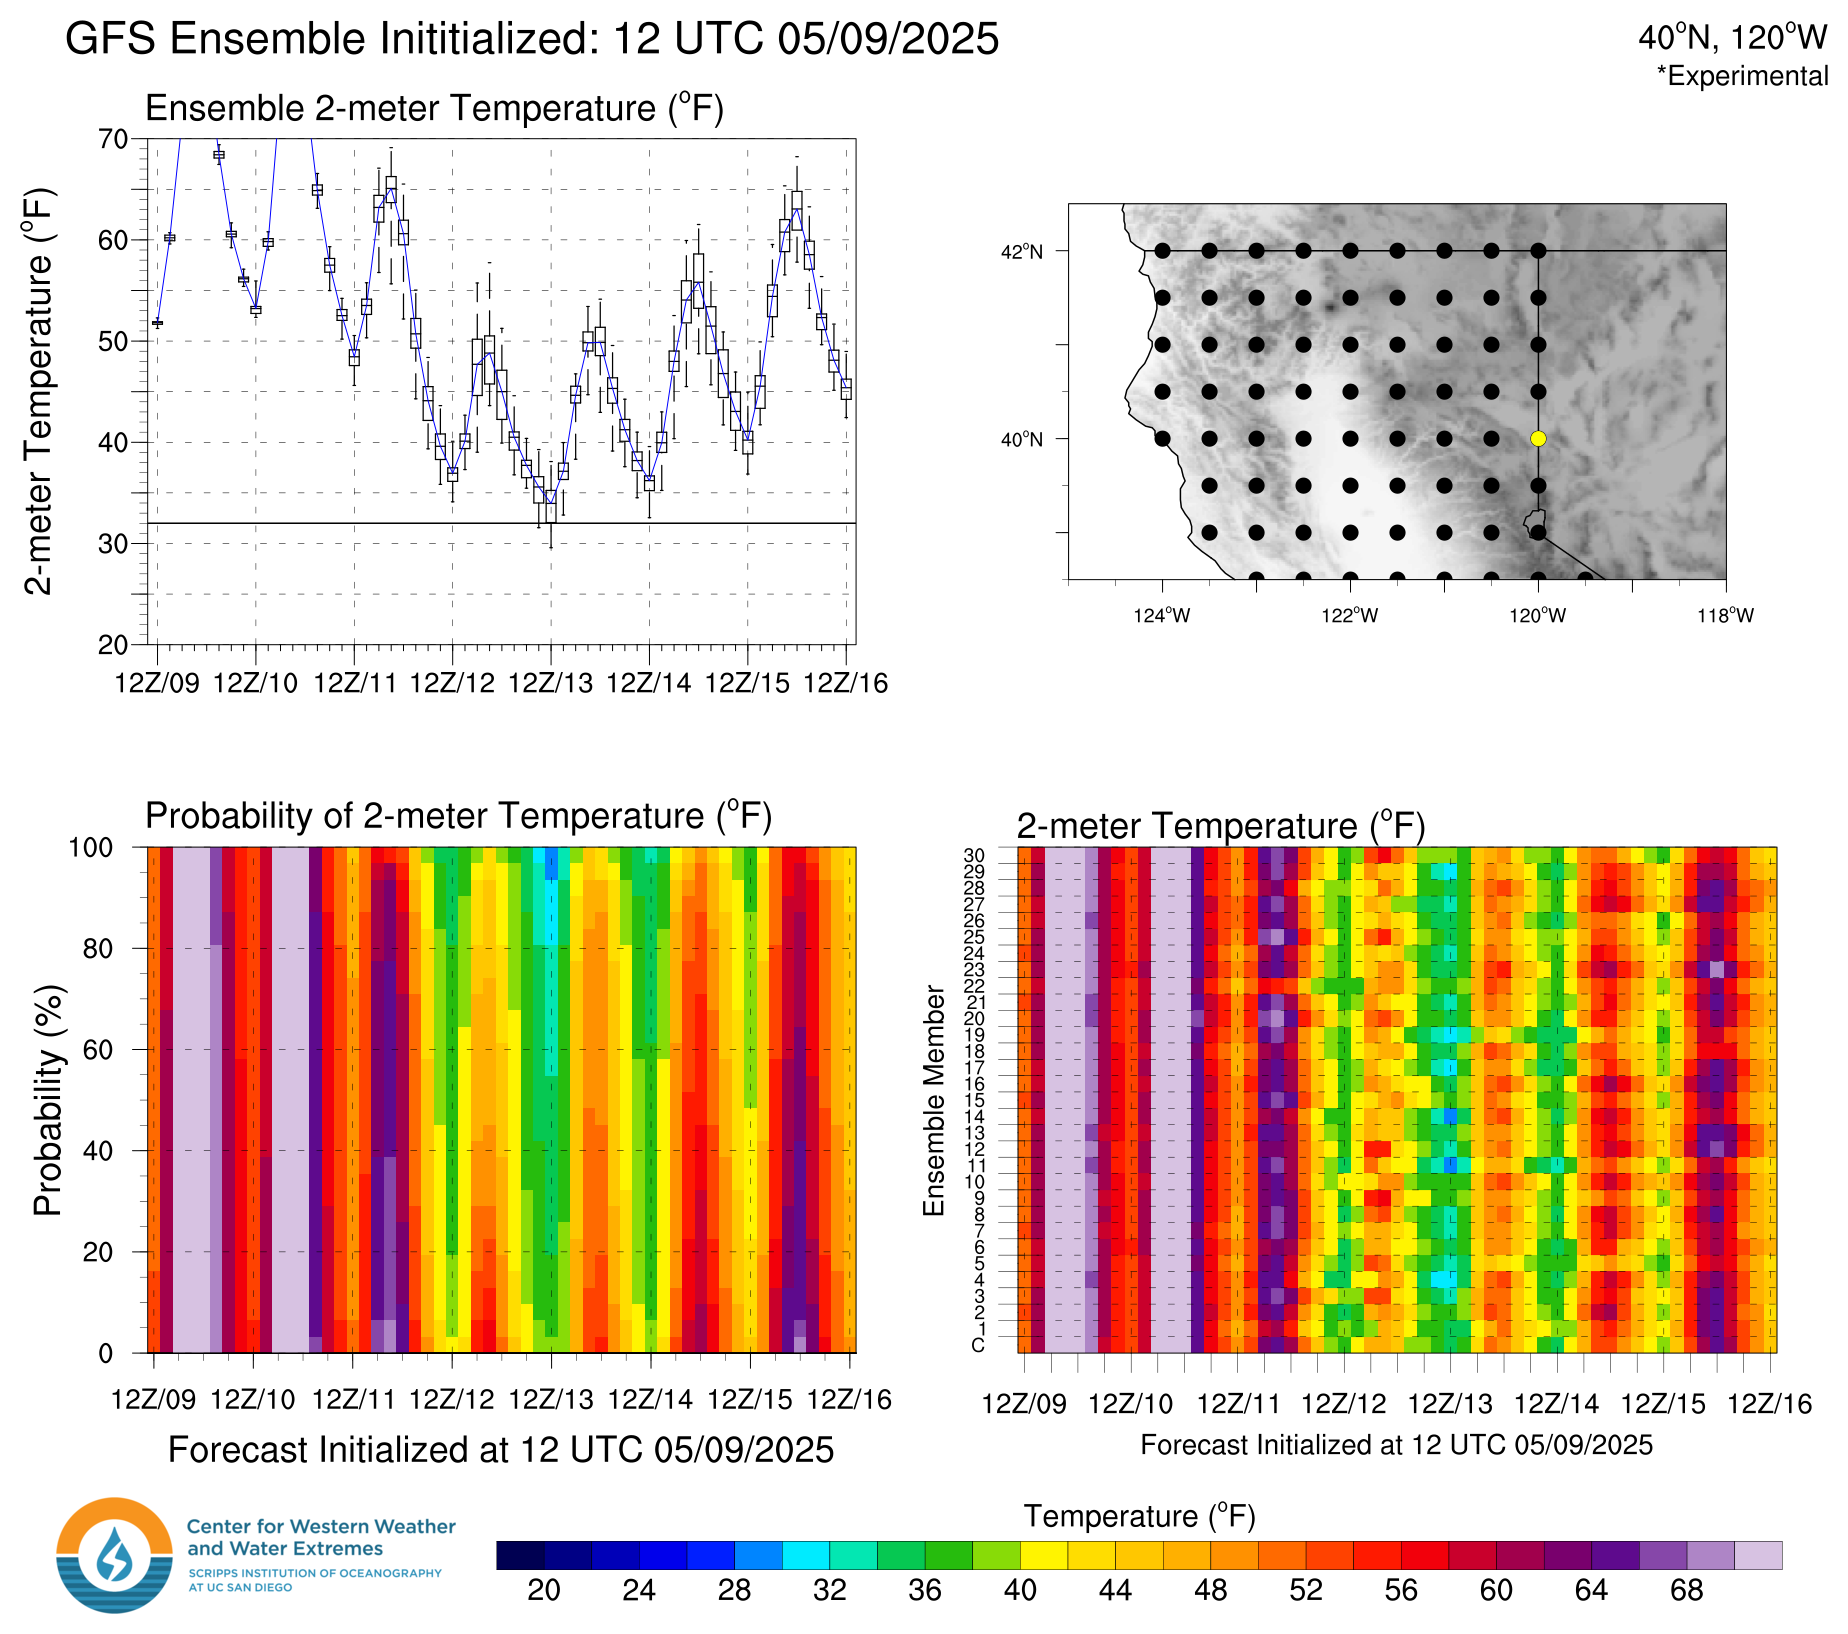
Top Left: Box plot of 3 hourly 2-meter temperature (°F) from the GFS or ECMWF ensemble. Bottom Left: Probability of 2-meter temperature exceeding various thresholds (threshold defined by colorbar on bottom) calculated by the number of ensemble members predicting temperature over each threshold at each forecast lead time. Bottom Right: Three hour 2-meter temperature from each ensemble member shaded according to scale. Gray shading represents missing data. All panels valid at chosen location shown by yellow dot in top right map.
For more information on this product click here to view an overview video.