
West-WRF Ensemble Forecast Tools
The West-WRF Ensemble is not currently running in real-time in an effort to improve the forecast skill through validation and verification. CW3E will resume real-time forecasting using the West-WRF Ensemble prior to the next cool season.
The products are provided “as is” and are intended for research purposes only (disclaimer). All products on this page are considered experimental.
Probability Maps
Shading and contours represent the probability of the chosen variable to be greater than the selected threshold during the chosen 24-hour period. Probability is calculated based on the number of ensemble members predicting the variable over the chosen threshold.

Shading and contours represent the probability of maximum wind to be greater than the selected threshold during the chosen 3-hour period. Probability is calculated based on the number of ensemble members predicting the variable over the chosen threshold.
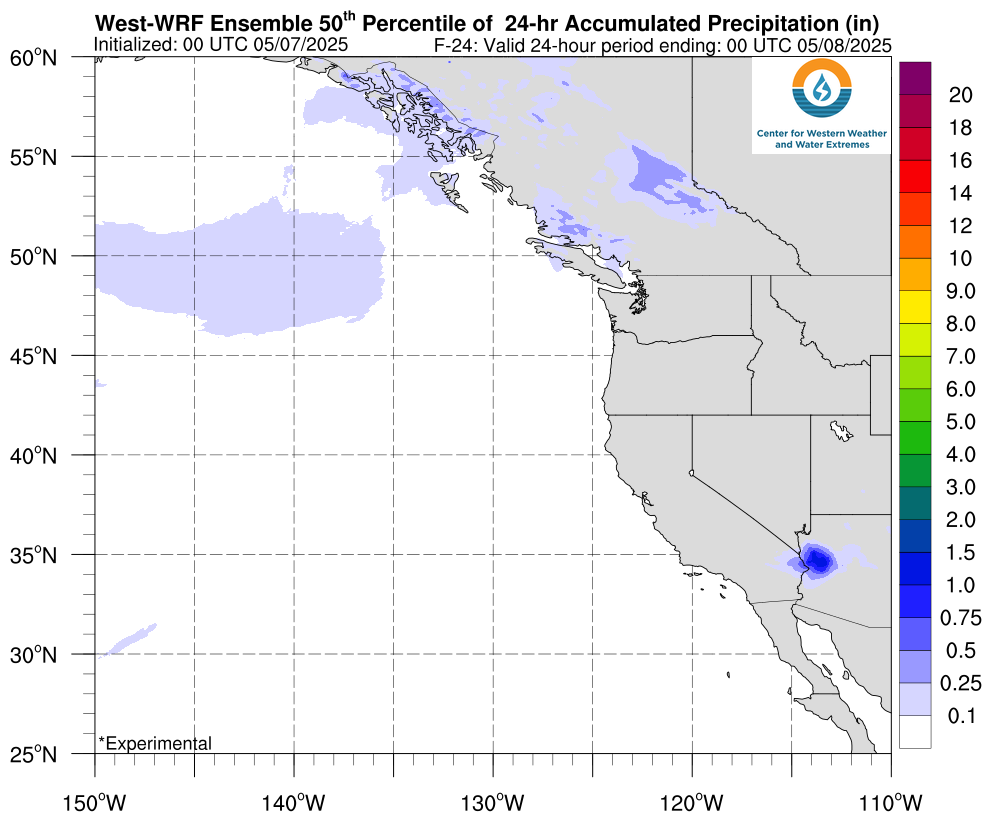
Percentile Maps
Shading and contours represent the 24-hour accumulated precipitation or snow, or the maximum/minimum relative humidity of the selected percentile from the West-WRF Ensemble forecast model.
QPF Meteograms
Top Left: Box plot of 3-hour accumulated precipitation from the West-WRF ensemble model. Bottom Left: Probability of 3-hour precipitation exceeding various thresholds (threshold defined by colorbar on bottom) calculated by the number of ensemble members predicting precipitation over each threshold at each forecast lead time. Right: Three hour accumulated precipitation from the each ensemble member shaded according to scale valid at the chosen location.
 |
 |