
Integrated Water Vapor Transport (IVT) and Relative Humidity GFS Meteograms
These meteograms illustrate the forecasted conditions over a given locations for the 3 or 7-day forecast period from the GFS. The top panel includes water vapor flux (kg m-2s-1) or relative humidity (%) shaded with the 0°C isotherm and wind barbs(m/s), gray shading indicates location elevation. The middle plot illustrates the 3-hour precipitation represented by the bars, total 72-hour precipitation, height of the 0oC isotherm, and location elevation. When the freezing level is below the location elevation, line and bars are blue representing the likelihood of snow and when the freezing level is above the location elevation line and bars are green representing the likelihood of rain. The bottom plot illustrates the IWV and IVT, as well as the presence of AR conditions shaded in gray. The yellow dot on the map indicates the location of the current plot. Click here to view U.S. West Coast domain
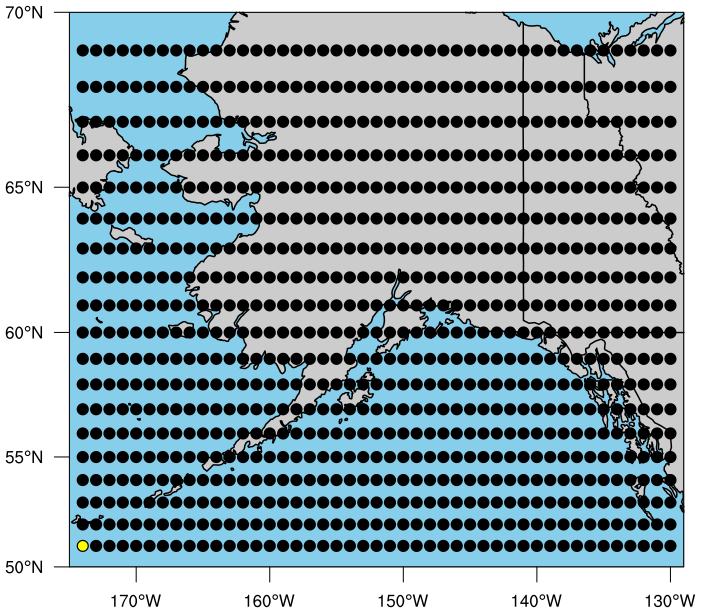
Select Type of Meteogram, Latitude and Longitude to generate plot. Click image to open in new tab.
 |
 |