
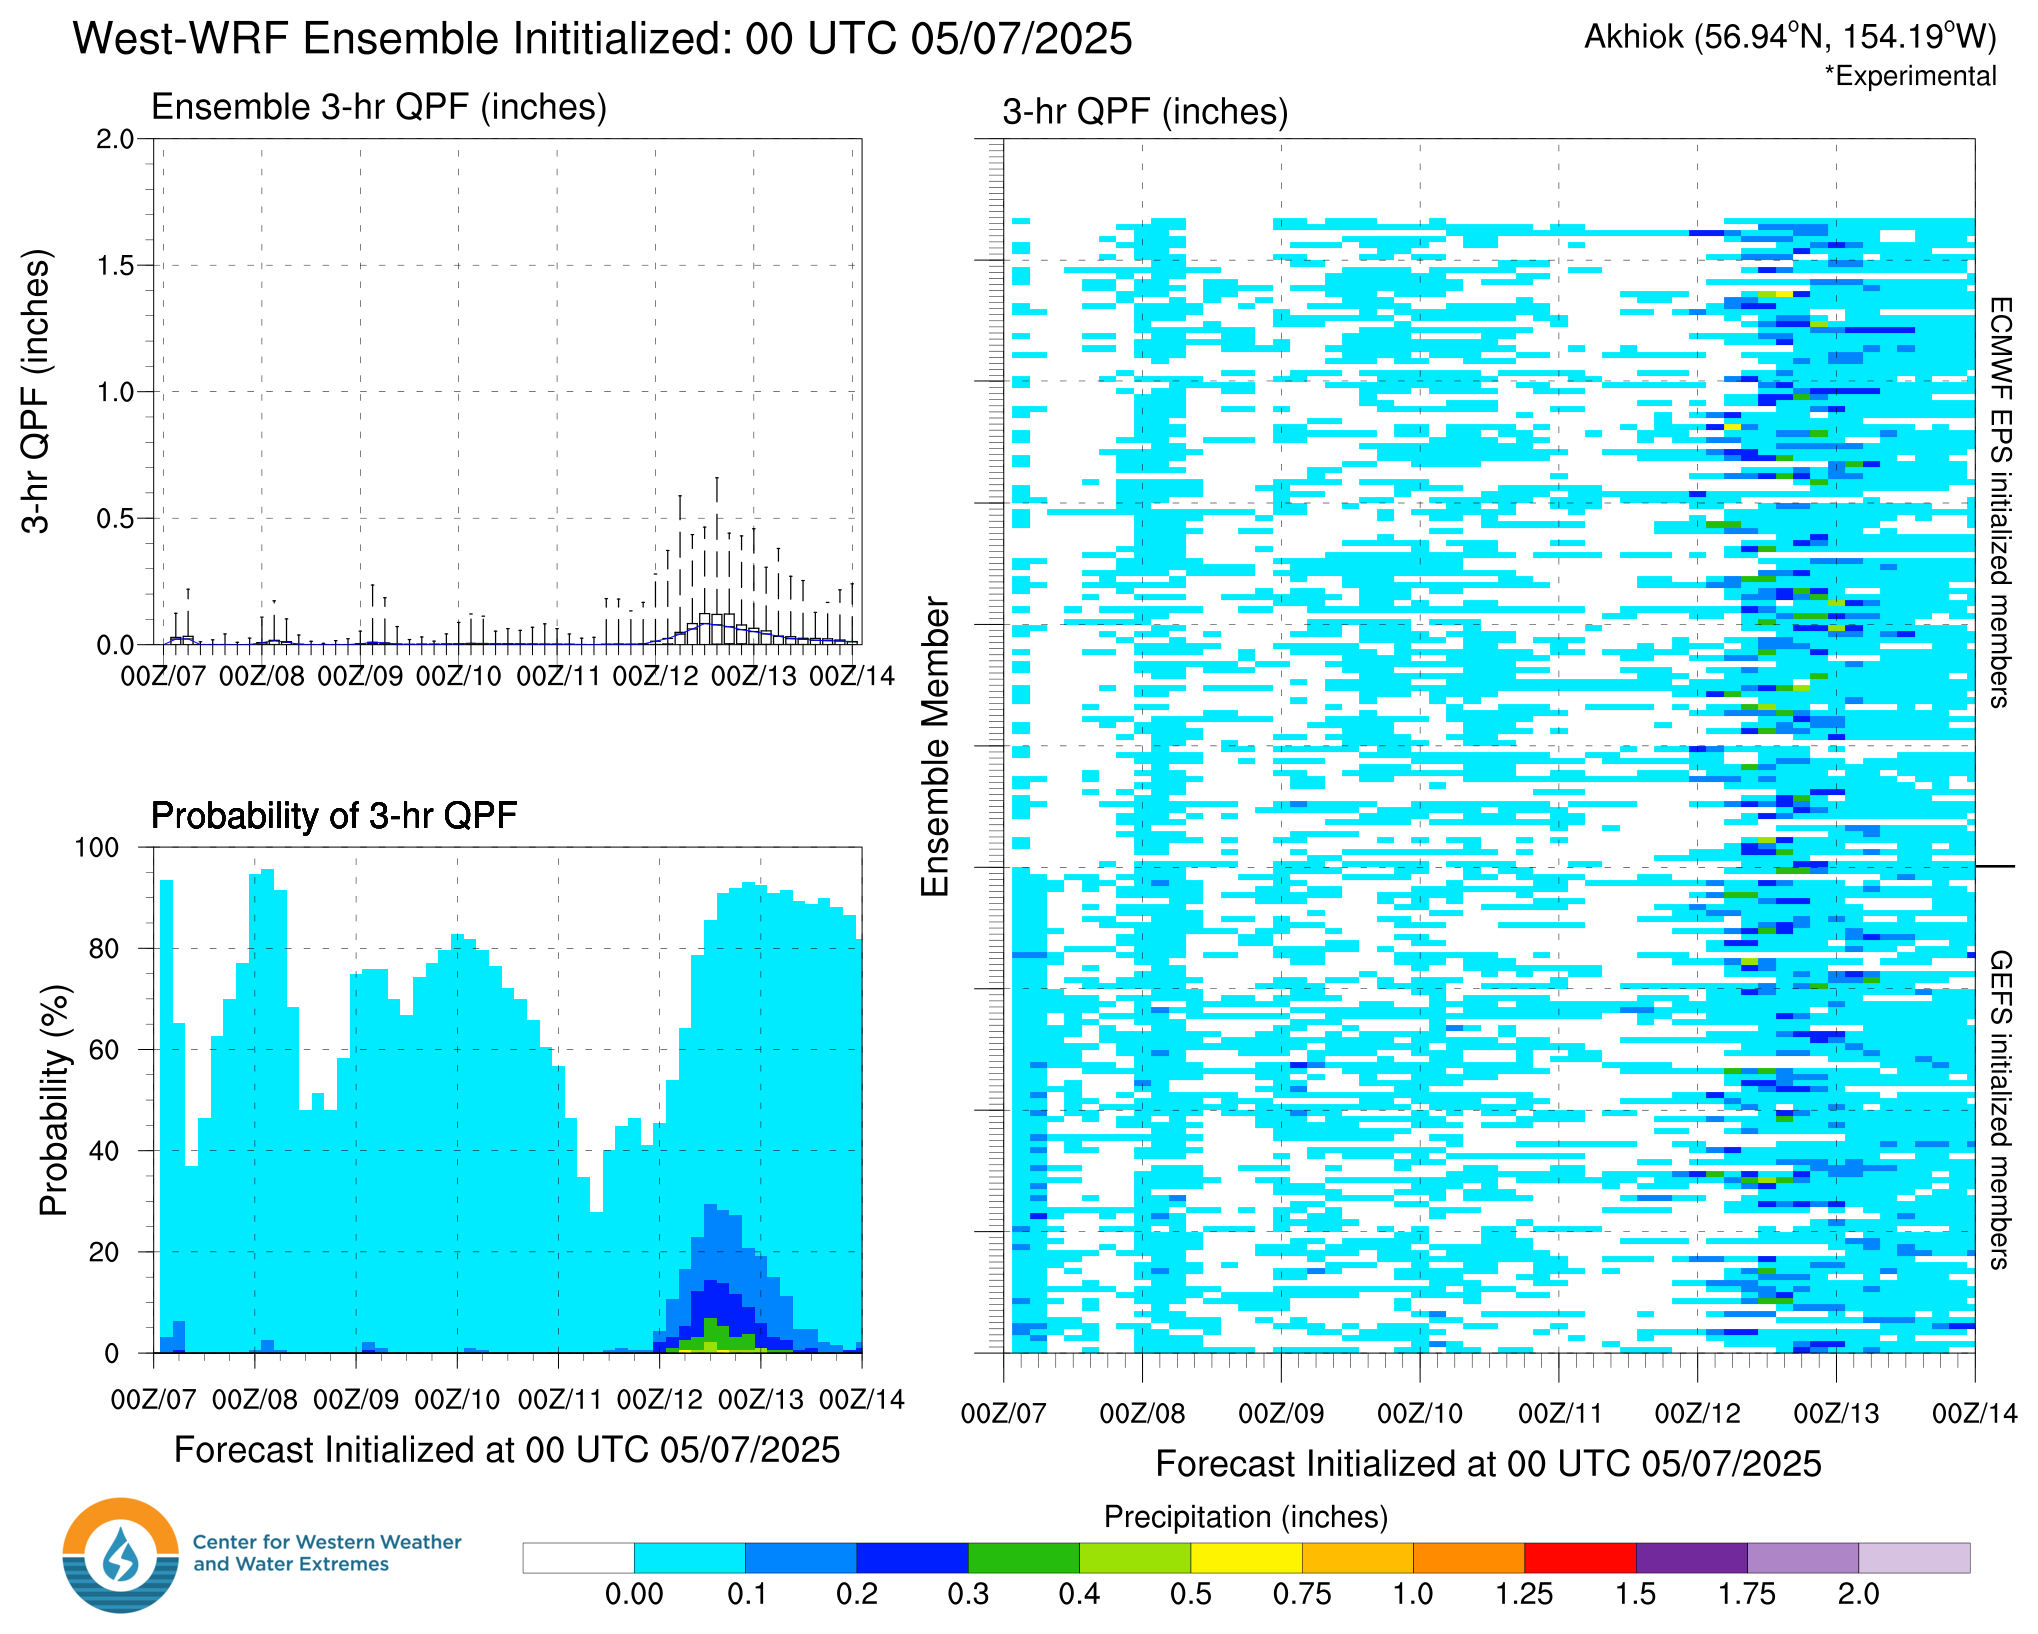
West-WRF Ensemble Meteograms
Top Left: Box plot of 3-hour accumulated precipitation from the West-WRF ensemble model. Bottom Left: Probability of 3-hour precipitation exceeding various thresholds (threshold defined by colorbar on bottom) calculated by the number of ensemble members predicting precipitation over each threshold at each forecast lead time. Right: Three hour accumulated precipitation from the each ensemble member shaded according to scale valid at the chosen location. Gray shading represents missing data.
 |
 |