|
Precipitation Percentiles: Monitoring drought in California and Nevada The link above provides graphics showing precipitation percentiles over the last 10 years or since 1900 as a function of timescale for California and Nevada climate divisions. |
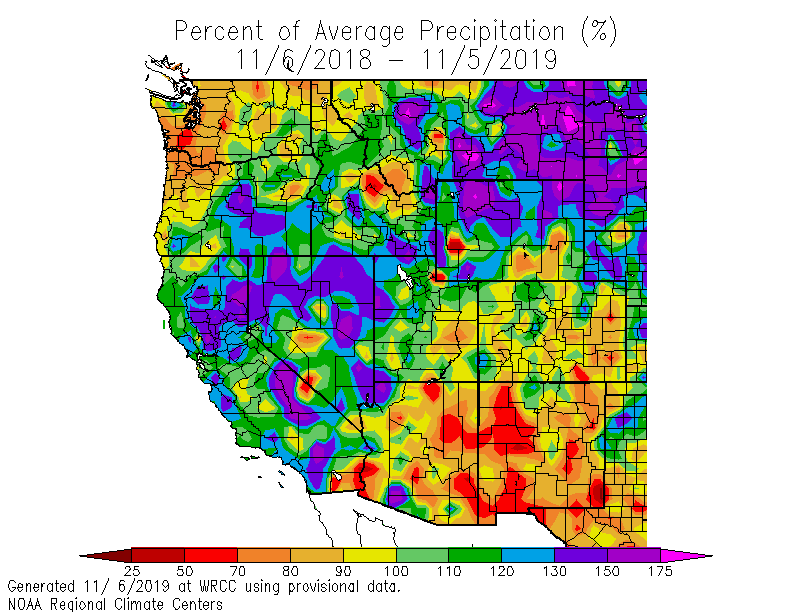
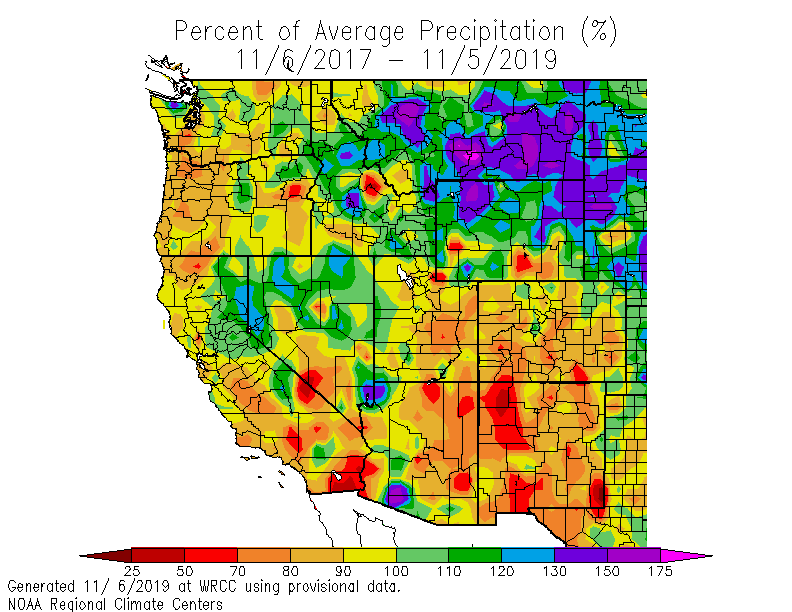
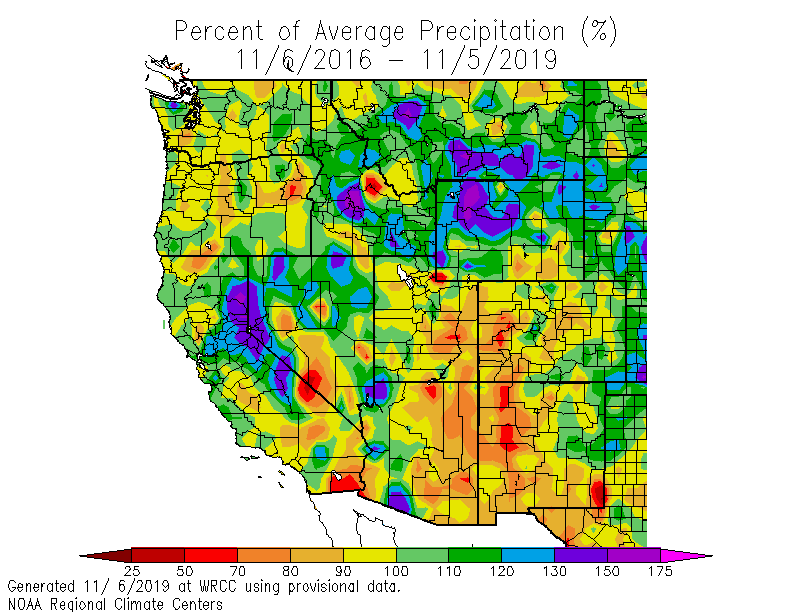
| Percent of Normal Precipitation (from Western Regional Climate Center> |
Last 12 Months
|
Last 24 Months
|
Last 36 Months
|
| Precipitation Deficits (from NOAA Climate Prediction Center) |
Sacramento
|
San Francisco
|
San Diego
|
| Precipitation Percentiles: Water Year to-date (from CW3E Researcher David Pierce) |
Western U.S.
|
Northern Cal
|
Southern Cal
|
| Cumulative Water-Year Precipitation (from CA Dept Water Resources) |
No. Sierra 8-stn Index |
So. Sierra 5-stn Index |
|
| California Snow Water Content relative to April 1 Average(from CA Dept Water Resources) |
Comparison to Historical Years |
Statewide summary |
|
| (Updated Mar 21, 2014) Likelihood of California Drought ending by Oct 2014 (from CW3E Researcher, Mike Dettinger) |

|
Climate Division 1 Climate Division 2 Climate Division 3 Climate Division 4 |
Climate Division 5 Climate Division 6 Climate Division 7 Climate Division Map |
