
Integrated Water Vapor Transport (IVT) and Integrated Water Vapor (IWV) Analyses and Forecasts
Geographic Region: | North Pacific | Northeast Pacific | U.S. West Coast | North America | North Atlantic |
Plot Description: Vertically Integrated Water Vapor Transport (IVT) with magnitude shaded in units of kg m-1 s-1, direction indicated by vectors and 700-hPa height contoured in gpm. Integrated water vapor (IWV) with magnitude shaded in units of mm, 700-hPa wind vectors, and 700-hPa height contoured in gpm from the Global Forecast System (GFS) and the European Centre for Medium-Range Weather Forecasts (ECMWF). Difference plots show the forecasted difference of IVT or IWV between the GFS and ECMWF (colors) and GFS IVT or IWV (contours). Positive values (green-blue) indicate that the ECMWF is higher than the GFS and negative values (yellow-red) indicate the GFS is higher than the ECMWF. The products are provided “as is” and are intended for research purposes only (disclaimer).
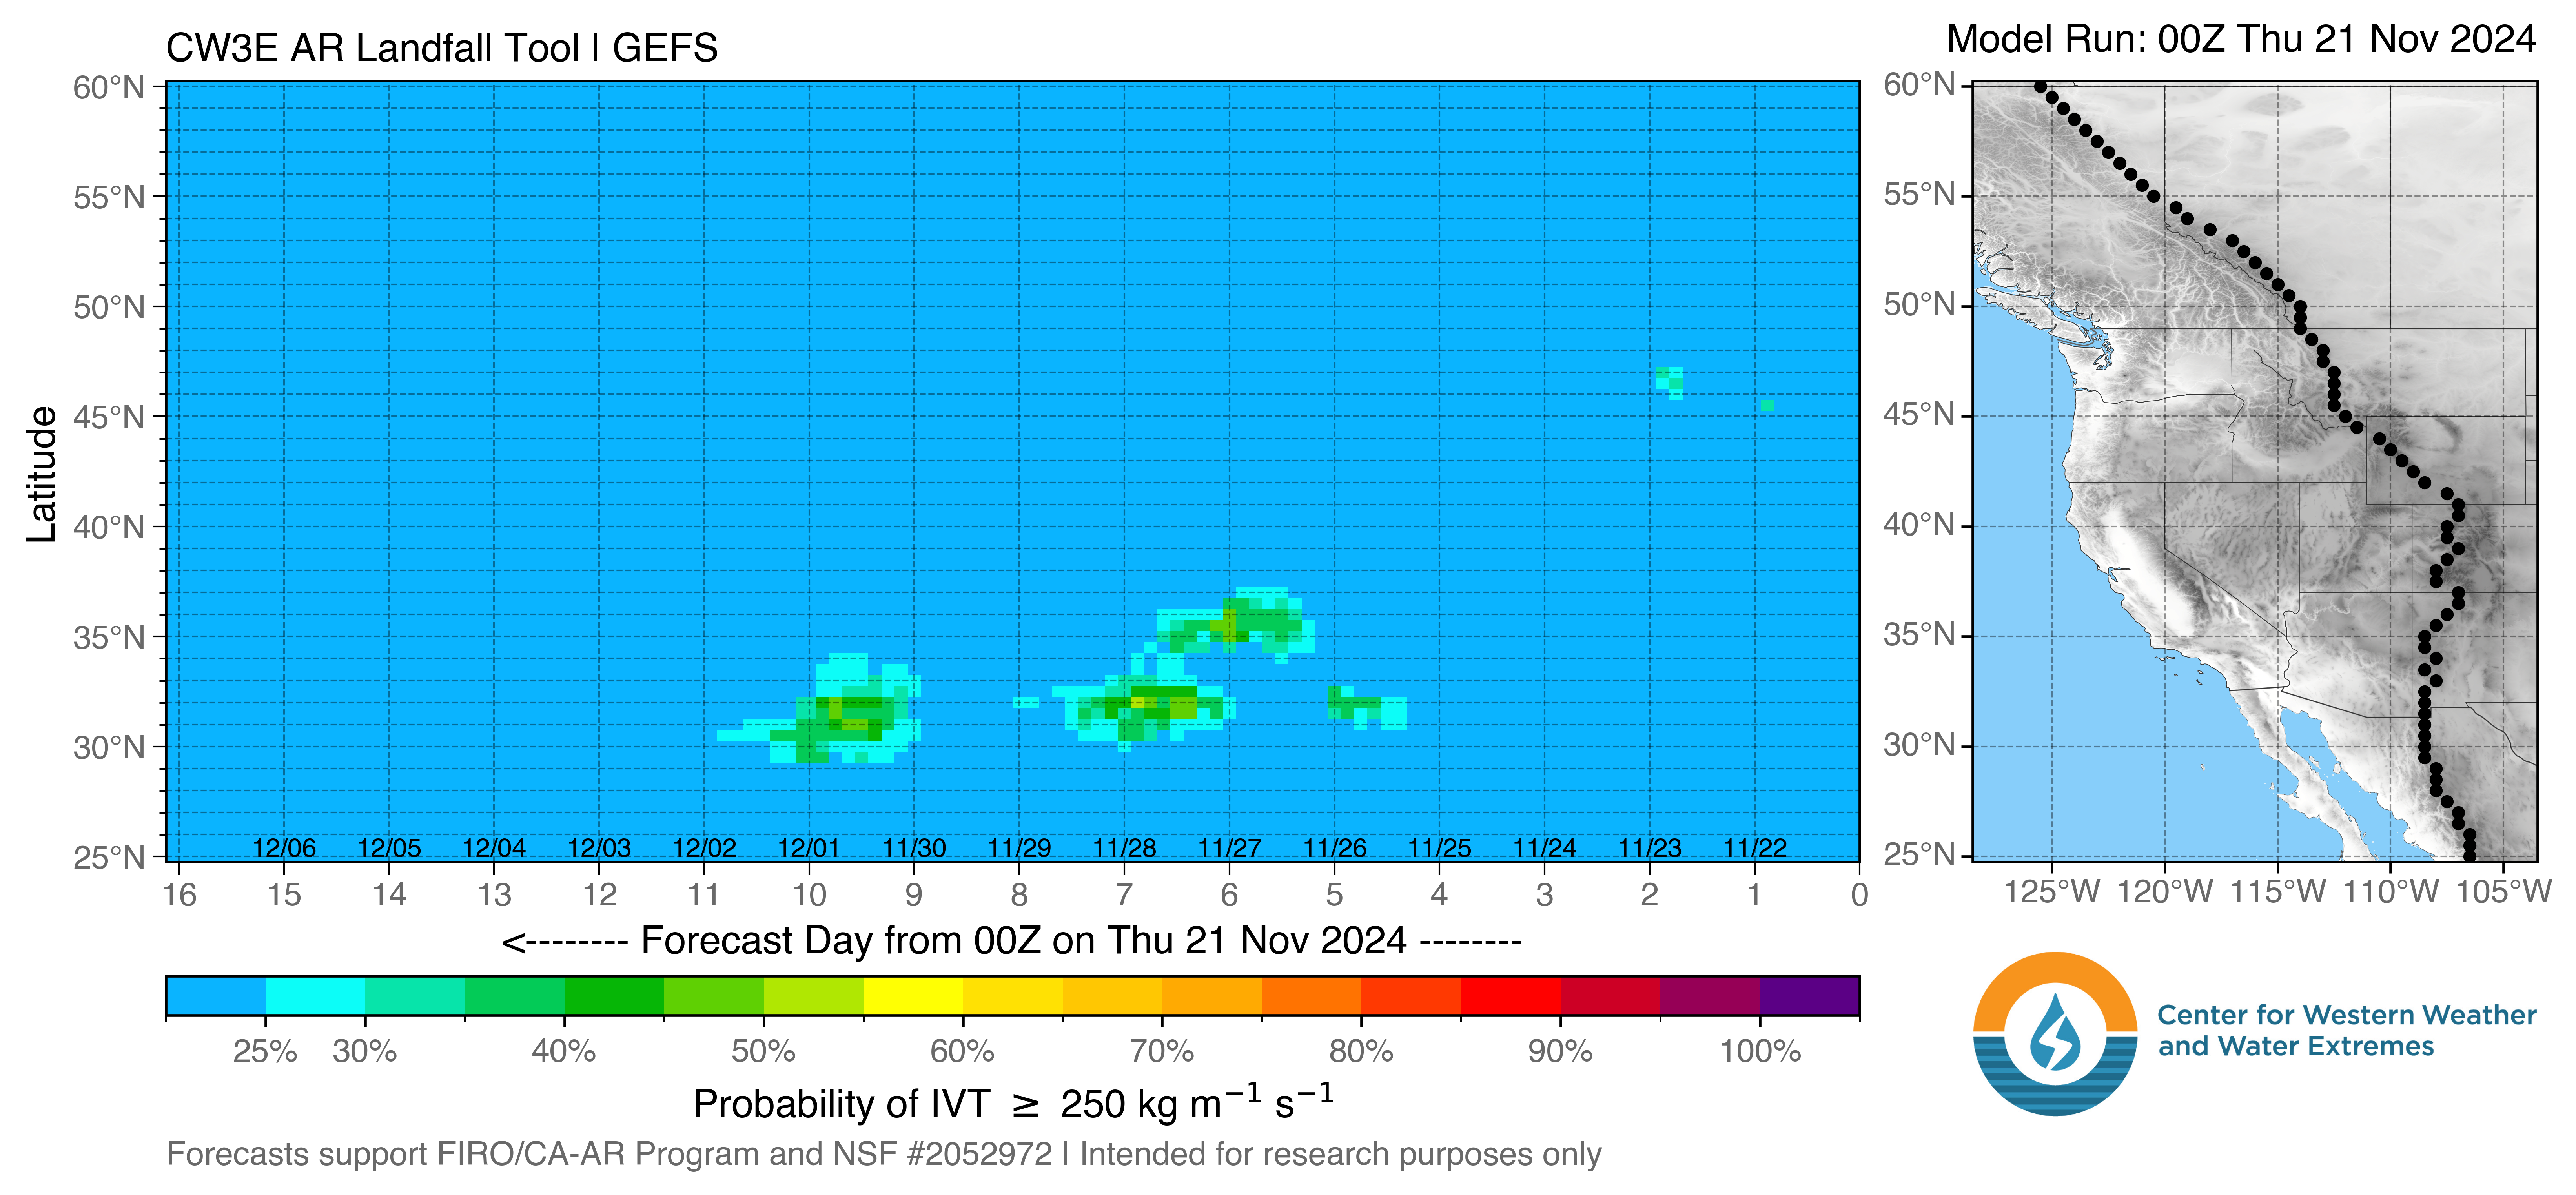
CW3E AR Landfall Tool
The probability CW3E AR Landfall Tool displays the likelihood and timing of AR conditions at each point on the map in a line through the interior western United States derived from the NCEP GEFS model over the next 16 days. The probability of AR conditions represents the number of ensemble members that predict IVT to be greater than the chosen threshold at the given location and time. To see how each forecast type has changed over the previous seven days click on dProp/dT.
|
dProg/dT |
IVT Ensemble Probability Plots
Plot descriptions: Left: Probability of IVT exceeding 250 kg m-1 s-1 based on the 30 members of the Global Ensemble Forecast System (GEFS) and ensemble mean IVT vectors. Right: GEFS ensemble member 250 kg m-1 s-1 contours (thin lines) and ensemble mean (thick blue line).
Select model, forecast hour, threshold, and domain to generate plot. Click image to open in new tab.
 |
 |
Note initialization times may differ between GEFS and ECMWF EPS.
IVT Thumbnail Ensemble Plots
The below images display the 30 members of the NCEP Global Ensemble Forecast System (GEFS); each thumbnail shows IVT (kg m-1 s-1) magnitude shaded according to scale and IVT vectors.
Select model, forecast hour and domain to generate plot. Click image to open in new tab.

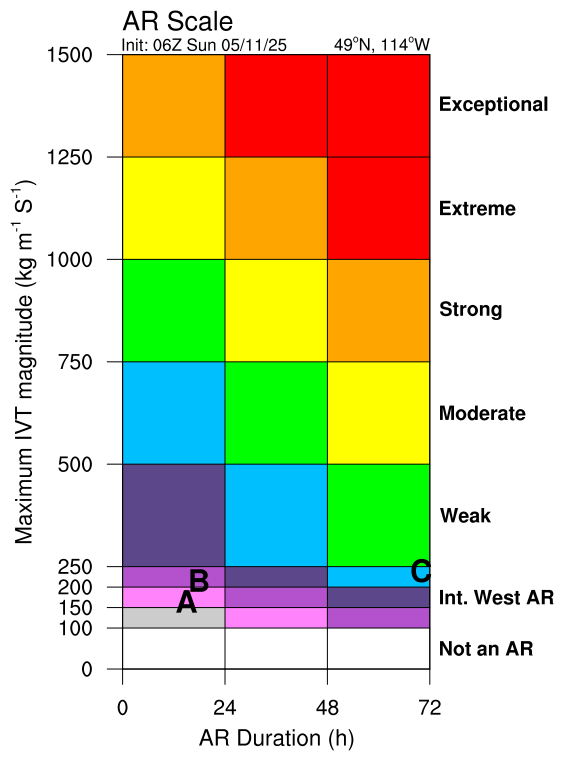
AR Scale Forecast Products
The AR scale was initially designed based on the duration of AR conditions (IVT >250 kg m-1 s-1) and maximum IVT during the AR as described in Ralph et al. 2019. To account for lower water vapor transport over the mountainous regions of the interior western U.S., three categories have been added to the lower end of the original AR scale. For a description of the original AR Scale click here.
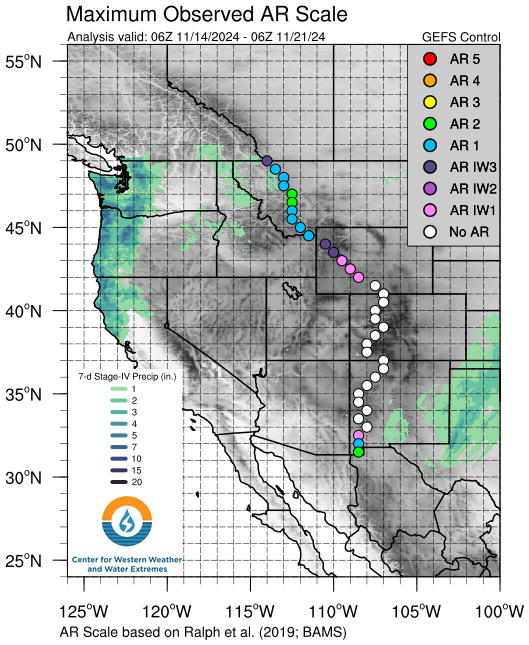
Coastal Maximum AR Scale and Precipitation Maps
The dots on the maps below represent the AR scale observed and forecast at each grid point. GEFS plots update about every six hours and ECMWF plots update about every 12 hours.
For more information on this product click here to view an overview video.
|
Show Precipitation: |
Model: |
|
|
Past 7 days (observed) |
Future 7 days (forecast): |
|
 |

|

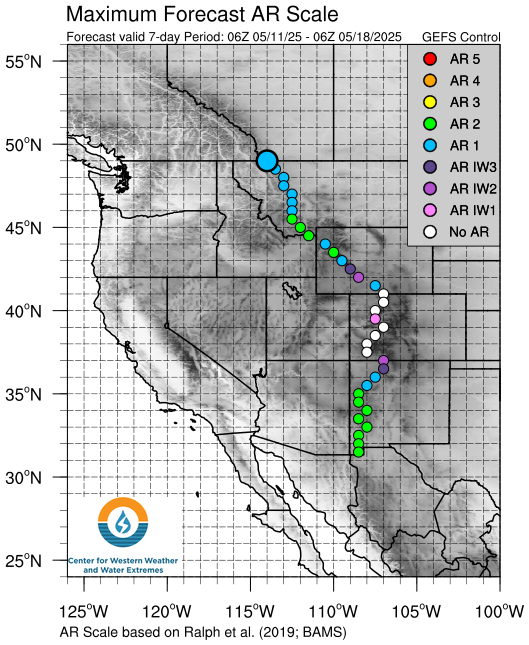
The map on the left shows the AR scale forecasted over the next 7 days from the ensemble mean or control forecast at each dotted location. The largest dot represents the chosen location for the middle and right plots.
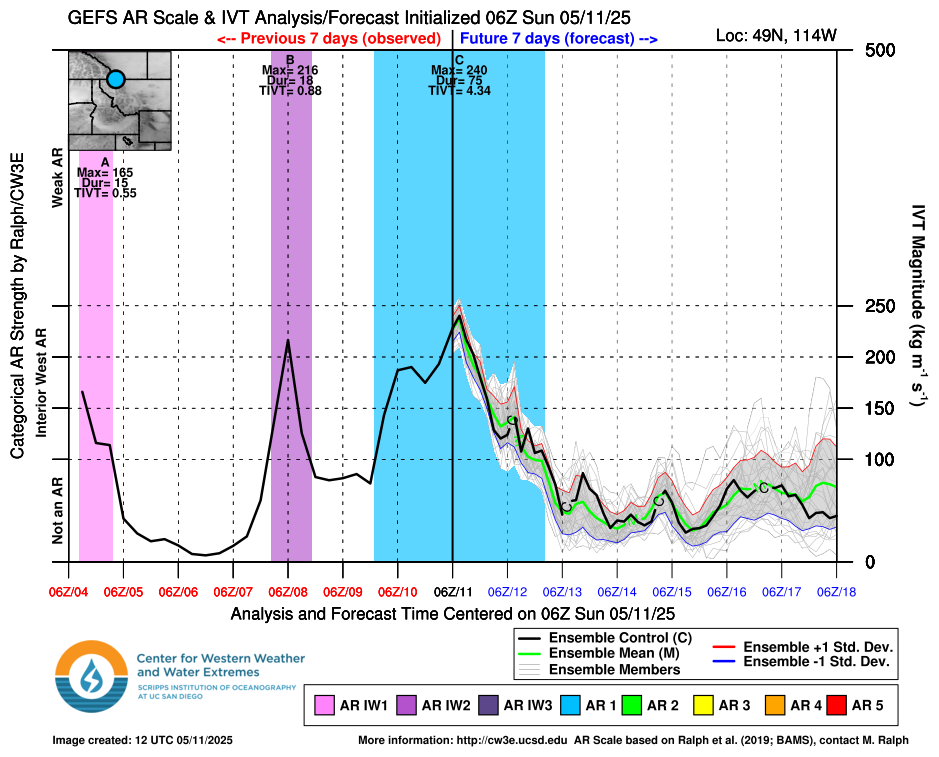
The plot on the right shows where each identified AR falls on the AR Scale matrix and how the AR scale is calculated, identified by letters at the top of each AR in the center diagram. Time periods where IVT >100 kg m-1 s-1 but the duration is less than 24 hours will be represented by gray shading in the center diagram and ◯’s for time periods in the analysis (ie observed) period and X’s for time periods in the forecast on the right plot.
The plume diagram (center) represents the integrated water vapor transport (IVT) and AR scale analysis (ie observed) and forecast.
- The left side of each plot (red date labels) represents the observed (i.e. the 0-hour analysis of the control forecast) for the previous 7 days.
- The right side of each plot (blue date labels) represents each of the individual ensemble models (thin gray lines), the unperturbed GFS or ECMWF control forecast (black line), the ensemble mean (green line), and plus or minus one standard deviation from the ensemble mean (red line (+), blue line (-), and gray shading).
- Colored shading represents the AR scale observed or forecast for the given time, shaded according to scale, calculated using the control forecast or ensemble mean.
- At the top of the diagram each identified AR is given a letter representation (used on the right plot) and the maximum IVT during the AR (kg m-1 s-1), the AR duration (hours), and time integrated IVT (107 kg m-1) during the AR are shown.
- Note that if an AR is currently being observed at the given location (AR shading over the center line), the AR Scale is calculated using a combination of analysis and forecast data.
For more information on this product click here to view an overview video.
 |
 |
 |
Top left: The plume diagram represents the integrated water vapor transport (IVT) forecast for each of the individual ensemble models (thin gray lines), the unperturbed GFS or ECMWF control forecast (black line), the ensemble mean (green line), and plus or minus one standard deviation from the ensemble mean (red line (+), blue line (-), and gray shading). Colored shading represents the AR scale forecast for the given time, shaded according to scale, calculated using the model control forecast. Bottom left: Shading represents the probability of AR Scale conditions at the given location calculated by the number of ensemble members predicting a given AR Scale at each forecast lead time. Top right: Dots on the map represent the maximum AR Scale forecast from the GFS or ECMWF control member at that grid point for the next seven days. Colored shading represents the GFS or ECMWF 7-day accumulated precipitation forecast. The enlarged dot indicates the location the other plots in this diagram are representative of. Bottom right: AR Scale magnitude and timing calculated for each GEFS or ECMWF EPS ensemble members shaded according to scale. Values in shading represent the magnitude and timing of maximum IVT during each forecasted AR. Gray shading in each panel represents IVT >100 (kg m-1s-1) for a duration less than 24 hours.
For more information on this product click here to view an overview video.

GFS model data provided courtesy of NOAA/NCEP.