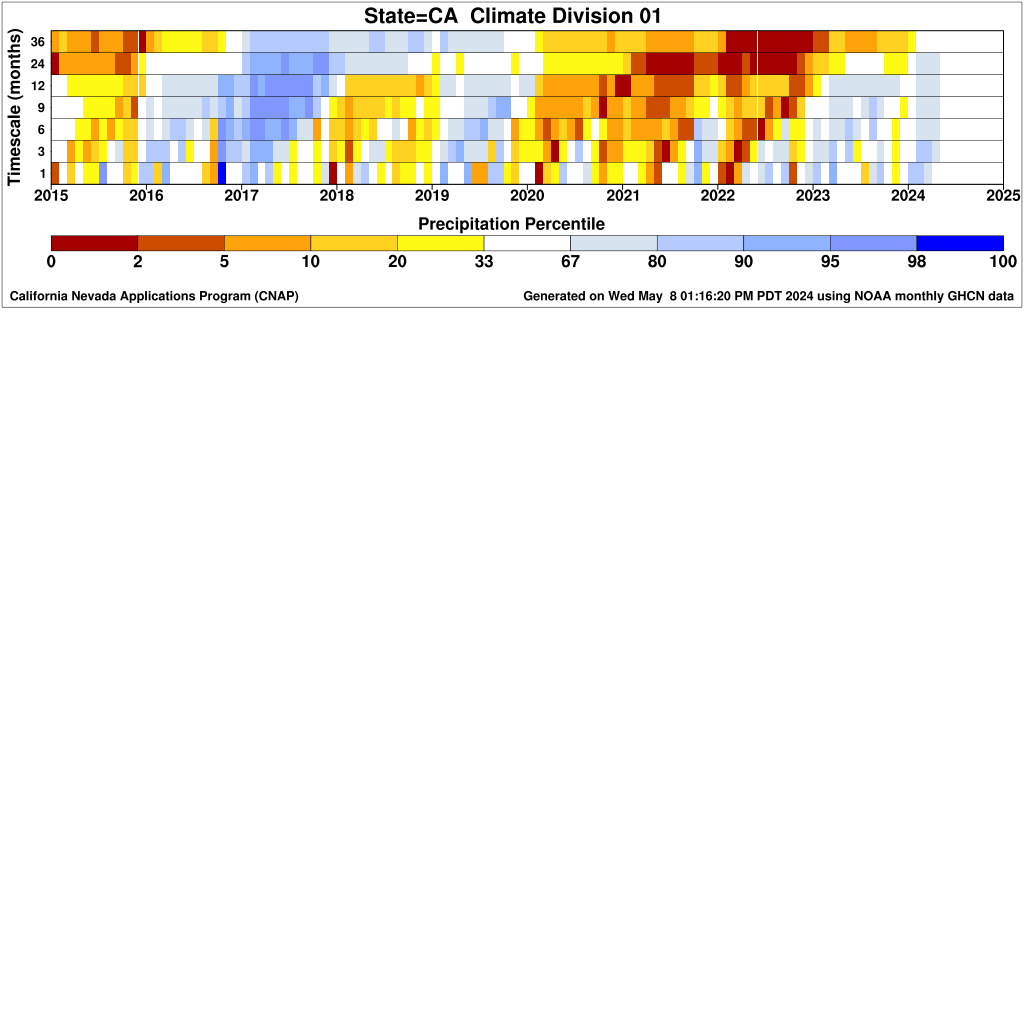
California Precipitation Percentiles

The figures featured below show the time series of precipitation percentiles as a function of timescale (vertical axis), where the timescale indicates the length of the averaging period. For instance, a timescale of 6 months is the average precipitation over the 6-month period ending (and including) the month noted on the horizontal axis. The dark red/orange colors denote periods of very low precipitation while the darker blue colors indicate periods of relatively wet conditions. The percentiles were calculated using NOAA NCDC climate division precipitation data extending from 1895 to present. A more in depth description can be found in Steinemann et al. (2015). This work received support through the California-Nevada Applications Program (CNAP) and from the National Integrated Drought Information System (NIDIS).

By default this page will load the figure for climate division 1. Click on the links below to view figures for other climate divisions (see map on the upper-right). Clicking on “Last 10 years” will display the figure for that particular climate division in the space above. Clicking on “1900-Present” will open the figure in a new window.
California
| California Division 1: | Last 10 years | 1900-Present |
| California Division 2: | Last 10 years | 1900-Present |
| California Division 3: | Last 10 years | 1900-Present |
| California Division 4: | Last 10 years | 1900-Present |
| California Division 5: | Last 10 years | 1900-Present |
| California Division 6: | Last 10 years | 1900-Present |
| California Division 7: | Last 10 years | 1900-Present |
| California (Entire State): | Last 10 years | 1900-Present |
