
US Climate Division Precipitation Percentiles
The figure below shows the time series of precipitation percentiles over the last 10 years as a function of timescale (vertical axis) using California climate division 2 as an example. The timescale indicates the length of the averaging period. For instance, a timescale of 6 months is the average precipitation over the 6-month period ending (and including) the month noted on the horizontal axis. The dark red/orange colors denote periods of very low precipitation while the darker blue colors indicate periods of relatively wet conditions. The percentiles were calculated using NOAA NCDC climate division precipitation data extending from 1895 to present. A more in depth description can be found in Steinemann et al. (2015). This work received support through the California-Nevada Applications Program (CNAP) and from the National Integrated Drought Information System (NIDIS).
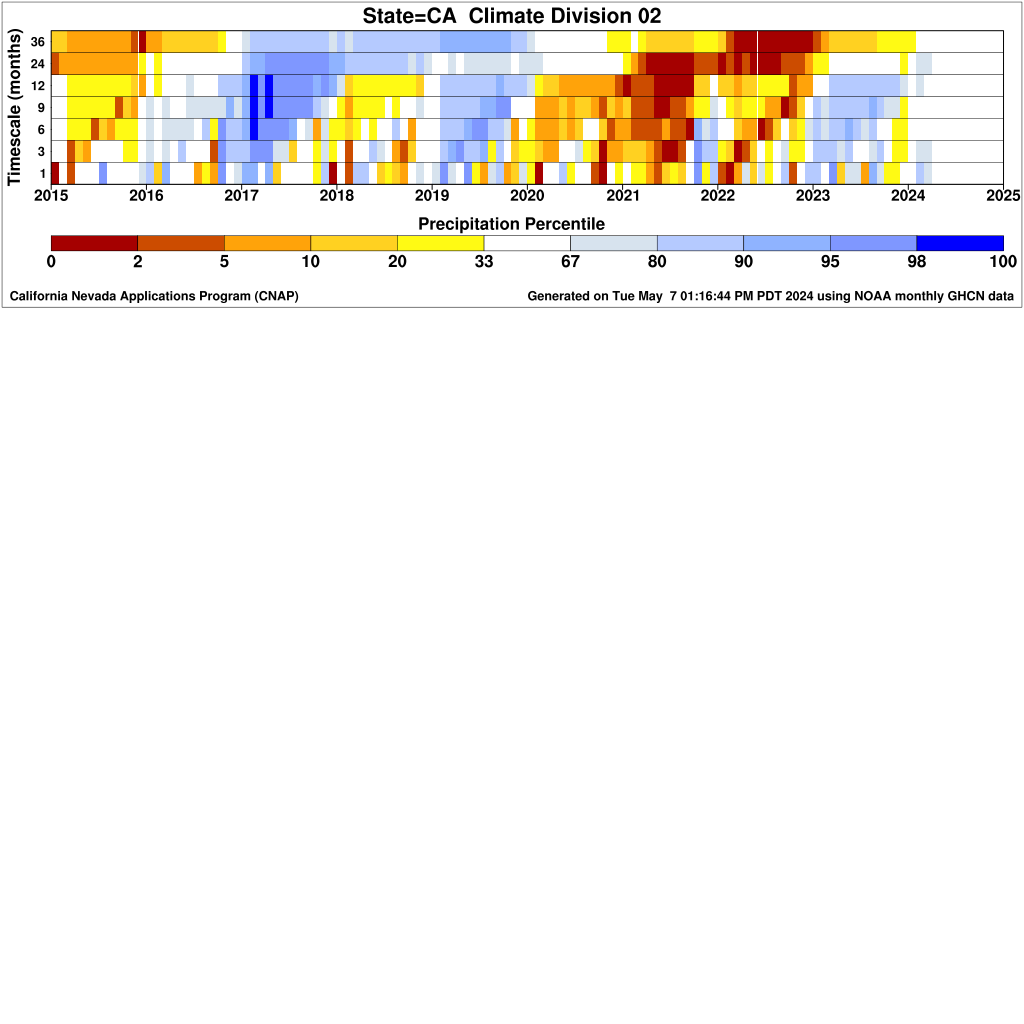
As an example, in California climate division 2, precipitation during the 6-month period ending with April 2014 (Nov 2013 to Apr 2014) was at the percentile level of 11.3%. This signifies that over the 120+ year history (1895 up to early-2016 as of this writing), 88.7% of the Nov-Apr periods were wetter and 11.3% were drier than the Nov 2013 – Apr 2014 period.
Click on the links below to view figures for climate divisions in a particular state (lower 48 only).
| AL | AZ | AR | CA | CO | CN | DE | FL | GA | ID |
| IL | IN | IO | KA | KY | LA | MA | MD | ME | MN |
| MI | MO | MI | MT | NC | ND | NE | NH | NJ | NM |
| NY | NV | OH | OK | OR | PA | RI | SC | SD | TE |
| TX | UT | VA | VT | WA | WV | WI | WY |