
West-WRF Ensemble Forecast Tools
The products are provided “as is” and are intended for research purposes only (disclaimer). All products on this page are considered experimental.
CW3E AR Landfall Tool
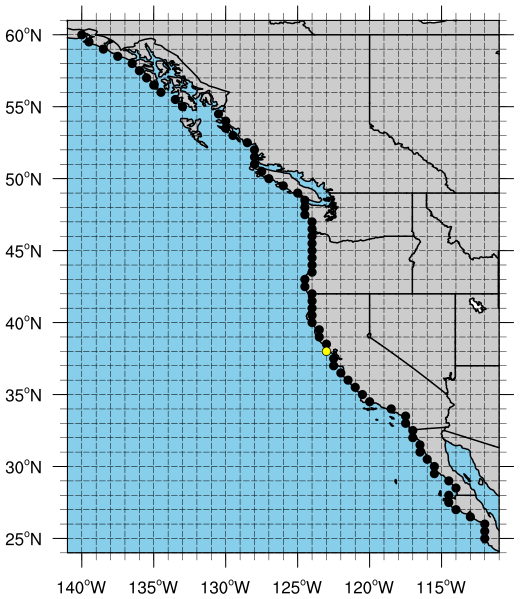
The probability CW3E AR Landfall Tool displays the likelihood and timing of AR conditions at each point on the map in a line along the U.S. West Coast or inland derived from the experimental West-WRF Ensemble Forecast System. The probability of AR conditions represents the number of ensemble members that predict IVT to be greater than the chosen threshold at the given location and time.
Select variable or threshold to be displayed and location to generate plot, click image to open in a new tab.

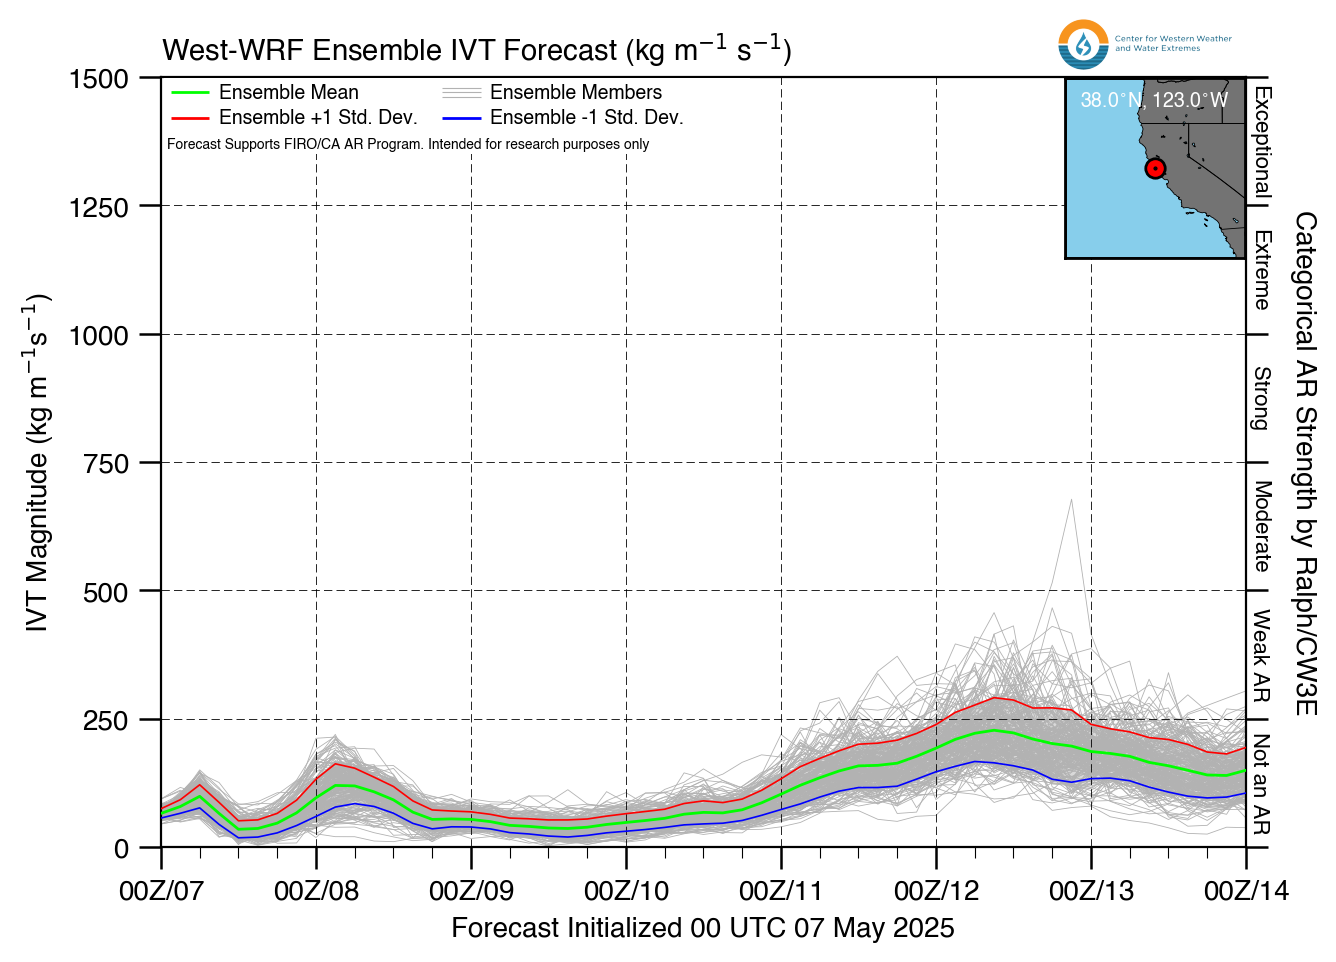
West Coast IVT Magnitude Plume Diagrams
The IVT magnitude plume diagrams represent the integrated water vapor transport (IVT) magnitude forecast from the experimental West-WRF Ensemble Forecast System. The images illustrate the 200 West-WRF ensemble members (thin gray lines), the ensemble mean (green line), and plus or minus one standard deviation from the ensemble mean (red line (+), blue line (-), and gray shading). The dot on the map indicates the location of the current plot.
Select model and location to generate plot. Click image to open in new tab.
 |
 |
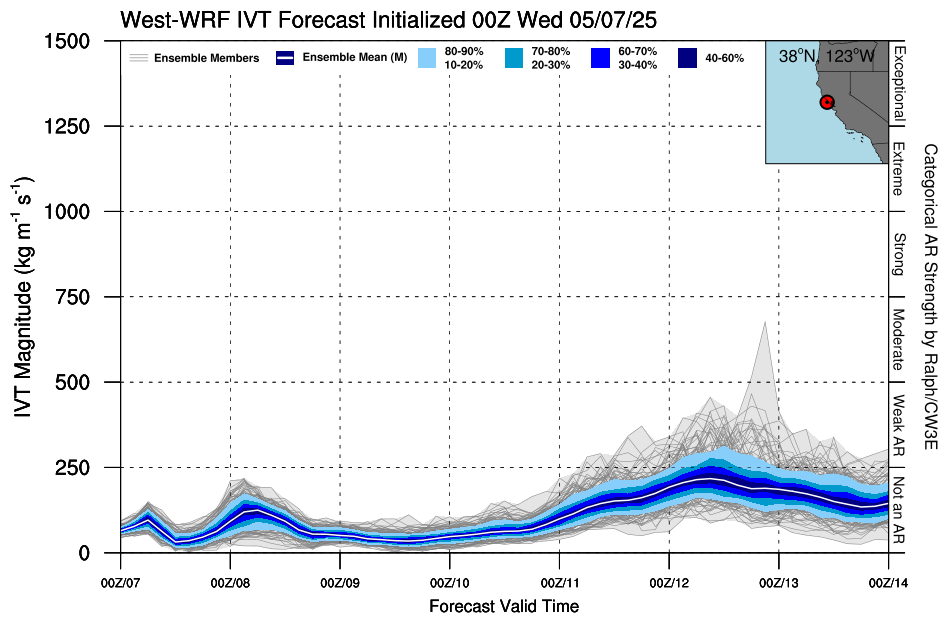
West Coast IVT Magnitude Percentile Plume Diagrams
The IVT magnitude percentile plume diagrams represent percentiles of the integrated water vapor transport (IVT) magnitude forecast from the experimental West-WRF Ensemble Forecast System. At each lead time, IVT magnitude from each of the 200 ensemble members within the West-WRF Ensemble Forecast System are binned based on percentiles. Color shading represents the IVT magnitude percentile, shaded every 10%, for example, the gray shading represents the most extreme (high and low) 10% of IVT magnitude and the darkest blue represents the middle 20% (40-60%) of IVT magnitudes. Individual ensemble members are shown when they fall in the top and bottom 10% (thin gray lines). The ensemble mean is shown by the white line.
Select transect and location to generate plot. Click image to open in new tab.
 |
 |
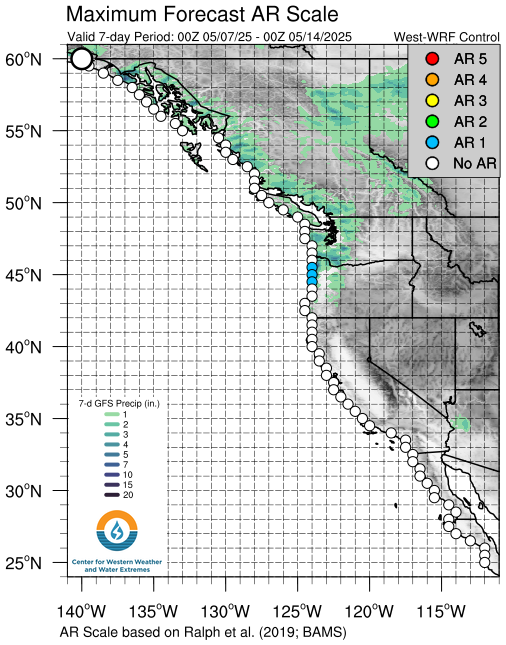
Coastal Maximum AR Scale and Quantitative Precipitation Maps
The dots on the maps below represent the AR scale forecast from the experimental West-WRF Ensemble Forecast System at each grid point over the next seven days. The left map represents the AR scale forecasted using the GFS initialized West-WRF deterministic model and the right map represents the AR scale forecasted using the West-WRF ensemble mean. Color shading represents the 7-day quantitative precipitation estimate from the West-WRF. The AR scale is determined based on the duration of AR conditions and maximum IVT during the AR as described in Ralph et al. 2019 . Use the menus to select coastal or inland locations and to turn precipitation fields on and off.
|
Show Precipitation: |
Locations: |
|
West-WRF GFS Deterministic |
Ensemble Mean |
|
 |

|
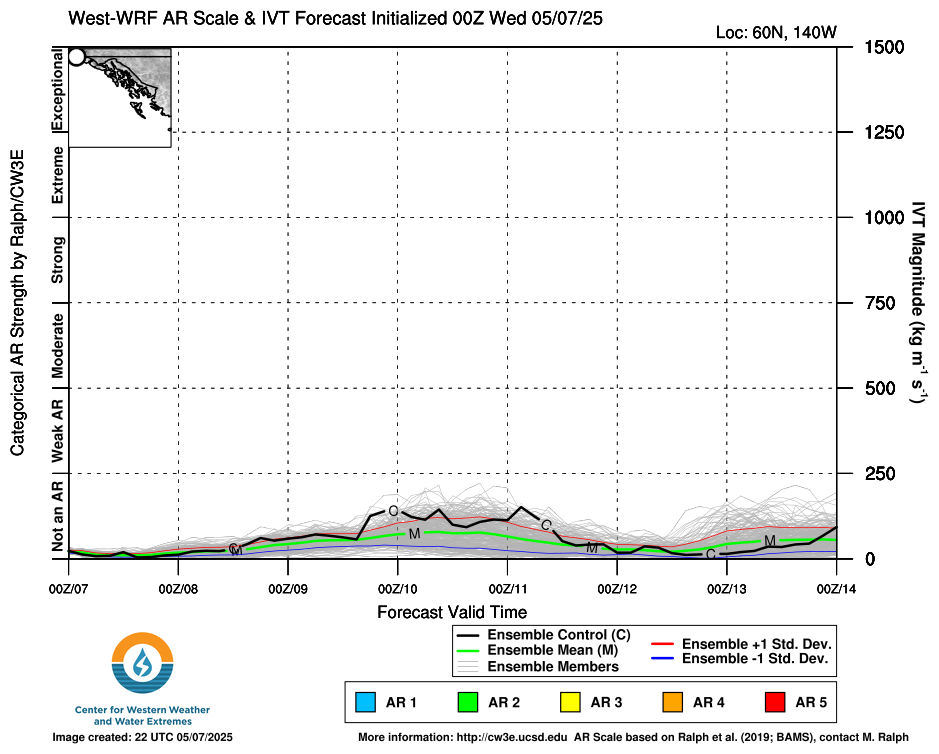
AR Scale Plume Diagrams
The map on the left shows the AR scale forecasted over the next 7 days from the ensemble mean or control forecast at each dotted location. The largest dot represents the chosen location for the middle and right plots.
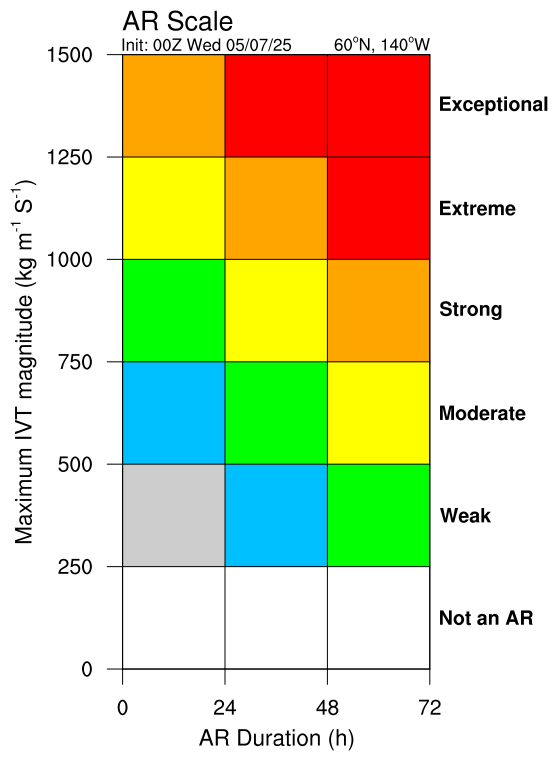
The plot on the right shows where each identified AR falls on the AR Scale matrix and how the AR scale is calculated, identified by letters at the top of each AR in the center diagram. Time periods where IVT >250 kg m-1 s-1 but less than 500 kg m-1s-1 for a duration less than 24 hours will be represented by gray shading in the center diagram and X’s on the right plot.
The plume diagram (center) represents the integrated water vapor transport (IVT) and AR scale forecast.
- The plots shows each of the individual ensemble member (thin gray lines), the West-WRF GFS initialized deterministic forecast (black line), the ensemble mean (green line), and plus or minus one standard deviation from the ensemble mean (red line (+), blue line (-), and gray shading).
- Colored shading represents the AR scale forecast for the given time, shaded according to scale, calculated using the control forecast or ensemble mean.
- At the top of the diagram each identified AR is given a letter representation (used on the right plot) and the maximum IVT during the AR (kg m-1 s-1), the AR duration (hours), and time integrated IVT (107 kg m-1) during the AR are shown.
 |
 |
 |
AR Scale Ensemble Diagnostics
Top left: The plume diagram represents the integrated water vapor transport (IVT) forecast for each of the individual ensemble models (thin gray lines), the West-WRF initialized by GFS deterministic forecast (black line), the ensemble mean (green line), and plus or minus one standard deviation from the ensemble mean (red line (+), blue line (-), and gray shading). Colored shading represents the AR scale forecast for the given time, shaded according to scale, calculated using the model control forecast. Map in upper right shows location chosen. Bottom left: Shading represents the probability of AR Scale conditions at the given location calculated by the number of ensemble members predicting a given AR Scale at each forecast lead time. Right: AR Scale magnitude and timing calculated for each ensemble member shaded according to scale. Dots within shading represent the time of maximum IVT during each forecasted AR. Gray shading in each panel represents IVT >250 kg m-1s-1 but less than 500 kg m-1s-1 for a duration less than 24 hours.
