West-WRF Ensemble Forecast Tools
The products are provided “as is” and are intended for research purposes only (disclaimer ). All products on this page are considered experimental.
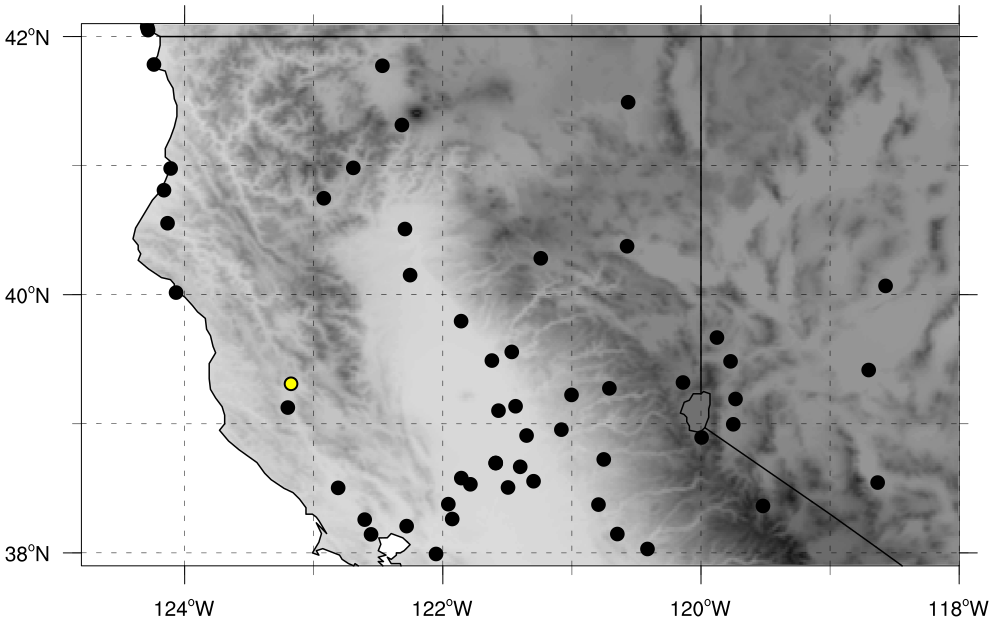
Ensemble Meteograms
Top Left: Box plot of 3-hour accumulated precipitation from the West-WRF ensemble model. Bottom Left: Probability of 3-hour precipitation exceeding various thresholds (threshold defined by colorbar on bottom) calculated by the number of ensemble members predicting precipitation over each threshold at each forecast lead time. Right: Three hour accumulated precipitation from the each ensemble member shaded according to scale valid at the chosen location. Gray shading represents missing data.
Variable:
State:
Location:
Accumulation Period:
Precipitation Snow 2-meter Temperature Wind Speed Arizona California Idaho Montana Nevada Oregon Utah Washington Alturas Arcata/Eureka Arpt Aurburn Municipal Airport Avalon/Catalina Bakersfield/Meadows Barstow-Daggett Beale Afb/Marysvile Beaumont Bicycle Lake Big Bear City Bishop Airport Blue Canyon (Amos) Blythe Airport Borrego Springs Burbank/Glendale Byron Cable Camarillo (Awos) Camp Pendleton Camp Pendleton Mcas Campo (Awrs) Carlsbad/Palomar Chester Chico Municipal China Lake (Naf) Chino Airport Columbia Concord/Buchanan Corona Crescent City Delano Edwards Afb Edwards N-Aux El Centro Naf El Monte El Toro Mcas Eureka Fallbrook Fort Ord Fritzsche Aaf Fortuna Fresno – Chandler Fresno Air Terminal Fullerton Municipal Grass Valley Half Moon Bay Hanford Hawthorne Municipal Hayward Hemet Hollister Imperial Imperial Beach/Ream Inyokern Jackson La / Whiteman La Verne/Brackett Lake Mendocino Lake Oroville Lancaster/Fox Field Lemoore Nas/Reeves Lincoln Livermore Lompoc (Awos) Long Beach Airport Los Alamitos Aaf Los Angeles Downtown/Usc Los Angeles International Airport Los Angeles Intl Madera Mammoth/June Lakes March Afb/Riverside Marysville/Yuba County Mather Field Merced Merced/Castle Af Miramar Nas Modesto City/Sham Moffett Nas/Mtn Vie Mojave Montague/Siskiyou Monterey Peninsula Mount Shasta City Mount Wilson Murrieta Napa County Needles Airport Newhall North Island Nas Novato Oakland Oceano County Oceanside Municipal (Was L32) Ontario Intl Arpt Oroville Oxnard Palm Springs Rgnl Palmdale Palmdale Production Palo Alto Airport Paso Robles Petaluma Placerville Porterville (Awos) Prado Dam Pt Mugu Naws Pt Piedras(Cg/Amos) Ramona Airport Red Bluff Municipal Redding Municipal Reedley Riverside Municipal Sacramento International Airport Sacramento Mcclellan Sacramento Metro Sacramento/Executiv Salinas San Andreas San Bernardino San Carlos Airport San Clemente (Awos) San Diego International Airport San Diego/Brown Fld San Diego/Gillespie San Diego/Montg San Francisco International Airport San Jose Intl A San Jose/Reid/Hillv San Luis Obispo San Martin San Nicolas Island Sandburg (Aut) Santa Ana/Jon-Wayne Santa Barbara Muni Santa Maria Public Santa Monica Muni Santa Rosa Santa Ynez Shelter Cove South Lake Tahoe Stockton Metro Susanville Tehachapi Thermal Airport Torrance Municipal Tracy Travis Afb/Fairfld Trinity Center Truckee-Tahoe Twentynine Palms Ukiah University Usmc Mtn Warfare Tra Vacaville (Was O45) Van Nuys Airport Vandenberg Afb Vandenberg Range Victorville Visalia Muni (Awos) Watsonville Weaverville Yolo County 3-hours 24-hours Total Accumulation Storm Total Accumulation
West-WRF Ensemble Home