Media Portal
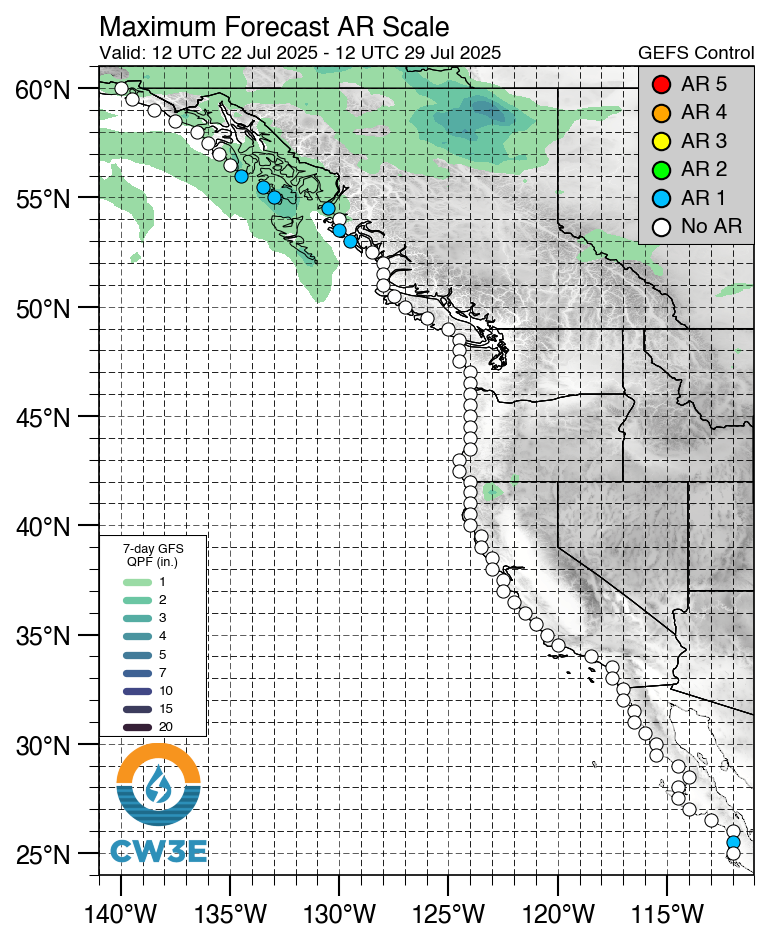
Current Atmospheric River Status – U.S. West Coast
Today:
Incoming
AR Education
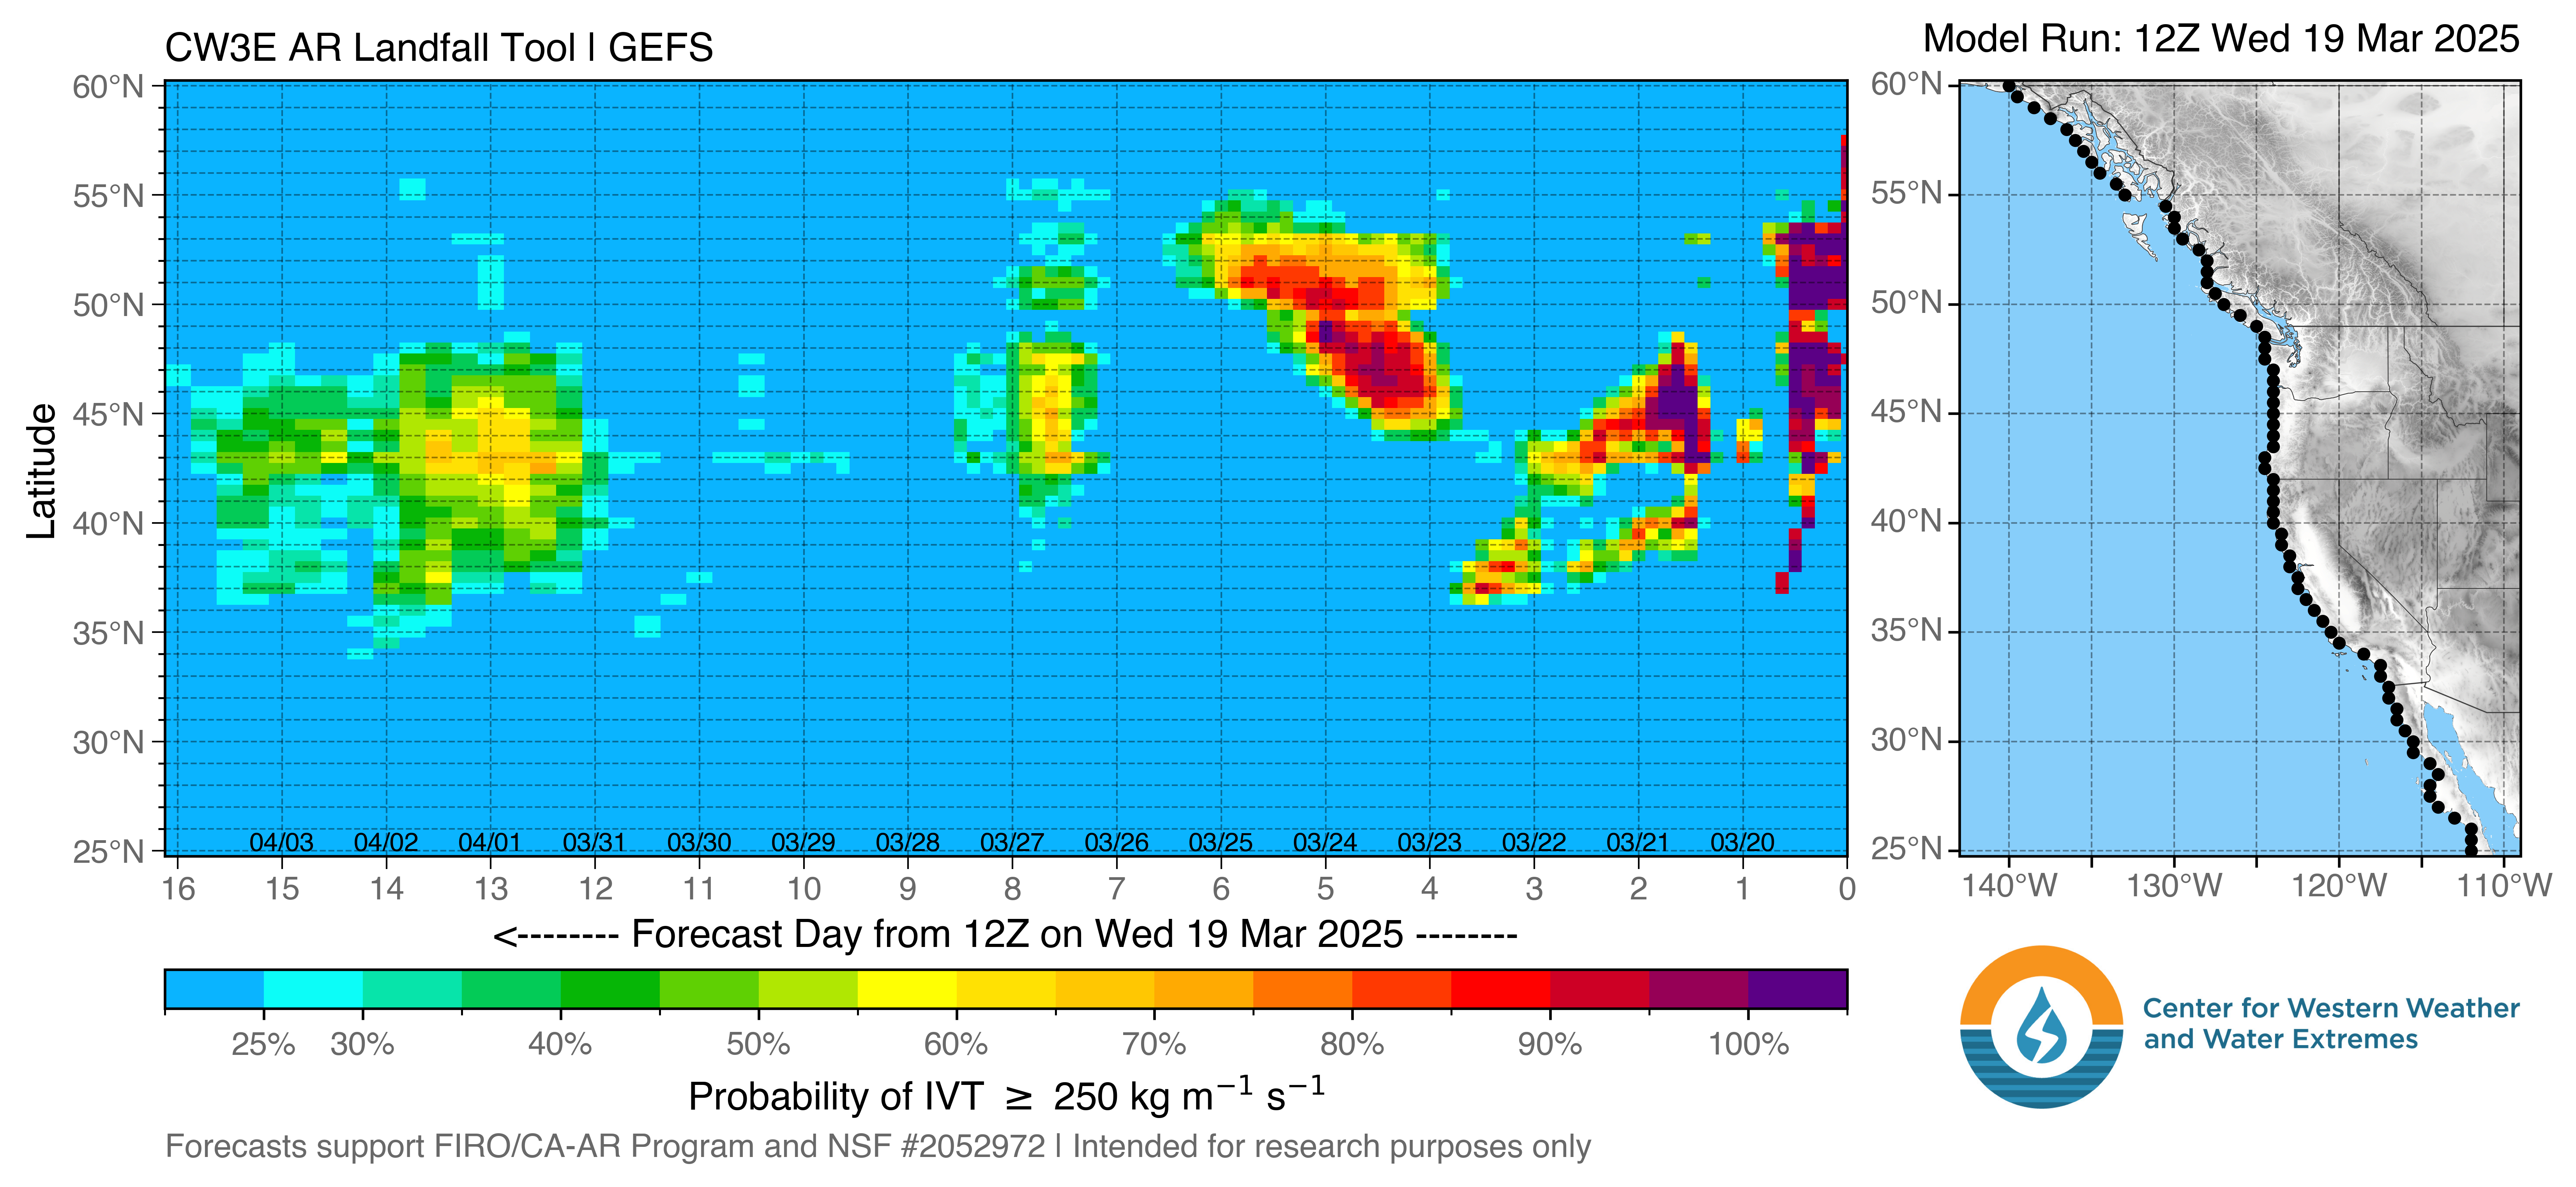
An Atmospheric River is a long, narrow, and transient corridor of strong horizontal water vapor transport that is typically associated with a low-level jet stream ahead of the cold front of an extratropical cyclone. The water vapor in atmospheric rivers is supplied by tropical and/or extratropical moisture sources. Atmospheric rivers frequently lead to heavy precipitation where they are forced upward—for example, by mountains or by ascent in the warm conveyor belt. Horizontal water vapor transport in the midlatitudes occurs primarily in atmospheric rivers and is focused in the lower troposphere. Atmospheric rivers are the largest “rivers” of fresh water on Earth, transporting on average more than double the flow of the Amazon River (American Meteorological Society; 2020).
Informational two-pagers:
- California DWR-CW3E Research and Operations Partnership
- Atmospheric River forecasting decision support tools
- A scale to characterize the strength and impacts of Atmospheric Rivers
- Atmospheric River Reconnaissance
 |
 |
|
Schematic summary of the structure and strength of an atmospheric river based on dropsonde measurements deployed from research aircraft across many atmospheric rivers and on corresponding reanalyses that provide the plan-view context. Magnitudes of variables represent an average midlatitude atmospheric river. Average width is based on atmospheric river boundaries defined by vertically integrated water vapor transport (IVT; from surface to 300 hPa) lateral boundary threshold of 250 kg m−1 s−1. Depth corresponds to the altitude below which 75% of IVT occurs. The total water vapor transport (a.k.a. flux) corresponds to the transport along an atmospheric river, bounded laterally by the positions of IVT = 250 kg m−1 s−1 and vertically by the surface and 300 hPa. (a) Plan view including parent low pressure system and associated cold, warm, and warm-occluded surface fronts. IVT is shown by color fill (magnitude; kg m−1 s−1) and direction in the core (white arrow). Vertically integrated water vapor (IWV; cm) is contoured. A representative length scale is shown. The position of the cross section shown in (b) is denoted by the dashed line A–A′. (b) Vertical cross-section perspective, including the core of the water vapor transport in the atmospheric river (orange contours and color fill) and the pre-cold-frontal low-level jet (LLJ), in the context of the jet-front system and tropopause. Water vapor mixing ratio (green dotted lines; g kg−1) and cross-section-normal isotachs (blue contours; m s−1) are shown. [Schematic is from Ralph et al. (2017). It was prepared by F. M. Ralph, J. M. Cordeira, and P. J. Neiman based on the composite of research-aircraft-based observations of 21 atmospheric rivers presented in Ralph et al. (2017), including adaptations of earlier results from Ralph et al. (2004), Cordeira et al. (2013), and others. The 21 observed cases were compared with thousands of ARs found in ERA and MERRA-2 over 37–38 years in the same region and season (Guan et al. 2018). The composite of the 21 aircraft-observed cases was shown to be representative of the broad spectrum of ARs in the reanalyses](American Meteorological Society; 2020). |
|
AR Forecast and Observation Tools
 |
 |
 |
 |
|
Additional CW3E forecast products: |
|||
AR Resources
To request an interview or obtain b-roll or images, email scrippsnews@ucsd.edu.
CW3E Contacts:

Director AR Expert and CW3E Research Lead |

Deputy Director CW3E Research and Modeling |

Field Research Manager Field work, observations, and AR Recon |

Operations Manager Climate |

Program Manager AR forecasting and atmospheric dynamics |

Applications Programmer AR Forecasting and website tools |

Meteorology Staff Researcher AR Forecasting and website tools |

Meteorology Staff Researcher AR Forecasting |
CW3E Partners:
California Department of Water Resources
NASA/Jet Propulsion Laboratory
U.S. Army Corps of Engineers, Engineer and Research Development Center

