CW3E has installed surface meteorological stations in watersheds across the western United States with the scientific goal of observing and monitoring the hydrometeorology of the western watersheds. This is particularly critical during cool-season precipitation events, including those associated with atmospheric rivers (ARs). However, our stations make continuous observations in these watersheds year-round. These stations measure a variety of variables, including temperature, relative humidity, pressure, precipitation, wind speed and direction, and solar radiation. Specific stations also measure the soil moisture and temperature at six levels within the soil profile. Other select stations also measure snow depth, fuel moisture, and fuel temperature. At each of these stations, data points are being collected at two minute intervals. Most stations provide near real-time data for situational awareness in addition to their use in accomplishing research objectives. Currently, efforts are being made to make all observations available in near real time.
At all Surface Meteorology sites, sensors are installed on either a 10 foot tall tripod with an 11.5 ft base diameter, on a 10 ft tall post installed with concrete, or on a Rohn tower approximately 20 feet tall installed with concrete. Photographs depicting the set up of our Surface Meteorology stations as well as plots of current data can be found below.
Surface meteorological and soil moisture station with labeled components at the Stagecoach Reservoir installed in the Yampa Basin.
Tipping Buckets
Tipping bucket rain gauges at the stations are the Texas Electronics TE525MM and they have 24.5cm funnels that tip at 0.1mm resolution. This instrument is equipped with a magnet attached to the tipping mechanism which triggers a switch as the bucket tips, and the switch count is recorded into the data logger. These rain gauges are not heated unless the site has line power available. They do not have windshields, but are equipped with bird spikes.
Pyranometers
Incoming shortwave solar radiation is measured with a Campbell Scientific digital thermopile pyranometer model CS320. These sensors are equipped with a thermopile detector, an acrylic diffuser, a heater, an onboard level sensor, and a signal processing circuitry inside of aluminum housing that contains no internal air space. This sensor is heated and kept level with a Z-axis measurement. The pyranometer utilizes a series of thermoelectric junctions to determine the temperature difference between a black absorbing surface and a reference, as the black absorbing surface uniformly absorbs solar radiation across the solar spectrum, and uses this information to determine the incoming shortwave solar radiation. Many new sites are equipped with Campbell Scientific’s SP Lite2. This sensor measures the solar radiation received from the entire hemisphere with a 180° view and outputs values in Watts per square meter. This sensor has a housed photodiode which can generate a voltage output that is proportional to the radiation input it receives. It is designed for continuous use in an outdoor setting and can withstand all weather conditions.
Anemometers
Horizontal wind speed and direction is measured with an RM Young anemometer model 05106. This instrument is a helicoid-shaped, four-blade propeller, which produces an AC sine wave signal with a frequency that is proportional to the wind speed and the direction of the wind.
Barometers
The pressure is measured with Campbell Scientific barometer model CS106. This sensor uses a BAROCAP silicon capacitive sensor by Vaisala in order to measure the barometric pressure between 500 to 1100 mb. It is equipped with an intake valve for equalization of pressure and it emits a linear 0 to 2.5 VDC signal that corresponds to its range in mb.
Temperature and Humidity
Temperature and relative humidity are measured with Campbell Scientific HygroVUE10 probe which utilizes a sensing element based on Sensirion’s CMOSens technology. The HygroVUE10 is a digital sensor which improves its accuracy and fitness for weather networks. Dirt and water are prevented from going into the car by use of a filter that is hydrophobic sintered, along with a secondary PTFE membrane filter to prevent fine dust and mold growth. At surface meteorology stations, the sensor is deployed within shading housing to prevent direct solar radiation impacts on temperature measurements.
Data Loggers
Finally, at each site we use a CR1000X data logger, which can communicate with sensors as well as control telecommunications. Within the logger, the electronics are housed in a sealed, stainless-steel canister with a battery-backed clock. Along with the logger, we use an industrial 4G LTE cellular gateway RV50X cell modem, a 20 W SP20 solar panel fit for high elevation and latitude, and a rechargeable 12 V valve-regulated lead-acid battery CH150 charging regulator, all of which are also from Campbell Scientific. For stations that do not have cellular service, they are wired with a Geostationary Operational Environmental Satellites (GOES) system. GOES satellites are the communication liaison between remote data collection locations and the processing facility operated by NOAA. This allows for high-efficiency data transmission in far remote locations.
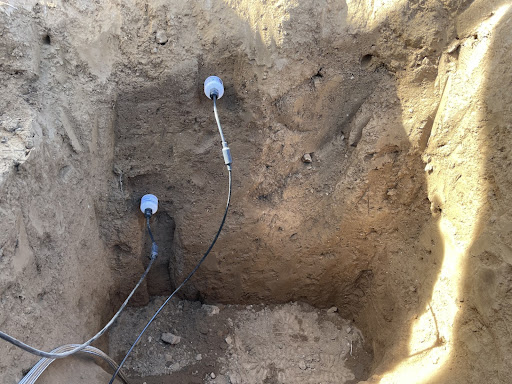
Soil moisture sensors installed at different depths in the soil profile at the Yucaipa Valley surface meteorology station.
SMOIL Sites
Many of our surface meteorology sites also include soil moisture and temperature sensors at six different depths in the soil profile. Each site with these sensors are deployed at 5, 10, 15, 20, 50, and 100 cm below the soil surface. At specific sites in Colorado, the soil sensors are deployed at 2, 4, 6, 8, 20, and 40 inches below the surface to match the depths used by the NRCS and other partners in the Colorado region. To measure the soil moisture, electrical conductivity, and temperature, CW3E deploys Stevens HydraProbes at these listed depths. The HydraProbe uses dielectric impedance using a 50 MHz radio frequency wave and measuring the energy stored and lost in the soil profile. The energy storage versus energy losses are separated and onboard computing determines the soil’s dielectric permittivities, which accounts for electrical conductivity. This is a highly effective and accurate method of determining the sought after parameters. Some older stations may be equipped with the Campbell Scientific water content reflectometers, model CS616 to measure soil moisture using 30-cm-long stainless-steel rods and Campbell Scientific thermistors, model 107 using thermistors contained in epoxy-filled aluminum housing to measure soil temperature.
Snow Depth and Fuel Moisture/Temperature
Additional sites include sensors that monitor the snow depth and the moisture content and temperature of fuel. To measure the snow depth, CW3E deploys Campbell Scientific’s SnowVUE10, which uses ultrasonic waves to measure snow depth. The instrument measures the round-trip travel time of the pulse, and therefore calculates the distance from the sensor, installed at a known height, to the snow. This design uses low power and is low maintenance, and suitable for remote alpine environments. Accurate air temperature measurements are taken into account in this calculation. Campbell Scientific’s CS506 Fuel Moisture Sensor is used to determine the temperature and moisture of a 2660110 10-hour fuel moisture dowel, which is representative of the moisture level of similarly-sized twigs that are on the forest floor to assess forest fire fuel. This sensor contains electronics in epoxy using time-domain reflectometry technology to determine the moisture level, producing a ± 0.7 Vdc square-wave frequency. This frequency is read and converted into percent fuel moisture through quadratic calibration.
RadMet Sites
Some other surface meteorology sites are collocated with RadMet sites which include MicroRain Radars and disdrometers.
We would like to acknowledge our sponsors as well as our partners and collaborators that supported these instruments and allowed the deployment of these stations on their property. For more information about CW3E’s surface observations sponsors and collaborators, please see the bottom of the page.
Email alerts for extreme precipitation within the Yuba and Feather River watersheds are available for the CW3E deployed stations. For more information and to sign up for these alerts click here. An alert for CW3E stations and SNOTELS in and near the Upper Yampa watershed is also available. For more information and to sign up for these alerts click here.
An archive of CW3E collected surface meteorological and stream data in the Russian River watershed is available at https://doi.org/10.6075/J0SX6DDH.
The plots here represent raw data from the station and have not undergone any quality control. Plots are updated once per hour. Please direct any questions and requests for past and/or QC’d data to cw3e-fieldwork-g@ucsd.edu.
Plot description: Surface meteorological and soil data observed at the location highlighted in the map. Top panel shows temperature (°F; blue line) and relative humidity (percentage; red line), second panel shows mean sea level pressure (hPa; black line) and solar radiation (W/m2; green line), third panel shows wind speed (line; m/s) and direction (vectors), fourth panel shows hourly precipitation (inches; blue bars) and accumulated precipitation during the period shown (inches; red line), fifth panel shows the soil moisture (fraction) at various depths (color denoted by legend on right), and the bottom panel shows the soil temperature (°F) at the same depths as soil moisture. Click the following links for an archive of raw data or images.
Watershed:
Location:
Variable:
Our sponsors and collaborators
We would like to acknowledge our sponsors as well as our partners and collaborators that supported these instruments and allowed the deployment of these stations on their property.
CW3E is grateful to participate in the California Cooperative Snow Survey Data Acquisition Round Table (DART). The purpose of the DART is to create an open forum to discuss data acquisition experiences, knowledge and recommendations, and to build consensus around professional instrumentation and measurement standards. More information can be found here at the Central Sierra Snow Lab website (choose “CCSS DART” on the top line menu).
In the Santa Ana watershed of southern California, efforts are underway to expand the current network in support of Prado FIRO, sponsored by USACE and in partnership with NOAA, U.S. Army Engineer Research and Development Center, and Orange County Water District.
In the Duwamish/Green River watershed in Washington, stations were installed in support of FIRO at Howard Hanson Dam, sponsored by Tacoma Water, and in partnership with the U.S. Army Corps of Engineers.
CW3E was sponsored by NOAA’s Office of Weather and Air Quality to install meteorological stations in the Tuolumne watersheds to improve observations of high impact hydrometeorological events in the Sierra Nevada mountains of California. Ongoing maintenance of these sites and others that will be telemetered in the coming months, and installation of a new site in the Merced watershed is supported by the Department of Water Resources as part of CW3E’s Atmospheric River Program and NatureBridge. These sites were made possible with help from our partners at Hetch Hetchy Water & Power, San Francisco Public Utilities Commission, National Parks Service and Portland State University.