
Where was the most extreme precipitation yesterday in the West?
January 10, 2017
Sign up to receive an automated “R-Cat Extreme Precipitation Alert” email from CW3E showing the most extreme precipitation events over the previous 3 days (only on the rare days when there is extreme precipitation). The attached map shows the locations of 52 such reports from the storm that hit the West from 7-10 January 2017.
|
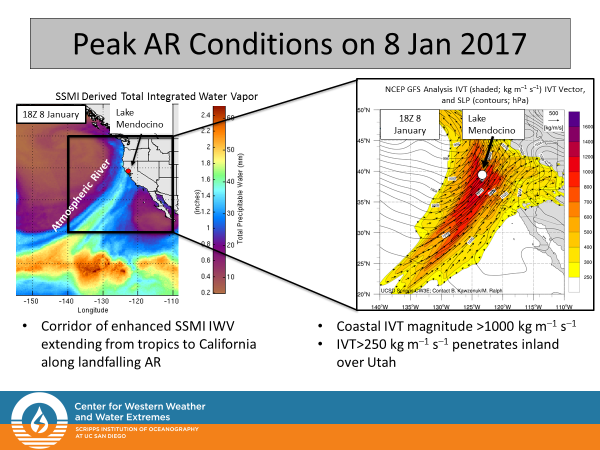
The maximum three-day precipitation during the weekend event was 521 mm (20.51 inches) at a location called Strawberry Valley on the western slopes of the Sierra Nevada Mountains, about 1,161 meters (3,807 feet) above sea level, near Interstate 80. That made this an “R-Cat 4” extreme precipitation event on the CW3E’s scale. This is the top magnitude possible and is very rare. “R-Cat” stands for “Rainfall Category,” a simple scaling system invented by CW3E’s Marty Ralph and Mike Dettinger (see brief journal article here or here). The landfall of a very strong long-duration atmospheric river (AR) (see second figure) followed by a second AR in California over the last few days produced extreme precipitation over much of Central and Northern California. This event was identified and reported in real-time by a new tool developed by David Pierce and Marty Ralph at CW3E that automatically monitors rain gauges across the Western U.S. and sends an email alert when extreme precipitation events occur to anyone signed up for the service. The service is free and is intended to provide information to interested individuals in a timely manner. |
 |
To subscribe to this automated CW3E R-Cat Extreme Precipitation Alert via email: just email a message with subject “subscribe” to rcatalert@cirrus.ucsd.edu.
The alerts use a simple new method to identify extreme events, which was published after analysis of decades of daily rainfall showed that 3-day precipitation totals were the most logical choice to characterize events that can have the broadest and largest impacts, especially in the Western U.S. The categorization method is based on 3-day observed precipitation totals (rain and/or the liquid equivalent of snow that fell), where “R-Cat” is short for “Rainfall Category:”
R-Cat 1: 200-299 mm (roughly 8-12 inches) / 3 days
R-Cat 2: 300-399 mm (roughly 12-16 inches) / 3 days
R-Cat 3: 400-499 mm (roughly 16-20 inches) / 3 days
R-Cat 4: more than 500 mm (more than roughly 20 inches) / 3 days
Historically these R-Cat events have occurred nationally with the following average annual frequencies (based on a network of several thousand rain gages that each had to have at least 30 years of daily observations; note that the R-Cat Alert tool does not require sites to have had 30 years of data, so more sites are likely to be found meeting the R-Cat criteria than in the earlier detailed analysis):
R-Cat 1: 48 episodes involving a total of 173 rain gauge sites that exceed the R-CAT1 threshold per year
R-Cat 2: 9 episodes involving 23 rain gauge sites that exceeded the R-CAT2 threshold
R-Cat 3: 2 episodes involving 4 rain gauge sites that exceeded the R-CAT3 threshold
R-Cat 4: 1 episode Involving 2 rain gauge sites that exceeded the R-CAT4 threshold
For comparison, the number of R-Cat 3 or 4 events annually roughly matches the average number of major hurricanes that occur annually in the Atlantic (Cat 3, 4, 5 combined) and the number of the most extreme tornadoes that occur (EF-4 and 5 combined).
Notably, in light of the events of last weekend, it is useful to note that, in the Western US between 1948 and 2010, 44 of the 48 occasions when RCAT3 or RCAT4 conditions were reached coincided with the arrival of an atmospheric-river storm.