CW3E Publication Notice
Global Evaluation of Atmospheric River Subseasonal Prediction Skill
July 26, 2018
CW3E collaborators Michael DeFlorio (NASA/JPL), Duane Waliser (NASA/JPL), and Bin Guan (UCLA), along with CW3E director Marty Ralph and colleague Frederic Vitart of the European Centre for Medium-Range Weather Forecasts (ECMWF), recently published a paper in Climate Dynamics titled Global Evaluation of Atmospheric River Subseasonal Prediction Skill (DeFlorio et al., 2018).
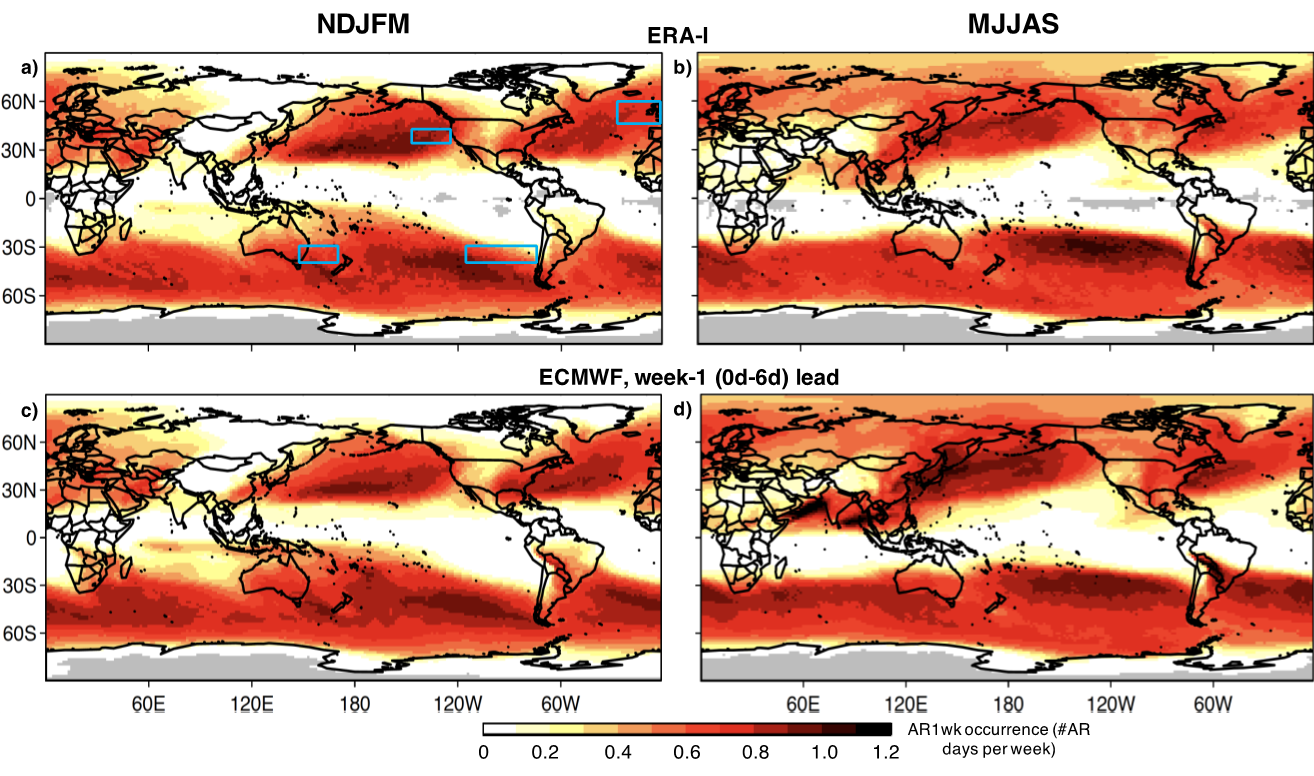
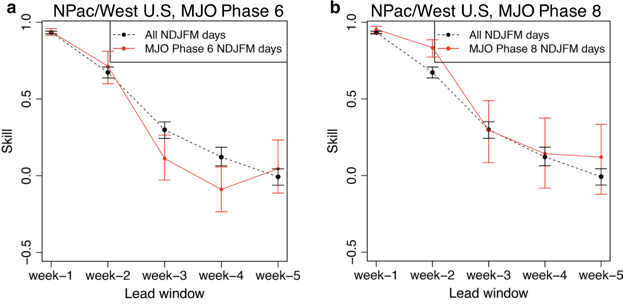
The study uses the number of AR days occurring over a week-long period (Fig 1), to quantify global atmospheric river (AR) prediction skill using Subseasonal to Seasonal (S2S) Project hindcast data from ECMWF. The study found that ECMWF forecast skill is higher than a reference forecast in several subtropical and midlatitude regions up to a three-week (15-day to 21-day) lead time. The forecast skill is affected during particular phases of climate mode variability, including the El Niño-Southern Oscillation, Arctic Oscillation, Pacific-North America teleconnection pattern, and Madden-Julian Oscillation (Fig 2). In particular, forecast skill is generally improved at week two during MJO Phase 8 conditions. The results highlighted in this paper provide information to support improved subseasonal forecasts.

Figure 1. Figure (1a-d) from DeFlorio et al. (2018): Global climatology of atmospheric river (AR) occurrence (number of AR days per week; hereafter AR1wk occurrence) for ERA-I and ECMWF in November-December-January-February-March (NDJFM; a,c) and May-June-July-August-September (MJJAS; b,d) during the period 1996-2015. The week-1 (0d-6d) lead time forecast window is chosen. Blue rectangles in a) denote area-averaged regions selected for analyses in subsequent figures.

Figure 2. Figure (13a,b) from DeFlorio et al. (2018): Composite forecast skill of AR1wk occurrence (number of AR days per week) anomalies during particular MJO phases (red) over the North Pacific/Western US regions in NDJFM during the period 1996–2015. Mode and region combinations with large (~ 95% confidence) skill differences between particular MJO phases and the all-days case are shown. Red and black horizontal lines represent 95 and 5% quantile values for a bootstrapped distribution of the particular MJO phase and all days case, respectively, re-sampled 1000 times with replacement.
DeFlorio, M., D. Waliser, B. Guan, F.M. Ralph, and F. Vitart, 2018: Global evaluation of atmospheric river subseasonal prediction skill. Climate Dynamics, early online release, https://doi.org/10.1007/s00382-018-4309-x
