CW3E Publication Notice
Hourly Analyses of the Large Storms and Atmospheric Rivers that Provide Most of California’s Precipitation in Only 10-100 Hours per Year
January 2, 2019
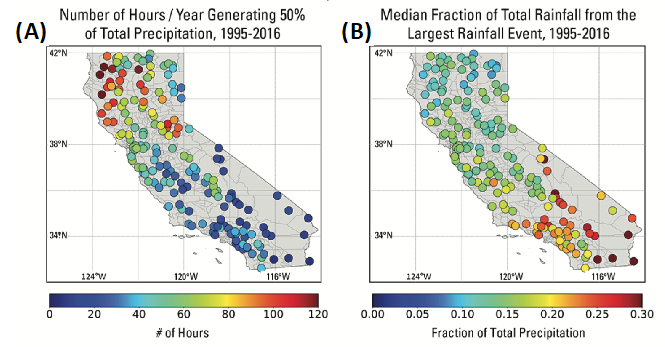
California is regularly affected by floods and droughts, primarily as a result of too many or too few atmospheric rivers (ARs). This study analyzes a 2-decade-long hourly precipitation data set from 176 California weather stations and a 3-hourly AR chronology to report variations in rainfall events across California and their association with ARs. On average, 10–40 and 60–120 hours of rainfall in southern and northern California, respectively, are responsible for more than half of annual rainfall accumulations. Approximately 10% to 30% of annual precipitation at locations across the state is from only one large storm (Figure 1).
Figure 1: (A) median number of hours generating 50% of annual total rainfall, 1995–2016, and (B) median fraction of annual total rainfall from the largest rainfall event, 1995–2016 (from Figure 2, Lamjiri et al., 2018).
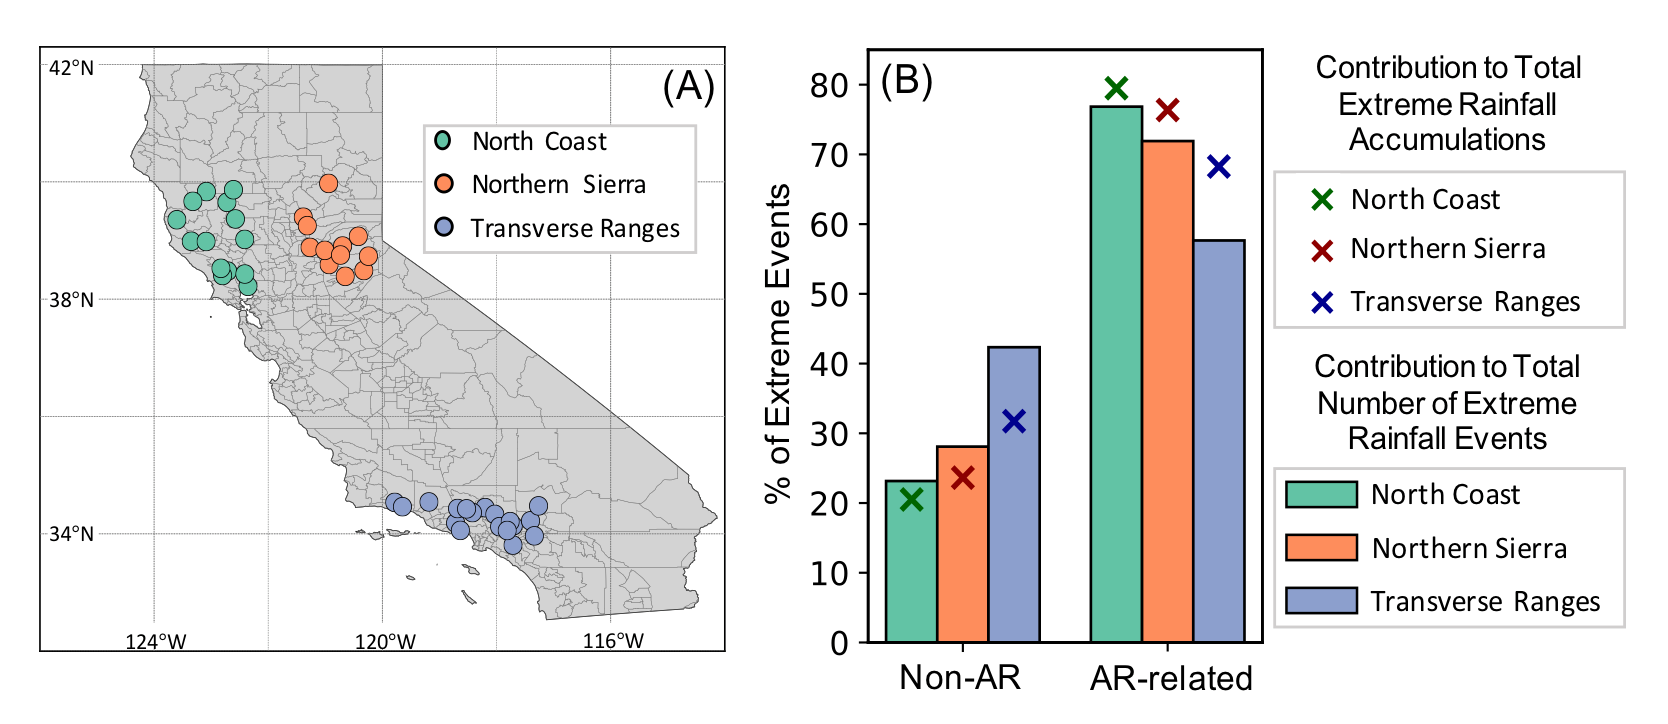
On average, northern California receives 25 to 45 rainfall events annually (40% to 50% of which are AR-related). These events typically last longer and have higher event-precipitation totals than those in southern California. Northern California also receives more AR landfalls with longer durations and stronger Integrated Vapor Transport (IVT). On average, ARs contribute 79%, 76%, and 68% of extreme-rainfall accumulations (i.e., top 5% events annually) in the north coast, northern Sierra, and Transverse Ranges of southern California, respectively (Figure 2).
Figure 2: (A) Location of stations in the north coast, northern Sierra, and Transverse Ranges, where receive some of the most extreme rainfall events in California, (B) median contribution of ARs to total extreme rainfall accumulations and total number of extreme rainfall events (from Figure 8, Lamjiri et al., 2018).
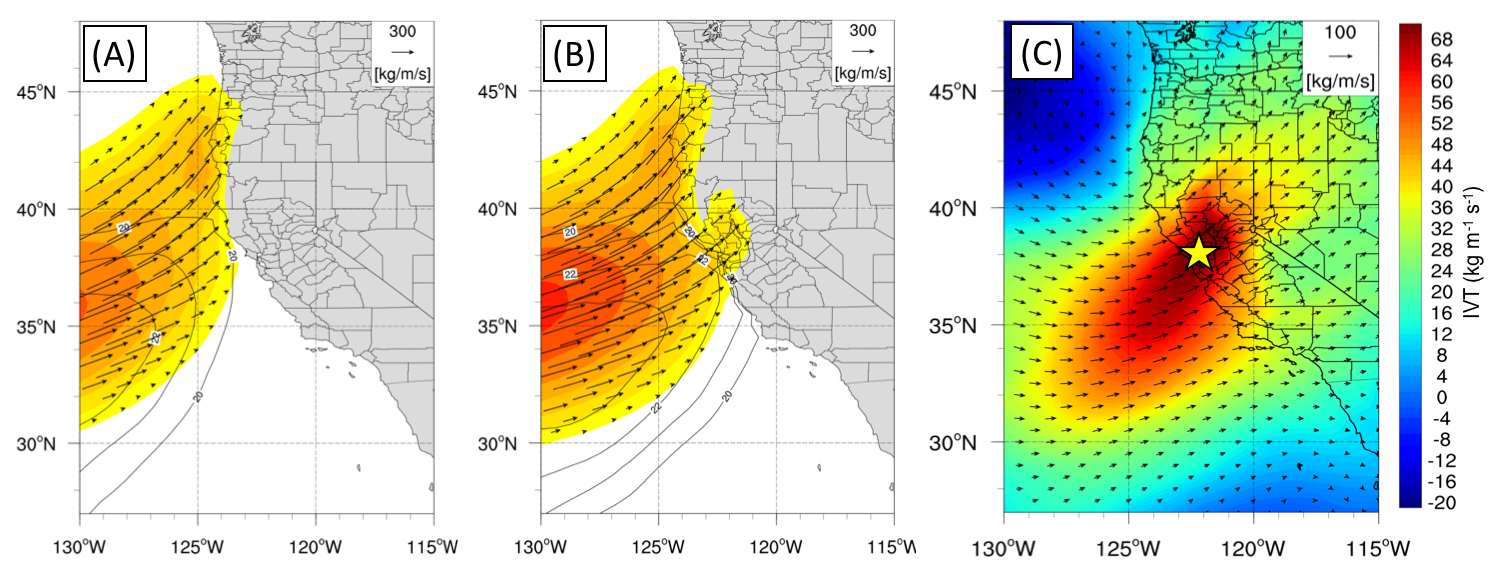
The San Francisco Bay Area terrain gap in the California Coast Range allows more AR water vapor to reach inland over the Delta and Sacramento Valley, and thus influences precipitation in the Delta’s catchment. This is particularly important for extreme precipitation in the northern Sierra Nevada (Figure 3).
Figure 2: Composites of daily-averaged IVT (shading) and IWV (contours) for days of AR-related extreme rainfall events over the (A) north coast, and (B) northern Sierra (from Figure 9, Lamjiri et al., 2018) and (C) panel A subtracted from panel B (Difference in IVT composites associated with extreme rainfall in the north coast and northern Sierra Nevada; from figure 10, Lamjiri et al. 2018). The location of the San Francisco Bay Area gap is shown by the yellow star in panel C.
This study highlights differences between rainfall and AR characteristics in coastal versus inland northern California—differences that largely determine the regional geography of flood risks and water reliability. These analyses support water resource, flood, levee, wetland, and ecosystem management within the catchment of the San Francisco Estuary system by describing regional characteristics of ARs and their influence on rainfall on an hourly time-scale.
Lamjiri, M. A, Dettinger, M. D, Ralph, F. M, Oakley, N. S, & Rutz, J. J. (2018). Hourly Analyses of the Large Storms and Atmospheric Rivers that Provide Most of California’s Precipitation in Only 10 to 100 Hours per Year. San Francisco Estuary and Watershed Science. 16(4). Retrieved from https://escholarship.org/uc/item/3jr7z162 .


