CW3E Publication Notice
Towards probabilistic post-fire debris flow hazard decision support
September 18, 2023
A paper titled “Towards probabilistic post-fire debris flow hazard decision support” was recently published in the journal Bulletin of the American Meteorological Society. This research was a collaboration among CW3E, the California Geological Survey, the U.S. Geological Survey, the University of Arizona, and the National Weather Service.
Post-fire debris flows (PFDFs) threaten life, property, and infrastructure in steep wildfire-prone terrain worldwide. PFDFs are mixtures of water and sediment, typically with a sediment concentration exceeding 50% by volume. In the first few years following a wildfire, PFDFs often initiate when short duration (typically <1 hour), high-intensity rainfall produces runoff that rapidly entrains sediment on steep slopes. Note that nearly all PFDFs that occur within two years after fires are distinct from shallow landslides; they are runoff-driven, not infiltration-driven, and do not require antecedent rainfall nor high storm-total or multi-hour rainfall. As PFDFs become a more frequent hazard affecting larger areas, there is an increasing need for decision-support tools to effectively convey uncertainty around rainfall intensities, PFDF likelihood, volume, and potential impacts. As PFDFs are rainfall-driven, there is a particular need for tools that merge rainfall forecasts from numerical weather prediction models with models designed to assess PFDF hazard.
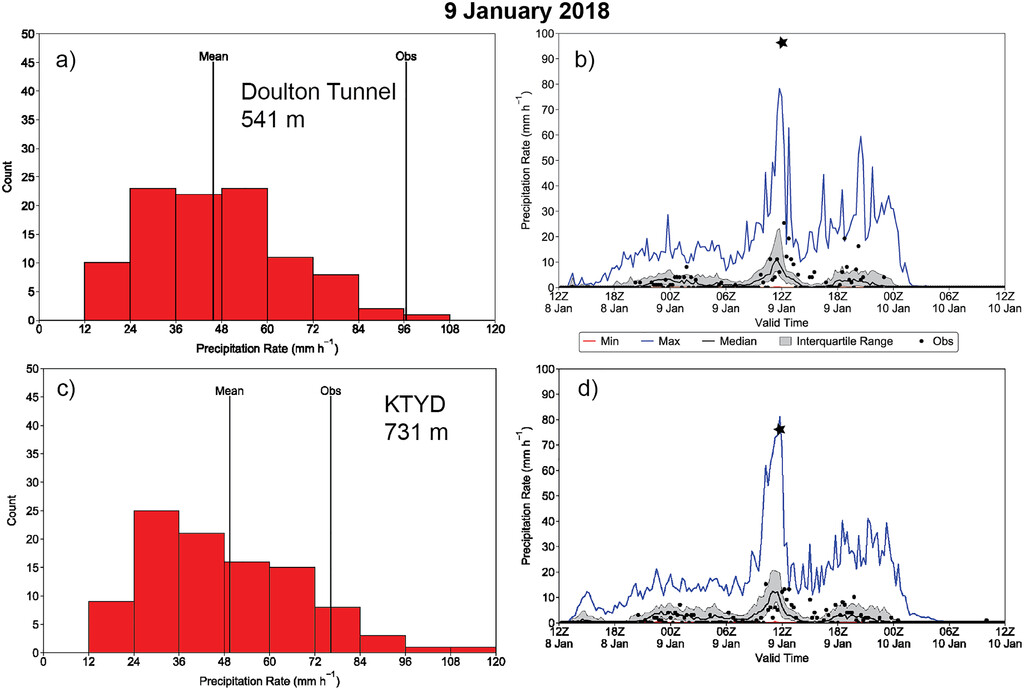
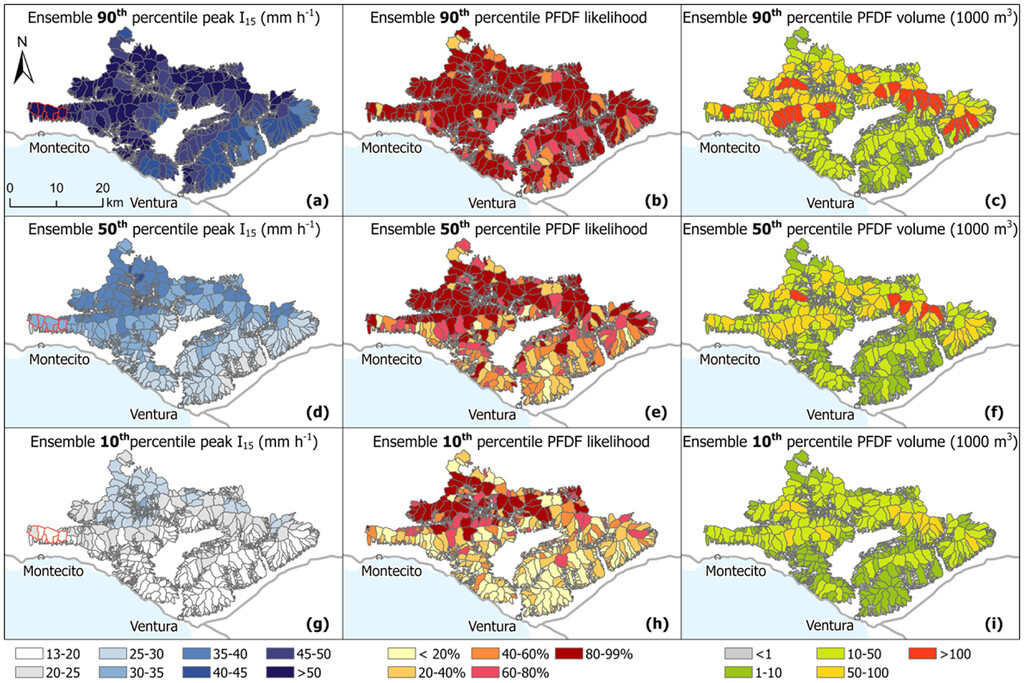
This paper explores the challenges in operational forecasting and communicating information about PFDF hazards. Through two case study events on the 2017 Thomas Fire burn area (Santa Barbara/Ventura Counties, CA) using a high-resolution (1km), large ensemble (100-member) 24-hour lead time precipitation forecast. It proposes a framework for integrating ensemble forecasts from mesoscale models with PFDF likelihood and volume models to create decision-support tools. We find that the observed 15-minute rainfall intensities for the events evaluated are captured within the ensemble spread, although in the highest 10% of members (Fig. 1). Given this distribution, consideration of the full model ensemble spread in areas with values-at-risk is necessary. While this work demonstrates that it is feasible to integrate ensemble precipitation forecasts with PFDF likelihood and volume models (Fig. 2), additional work needs to be done to understand and potentially reduce the sources of uncertainty in forecasting short-duration, high-intensity rainfall. As demonstrated, the ensemble simulation is likely too computationally expensive to run operationally. Future research can optimize the forecast lead time, number and characteristics of ensemble members, domain size, and grid spacing.
This work addresses CW3E’s strategic plan goal of improving weather, hydrology, and coupled modeling capabilities for the western United States as it couples a numerical weather prediction model (using the West-WRF configuration) with debris flow likelihood and volume models. It provides insights to model successes and challenges associated with short-duration, high-intensity precipitation that can be further explored in future research. Additionally, it addresses the CW3E core value of collaboration. This work demonstrates the benefits of collaborations between the geomorphology and meteorology communities to improve decision support for PFDF hazards.
Figure 1: a) Histogram of 15-minute precipitation forecasts, in mm h-1, from the 100 WRF ensemble members at the location of the Doulton Tunnel rain gauge, using a 1-km neighborhood and temporal window of +/- 1 h about the time of maximum observed rainfall. Vertical lines indicate ensemble mean and gauge observation. b) Time series of the observed (dots) and ensemble forecast 15-minute rainfall rates at the WRF grid cell closest to the location of the Doulton Tunnel rain gauge; no neighborhood method is used. The black star indicates the maximum 15-minute observed rainfall. The ensemble median, minimum, and maximum forecast values are denoted by the black, red, and blue lines, respectively, and the gray shading represents the ensemble interquartile range. c) As in a) for the KTYD gauge. d) As in b) for the KTYD gauge. See Fig. 4b for gauge locations. Gauge data acquired from County of Santa Barbara Department of Public Works via https://rain.cosbpw.net/.
Figure 2:: For the 9 January 2018 event, in the top row, ensemble 90th percentile a) peak I15, b) probability of debris flow occurrence, and c) predicted volume. In the middle row, ensemble median d) peak I15, e) probability of debris flow occurrence, and f) predicted volume. In the bottom row, ensemble 10th percentile g) peak I15, h) probability of debris flow occurrence, and i) predicted volume. The coordinates of the top left and bottom right corners of each map are (34o39’N, 119o41’W) and (34o15’N, 118o56’W), respectively.
This research was supported by the California Department of Resources Atmospheric River Program and the NOAA Collaborative Science, Technology, and Applied Research (CSTAR) program.
Oakley, N. S., Liu, T., McGuire, L. A., Simpson, M., Hatchett, B. J., Tardy, A., Kean, J. W., Castellano, C., Laber, J. L., & Steinhoff, D. (2023). Toward Probabilistic Post-Fire Debris-Flow Hazard Decision Support. Bulletin of the American Meteorological Society, 104(9), E1587-E1605. https://doi.org/10.1175/BAMS-D-22-0188.1


