
CW3E Publication Notice
Analyzing Atmospheric River Reforecasts: Self-Organizing Error Patterns and Synoptic-Scale Settings
June 17, 2025
Greta Easthom, a CW3E-funded PhD student at North Carolina State University, along with co-authors and advisor Dr. Gary Lackmann, Dr. Maria Molina from University of Maryland, and CW3E scientists Laurel DeHaan and Dr. Jay Cordeira, recently published a paper entitled, “Analyzing Atmospheric River Reforecasts: Self-Organizing Error Patterns and Synoptic-Scale Settings” in Weather and Forecasting (WAF). By grouping short-term West-WRF reforecast errors and their associated flow patterns on a meso-synoptic to subseasonal-to-seasonal scale via a neural network, this study is a first step in identifying background states and physical processes contributing to reduced AR forecast skill, and contributes to the Atmospheric Rivers and Extreme Precipitation Research, Prediction, and Applications priority identified in CW3E’s Strategic Plan.
Easthom et. al (2025) takes a novel approach to achieve this identification of forecast error patterns by training the self-organizing maps (SOMs) on the integrated vapor transport (IVT) difference between West-WRF 144-hour reforecasts and the ERA5 reanalysis, revealing error patterns related to translation speed and intensity. This study also separates the reforecast into ‘unmatched’ (misses and false alarms) and `matched’ cases to isolate the unique factors leading to these two types of lower-skill forecasts. In the upper left node of the matched cases (Fig. 1, node 1), the maximum ERA5 AR density (green contours) is displaced north and west, behind the maximum West-WRF AR density (black contours). This pattern is consistent with a positive West-WRF AR translation speed bias (i.e., forecasted ARs moving too quickly), as well as the IVT error couplet, which exhibits positive differences to the southeast and negative differences to the northwest. Overall, this general pattern characterizes the nodes in the upper-left region of this SOM (Fig. 1, nodes 1, 2, and 5). In contrast, nodes 12, 15, and 16 in the lower right portion exhibit the opposite dipole pattern, consistent with a negative translation speed bias (i.e., forecasted ARs moving too slowly). Meanwhile, the upper right and lower left SOM nodes exhibit regional patterns associated with AR IVT intensity biases: In the upper right node (Fig 1., node 4) reforecast West-WRF IVT is too weak, while in the lower left node, it is too strong (Fig 1., node 13).
These four general error groupings are also associated with different meteorological backgrounds. For instance, for matched cases with a negative AR translation speed bias, anomalous downstream ridging was evident in composites (Fig. 2, node 4), with the opposite pattern (upstream troughing) for cases with a positive translation speed bias (Fig. 2, node 1). These positive West-WRF AR translation speed biases for matched cases were also more likely during MJO phase 5, while phase 5 was less frequent during the negative West-WRF translation speed bias. These findings are likely linked to the eastward-extended stronger jet present for most of the phase 5 cases. Several other patterns were extracted for the matched and unmatched cases alike, and sorting by training on the IVT difference fields effectively distinguished error types by meteorological features.
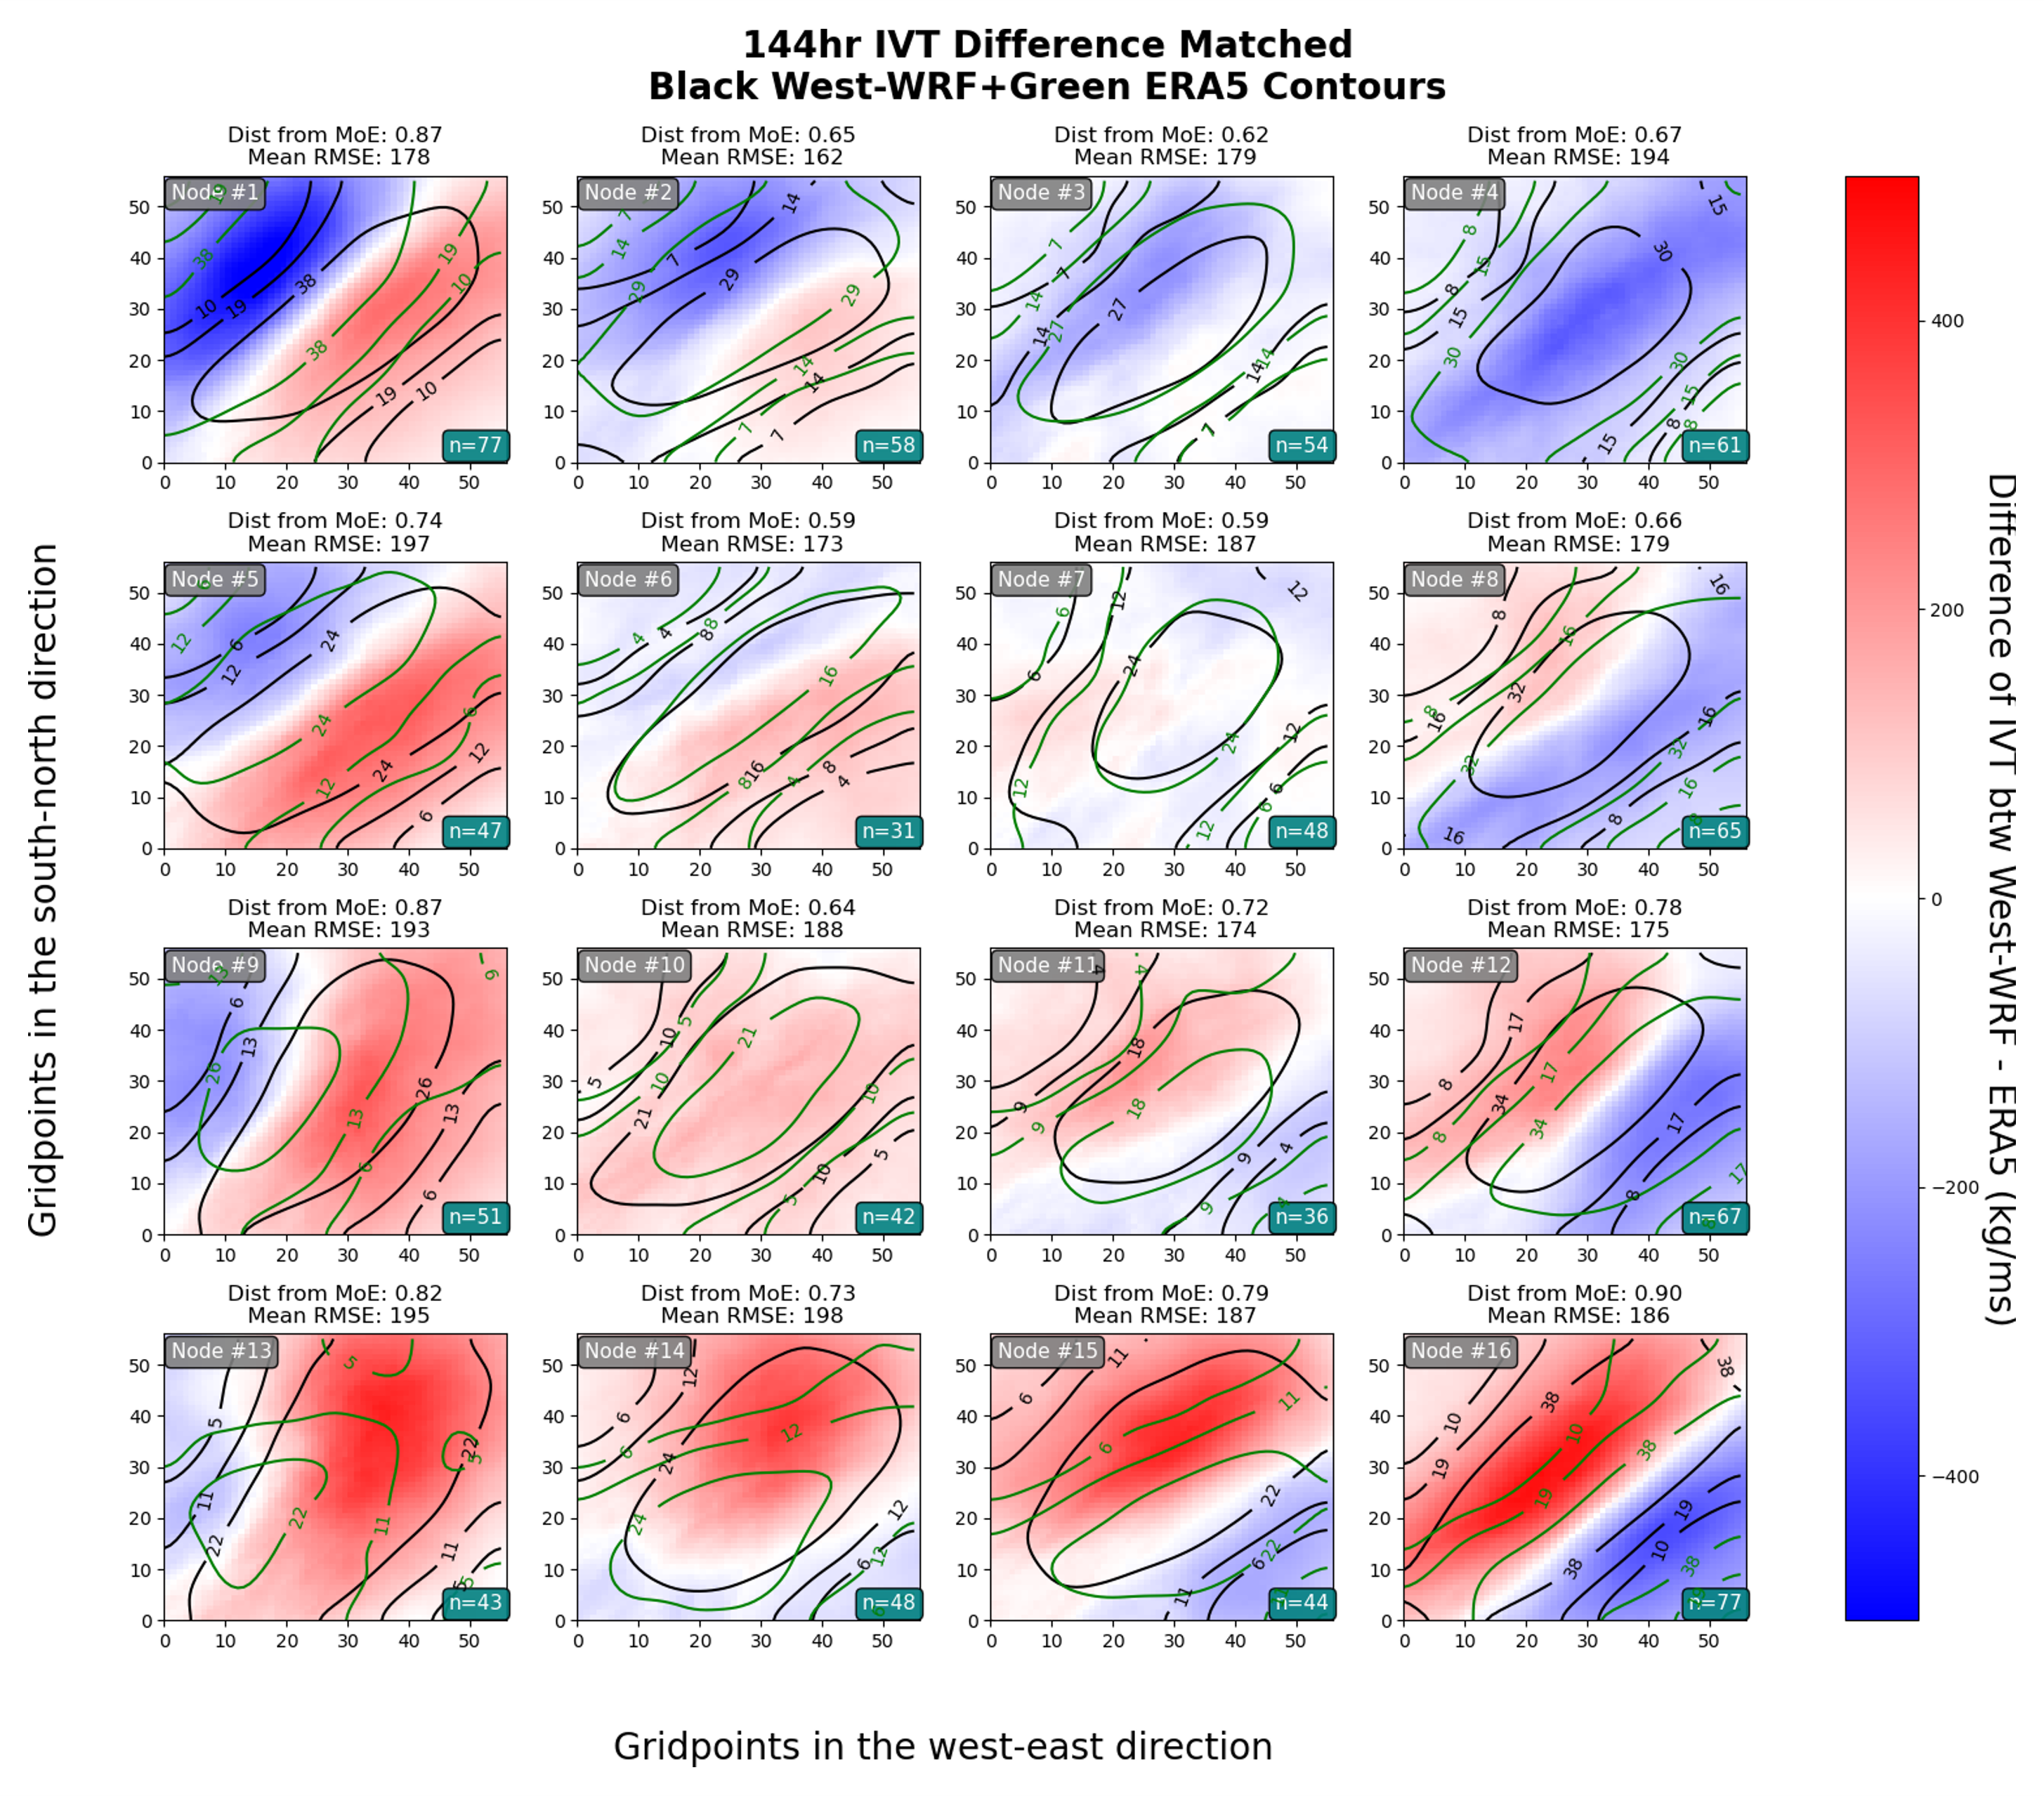
Figure 1. (Easthom et al., 2025): SOM trained on the matched 144-hour IVT differences (kg/ms) between West-WRF and ERA5 (shaded as in colorbar at right). Contours represent the frequency (i.e., heatmap) of ERA5 AR objects (green) and West-WRF (black). The lower-right inset number depicts the number of cases in each node. Error statistics are listed above each node, and the plot area is an AR-relative 1800 km by 1800 km domain.
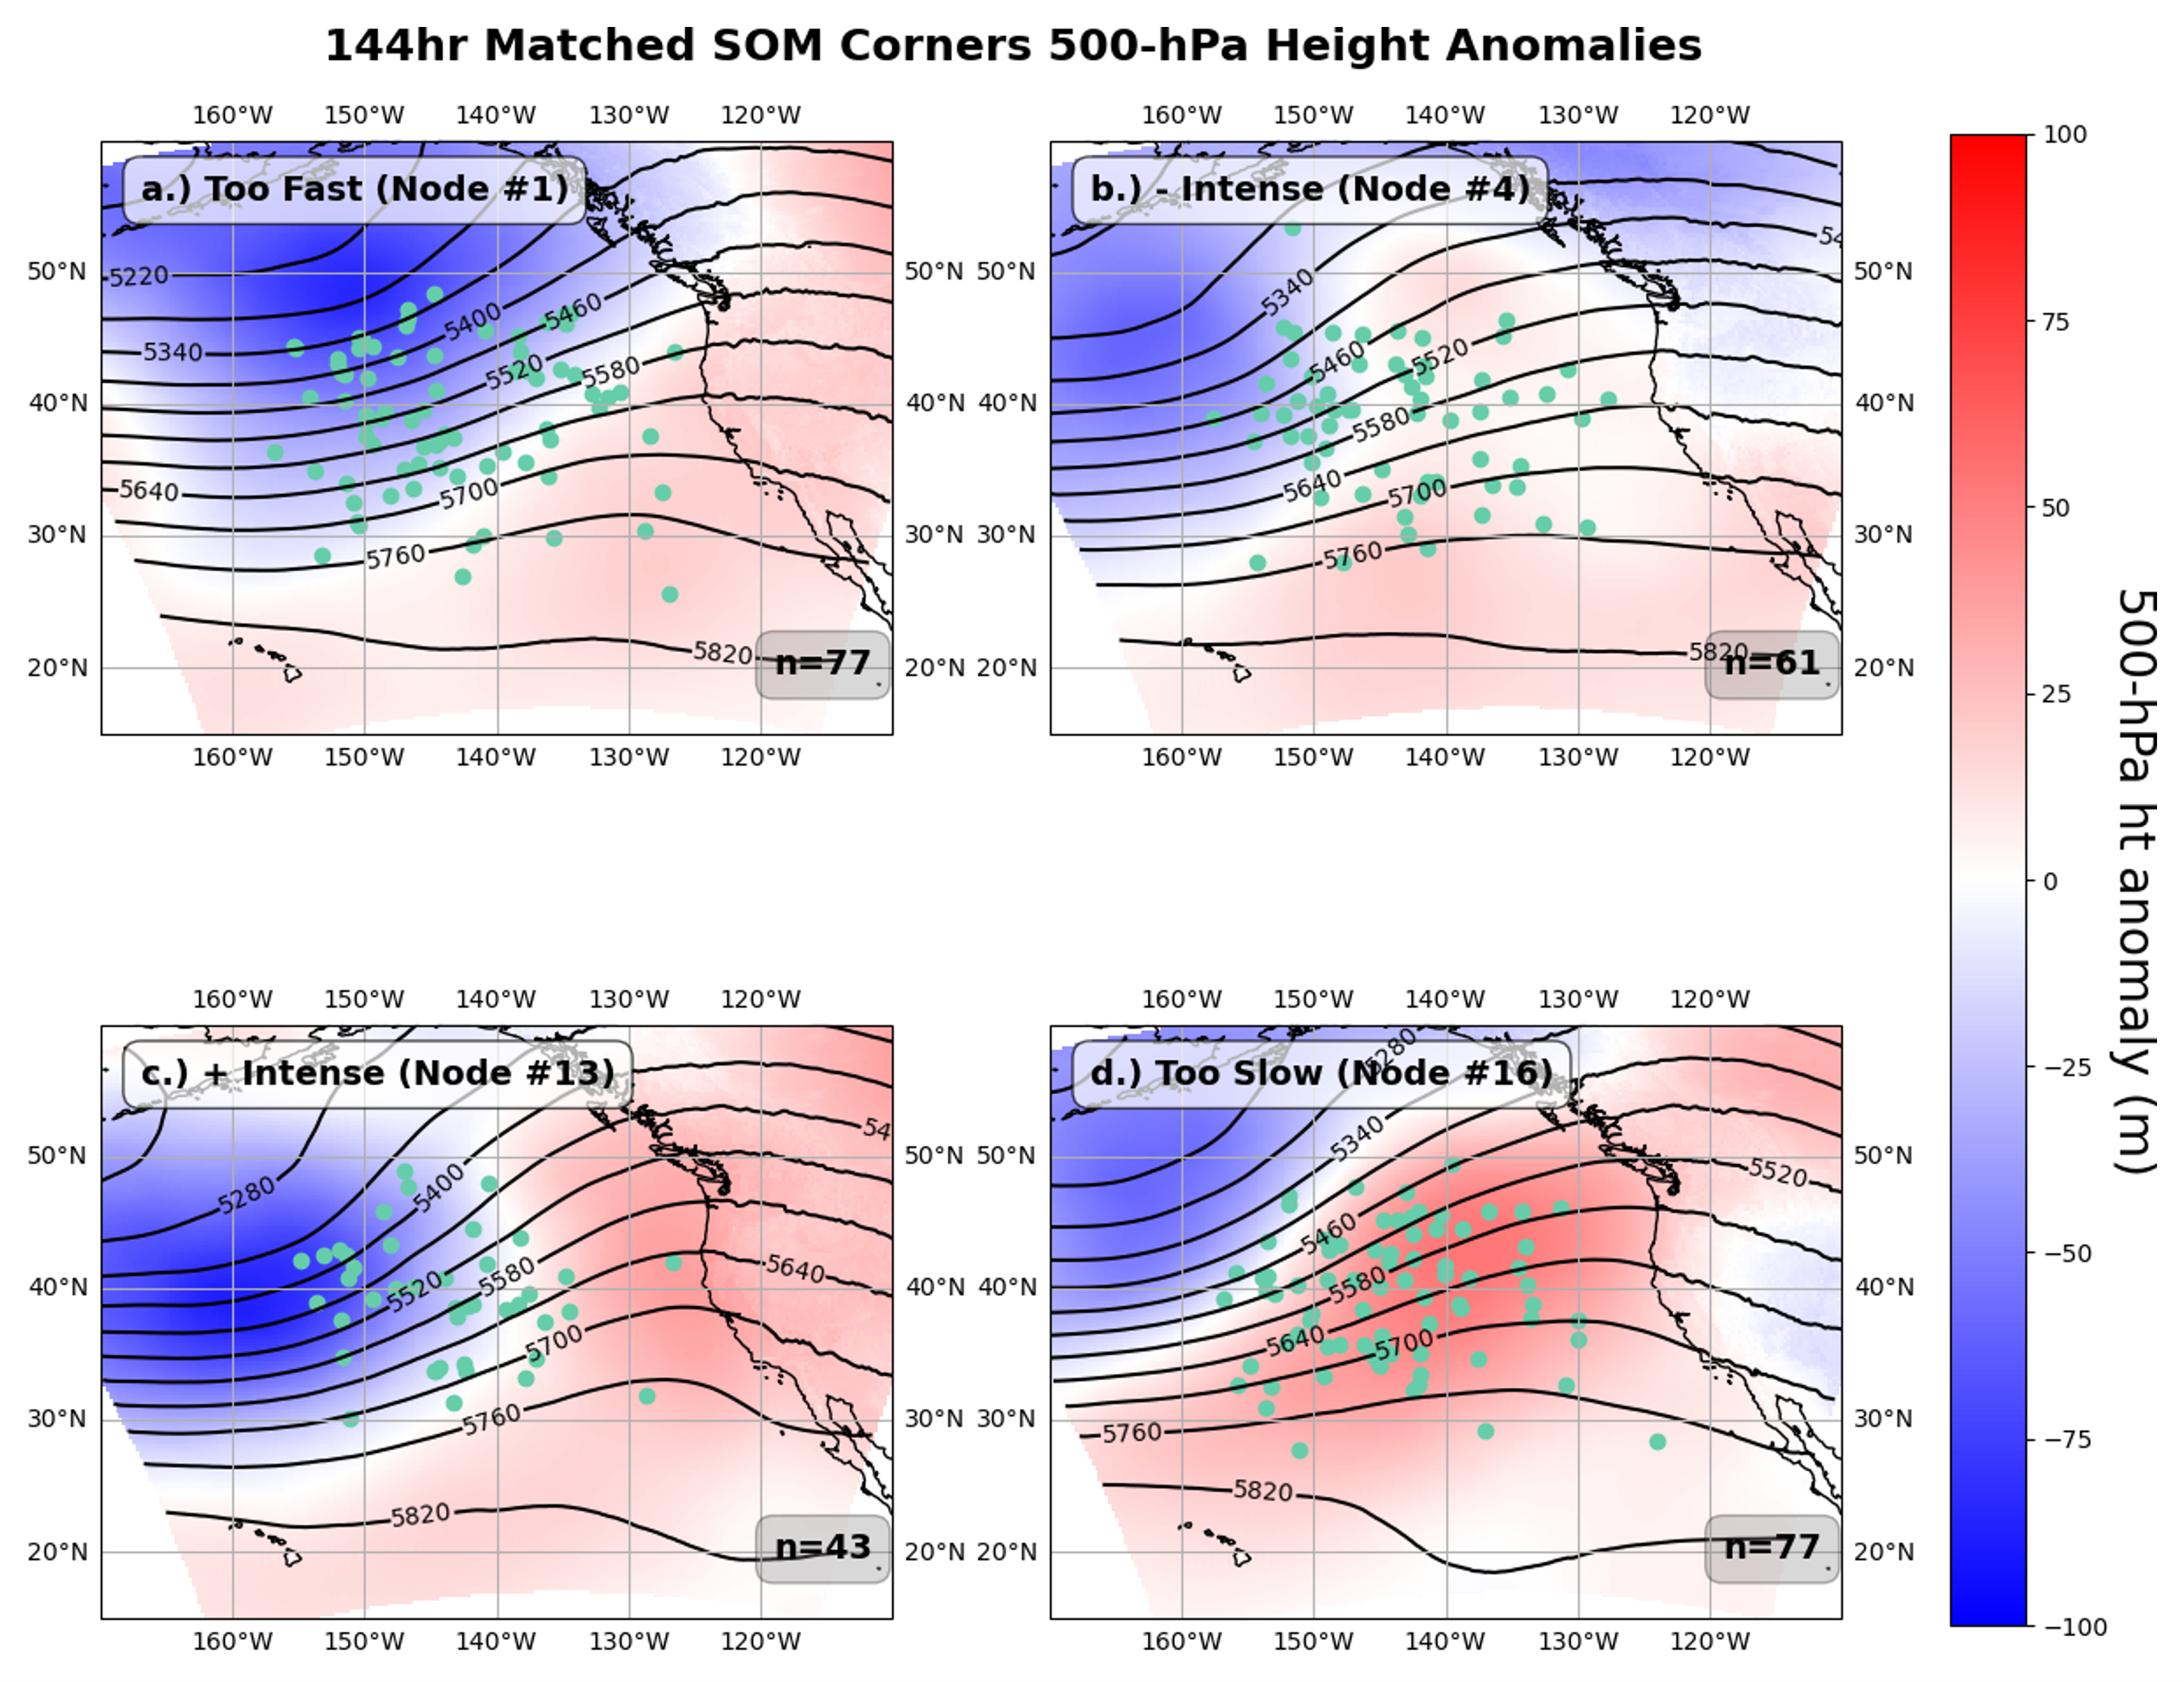
Figure 2. (Easthom et al., 2025): Composite of West-WRF 500-hPa geopotential height anomaly and heights on SOM trained on the matched 144-hour IVT-differences between West-WRF and ERA5, as in Fig. 1. West-WRF 500-hPa geopotential height anomaly composited as shaded in the colorbar (m). The average 500-hPa West-WRF geopotential heights are contoured in black. West-WRF AR centroids plotted in turquoise. The inset number in the lower-right corner of the panels depicts the number of cases in each node. The domain is a geographically fixed grid encompassing approximately 5562 km by 5121 km of the eastern North Pacific and U.S. West Coast.
Easthom, G., Lackmann, G. M., Molina, M. J., DeHaan, L., & Cordeira, J. M. (2025). Analyzing Atmospheric River Reforecasts: Self-Organizing Error Patterns and Synoptic-Scale Settings. Weather and Forecasting (published online ahead of print 2025). https://doi.org/10.1175/WAF-D-24-0160.1