California Precipitation: summary handout
February 8, 2015

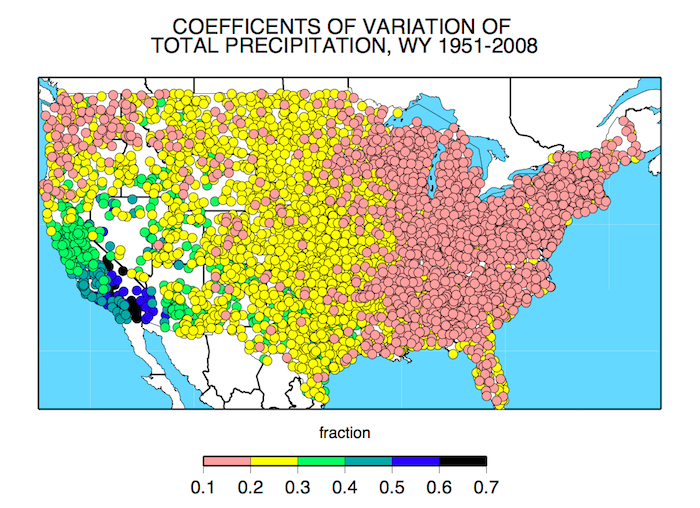
Coefficient of variation (the standard deviation divided by the average) of total precipitation based on water year data from 1951-2008.
CW3E and partners from the California Department of Water Resources, CNAP and the Southwest Climate Science Center have released a summary handout describing California precipitation. The seasonality and variability of precipitation for the state are examined in this summary. Special emphasis is on the link between large storms (AR storms) and the total precipitation for a season. The figure above (Dettinger et al., 2011) illustrates that how much variability there is from year to year in precipitation. The green and blue circles over California indicate the largest year-to-year variability is over this state at an order of about half the annual average precipitation.
