CW3E in the News
August 2, 2019
El Niño has long been known to cause extensive flooding in Southern California, just as its oppositely-phased sister La Niña has been associated with increased precipitation and flooding in the Pacific Northwest, but the economic impacts had not been systematically quantified.
Newly published research by CW3E postdoctoral researcher Tom Corringham and coauthor Dan Cayan measures the damages in the western United States resulting from storms during both phases of the El Niño Southern Oscillation (ENSO), finding that El Niño causes substantially more losses than La Niña in Southern California while the opposite pattern is observed in the Pacific Northwest.
Mike Branom of the Washington Post’s Capital Weather Gang highlights the work with a July 30th article interviewing Dr. Corringham.
In the interview, Corringham describes the importance of the severe West Coast storms known as atmospheric rivers (ARs), especially the most damaging AR4 and AR5s, referring to the recently developed AR scale developed by CW3E researchers and colleagues. Over the 40-year period from 1978 to 2017, just one percent of flood events caused more than two thirds of total losses, and most of these extreme losses were caused by atmospheric rivers.
Corringham also highlights the economic value of ongoing research to improve subseasonal to seasonal (S2S) predictability of extreme weather events. Increased lead time would assist property owners, policymakers, and emergency responders in planning for these high impact events and reducing their toll.
The journal article “The Effect of El Niño on Flood Damages in the Western United States” is available online in the July edition of Weather Climate and Society at https://doi.org/10.1175/WCAS-D-18-0071.1. The Washington Post article can be found at https://wapo.st/2GEccCC.
ENSO Impacts Mean differences in monthly October–March losses per $100,000 of coverage reveal an ENSO dipole. Enhanced losses are colored red and reduced losses are blue, with color intensity on a log scale. Boxed grid cells are significantly different from the overall October–March mean at p < 0.1, by analysis of means. Boxed cells with crosses are significant at p < 0.05. Significantly enhanced losses are observed in Southern California during El Niño months and in the Pacific Northwest during La Niña months.
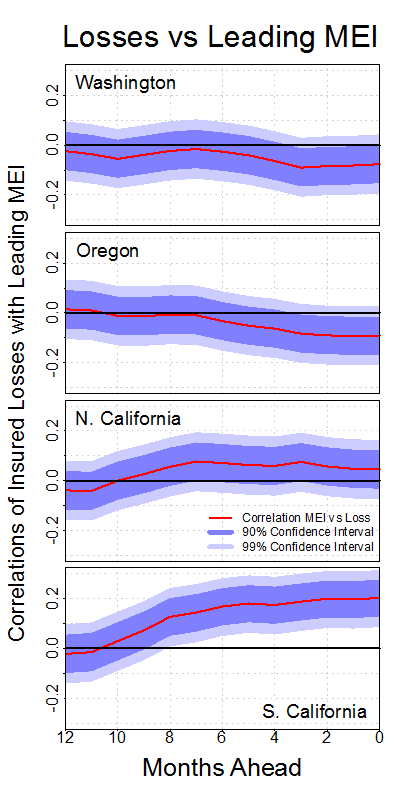
ENSO Predictability Correlations of monthly insured losses by region with leading Multivariate ENSO Index (MEI) indicate the potential predictability of ENSO flood impacts. Significant (p < 0.01) positive correlations are seen in Southern California up to 8 months ahead of time. The signal is positive but not significant in Northern California. Negative and weakly significant (p < 0.1) correlations are seen in Oregon and Washington up to 3 months ahead.


