
CW3E Publication Notice
An Analysis of Cloud Microphysical Features over United Arab Emirates using Multiple Data Sources
May 5, 2025
A new paper entitled “An Analysis of Cloud Microphysical Features over United Arab Emirates Using Multiple Data Sources” was recently published in Atmospheric Measurement Techniques and authored by CW3E researcher Zhenhai Zhang, Vesta Afzali Gorooh, Duncan Axisa, Luca Delle Monache, and collaborators from Colorado State University. This study focused on an in-depth analysis of cloud microphysical features associated with precipitation forming over the United Arab Emirates (UAE) using multiple data sources, such as aircraft measurements, satellite observations, weather radar observations, and reanalysis data. This study is part of the UAE Research Program for Rain Enhancement Science (UAEREP) Fourth Cycle Program titled “Artificial Intelligence – Research And Operations (AI-RAO): A Hybrid Machine Learning Framework to Combine Satellite and Radar Observations for Enhanced Precipitation Nowcasting”, led by the CW3E Research Director, Dr. Luca Delle Monache.
Water is a precious resource for human health, agriculture, industry, and the environment. When water is in short supply, monitoring and predicting the current and future occurrence of precipitating clouds becomes essential. In this study, we first investigated the cloud microphysical features and background atmospheric conditions of several convective cloud systems in the UAE. The cloud cases were identified by analyzing cloud spectrometers mounted on the aircraft from the UAE 2019 Airborne Research Campaign. Using detailed aircraft observation data, we examined the microphysical features of these cloud cases, focusing on precipitation-forming processes. Figure 1 provides an example of these cases using aircraft observations. Based on that, a new 5-zone framework was developed to identify the cloud microphysical zones, including (1) diffusional droplet growth zone, (2) droplet coalescence growth zone, (3) supercooled water zone, (4) mixed phase zone, and (5) glaciated zone (Figure 2). These zones can be used to describe the precipitation-forming microphysical processes and assess rainfall enhancement potential.
We used those aircraft measurements to evaluate the corresponding near-real-time high spatiotemporal resolution infrared data from the Spinning Enhanced Visible and Infrared Imager (SEVIRI) sensor and the upper layer cloud effective radius (ER) and cloud phase retrievals from the Optimal Cloud Analysis (OCA) algorithm. Our results indicate that the ER retrieved from satellite data is in fair agreement with the ER measured by aircraft, increasing confidence in using retrieved ER data from satellites to analyze cloud microphysical features. Figure 3 illustrates an example of a cloud case in the UAE using satellite data: from some identified cloud patches (different colors in Fig.3a), the selected cloud patch highlighted in a red circle (Fig.3b) is analyzed to detect the zones for total cloud, ice cloud, and water cloud (Fig.3c-e) following the flowchart in Figure 2. These results can guide the operational cloud seeding efforts, including hygroscopic and glaciogenic seeding.
This study provides scientific support for developing an applicable framework to examine cloud precipitation processes and identify suitable cloud features that could be tracked for further precipitation analysis and nowcasting in the UAE. With appropriate adjustments to account for regional differences in cloud microphysical features, this framework can be adapted for use in other regions globally.
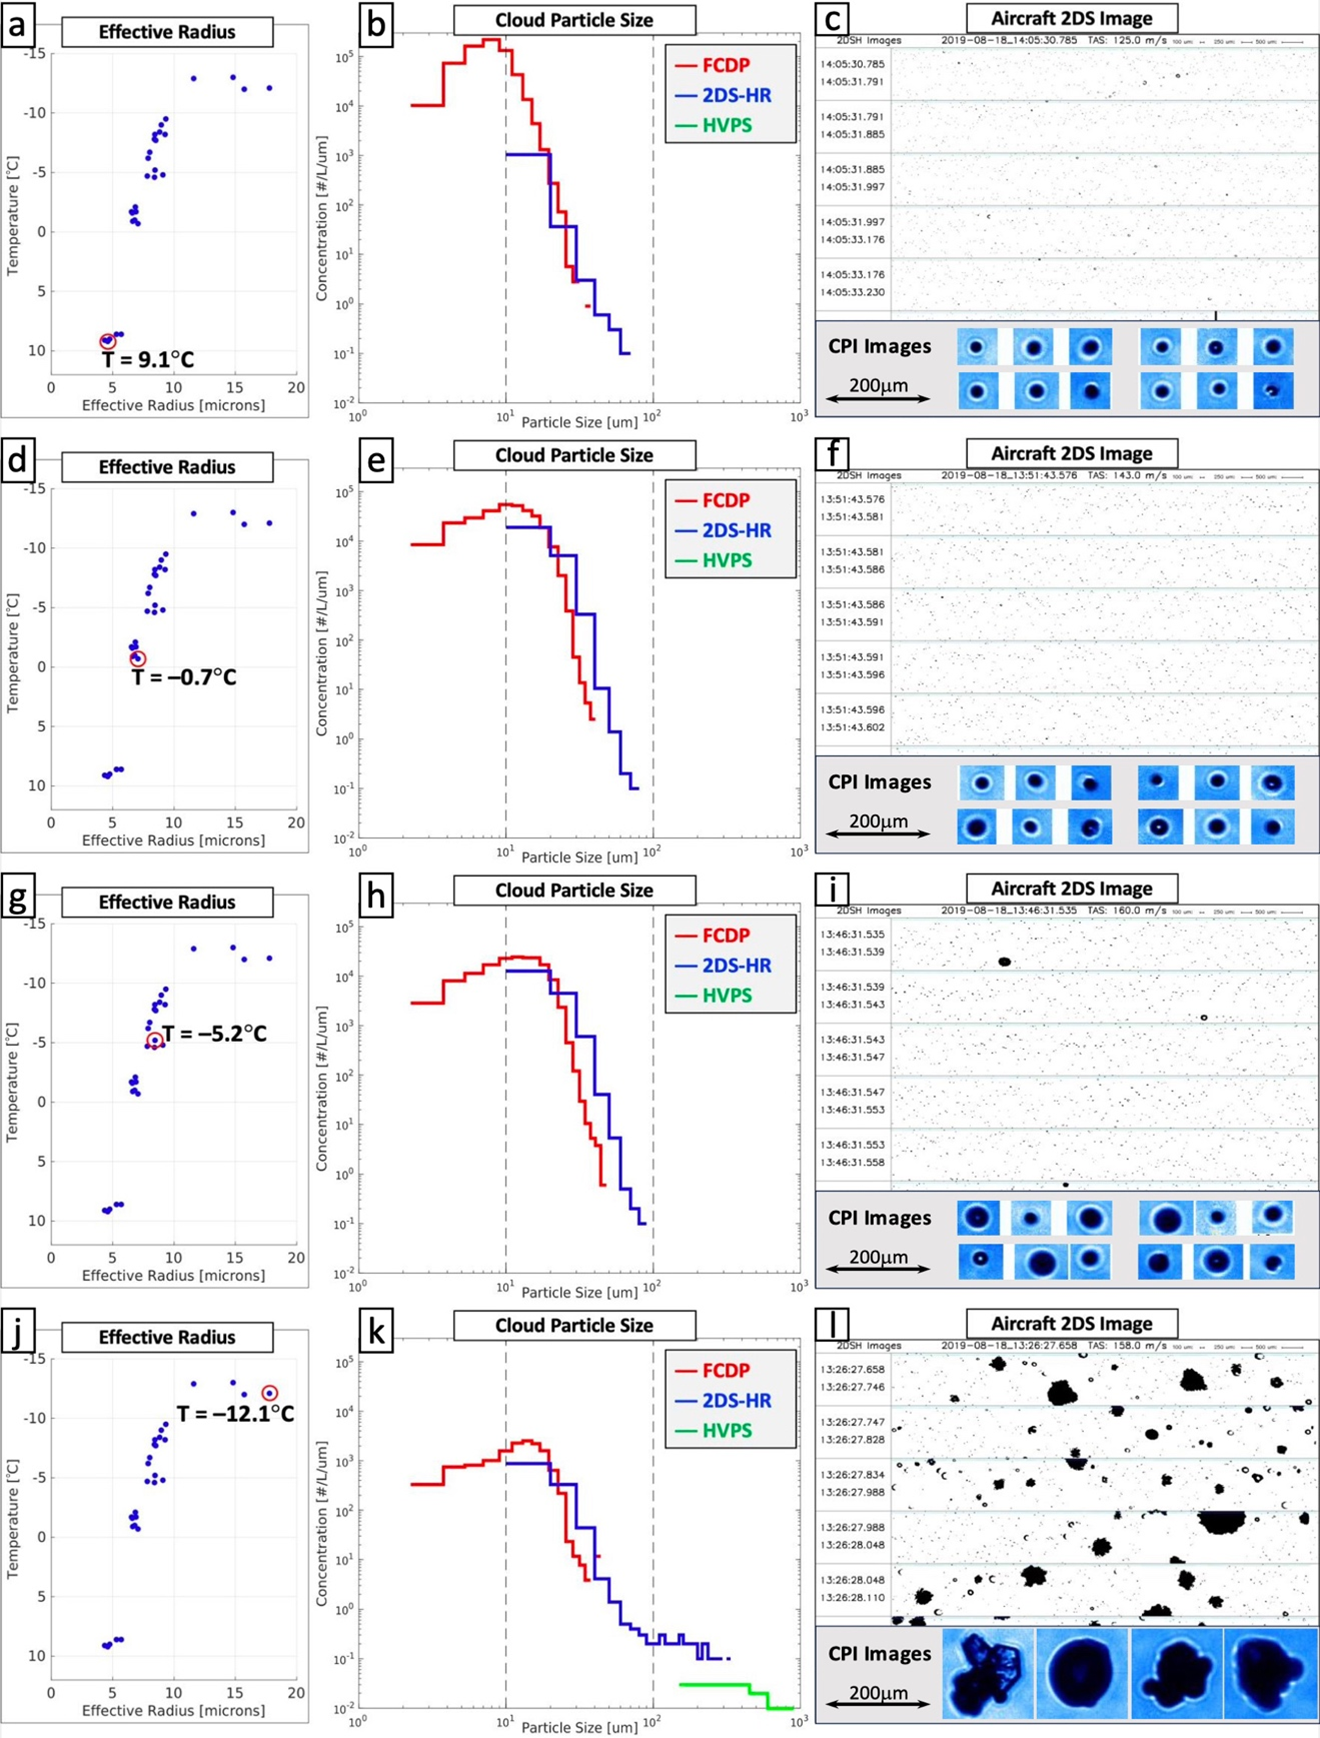
Figure 1. The first row is for the cloud penetration at 9.1°C: (a) the effective radius of each cloud penetration from SF03 and the penetrations at 9.1°C is highlighted in a red circle; (b) the distribution of cloud particle size; (c) 2DS images (top) and CPI images (bottom). (d-f), (g-i), and (j-l) are the same as (a-c) but for cloud penetrations with temperatures of -0.7°C, -5.2°C, and -12.1°C, respectively. (Figure 6 in Zhang et al., 2025)
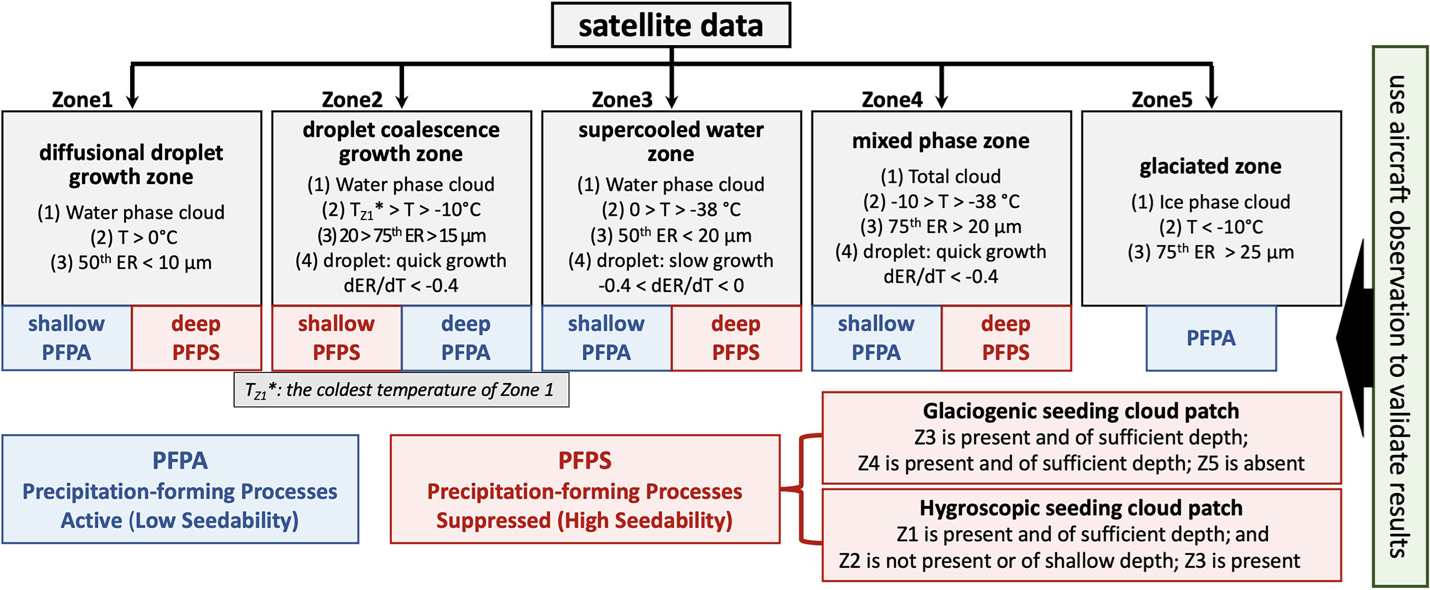
Figure 2. The flowchart of the 5-zone framework, including (1) the diffusional droplet growth zone, (2) the droplet coalescence growth zone, (3) the supercooled water zone, (4) the mixed phase zone, and (5) the glaciated zone. The blue box indicates precipitation-forming processes active (PFPA), and the red box indicates precipitation-forming processes suppressed (PFPS). (Figure 8 in Zhang et al., 2025)
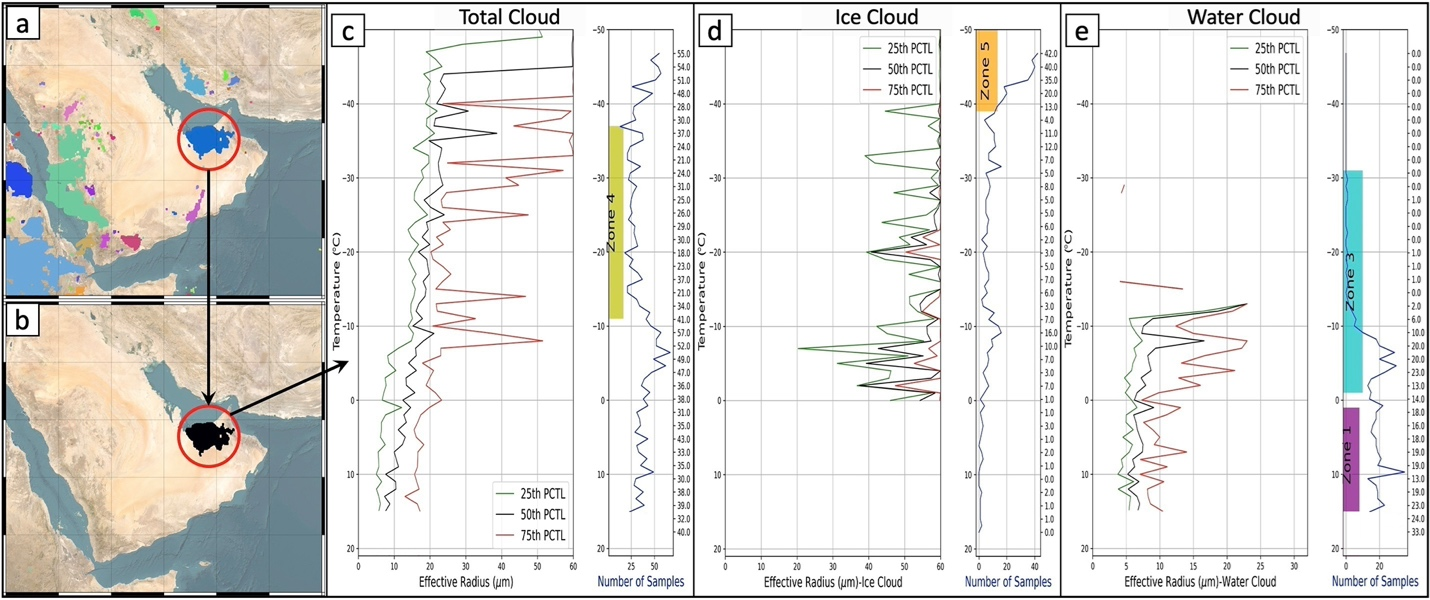
Figure 3. (a) Examples of cloud patches (colors) detected from satellite data. (b) The selected cloud patch for the analysis of effective radius. (c) The effective radius from satellite data for total cloud (left) and the number of data samples (right); the vertical yellow bar represents identified Zone 4, mixed phase zone. (d) is the same as (c) but for the ice cloud and the vertical orange bar represents identified Zone 5, glaciated zone. (e) is the same as (c) but for the water cloud and the vertical purple and cyan bars represent identified Zone 1 (diffusional growth zone) and Zone 3 (supercooled water zone), respectively. (Figure 9 in Zhang et al., 2025)
Zhang, Z., Afzali Gorooh, V., Axisa, D., Radhakrishnan, C., Kim, E. Y., Chandrasekar, V., & Delle Monache, L. (2025). An analysis of cloud microphysical features over United Arab Emirates using multiple data sources. Atmospheric Measurement Techniques, 18(8), 1981-2003. https://doi.org/10.5194/amt-18-1981-2025.