CW3E Publication Notice
Influence of the freezing level on atmospheric rivers in High Mountain Asia: WRF case studies of orographic precipitation extremes
September 8, 2023
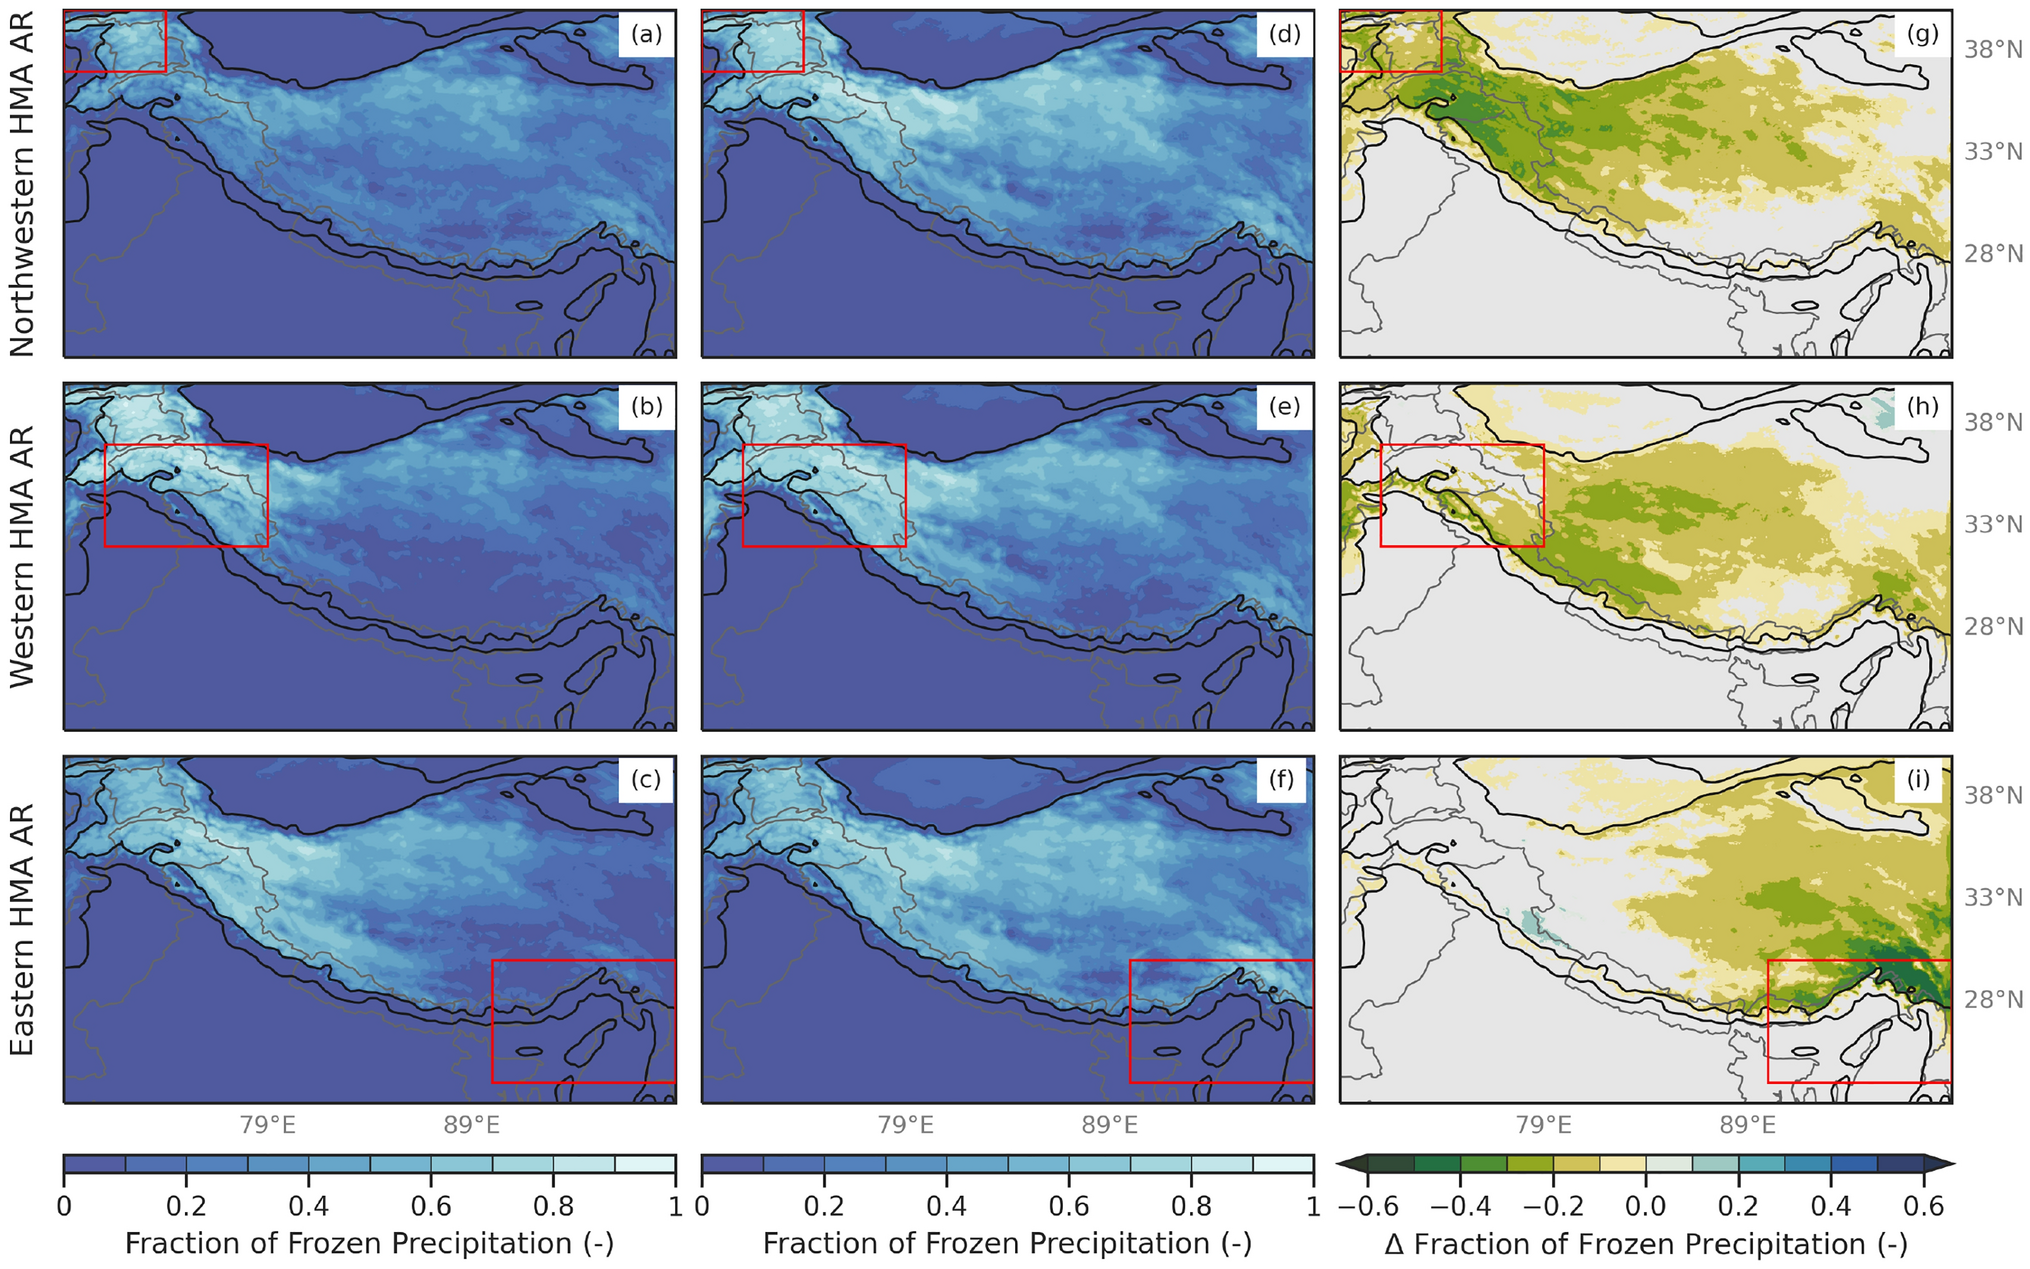
A new paper titled, “Influence of the Freezing Level on Atmospheric Rivers in High Mountain Asia: WRF Case Studies of Orographic Precipitation Extremes” by Deanna Nash (CW3E), Leila Carvalho (UC Santa Barbara), Jon Rutz (CW3E), and Charles Jones (UC Santa Barbara) was recently published in Climate Dynamics. This study evaluates changes in integrated water vapor transport (IVT) and the height of the 0°C isotherm (hereafter, freezing level) during wintertime atmospheric rivers (ARs) across High Mountain Asia (HMA) using Climate Forecast System Reanalysis (CFSR) dynamically downscaled to 20-km and 6.7 km horizontal resolution with the Advanced Weather Research and Forecasting (ARW-WRF) model. Results show that from 1979 to 2015, IVT during ARs that reach western HMA has increased 16% while the freezing level has increased up to 35 m. These changes have modified the fraction of frozen precipitation that falls during these storms. Figure 1 shows that ARs with an above-average freezing level produce 10-40% less frozen precipitation than ARs with a below-average freezing level. In light of a warming climate, this points to consequences such as increased frequency of precipitation-triggered landslides and floods in a region of complex topography, impacting water resources, infrastructure, and lives and livelihoods of those that live in that area.
Figure 1: Figure 4 from Nash et al. (2023) (a) WRF 6.7 km fraction of frozen precipitation (shaded; -) for Northwestern HMA ARs above-average freezing level conditions within the red box. (b) Same as (a) but for Western HMA ARs. (c) Same as (a) but for Eastern HMA ARs. (d) WRF 6.7 km fraction of frozen precipitation (shaded; -) for Northwestern HMA ARs below-average freezing level conditions within the red box. (e) Same as (d) but for Western HMA ARs. (f) Same as (d) but for Eastern HMA ARs. (g) Composite differences of WRF 6.7 km fraction of frozen precipitation (shaded; -) for Northwestern HMA ARs above-average freezing level conditions and below-average freezing level conditions within the red box. Only differences (above-average conditions minus below-average conditions) in the fraction of frozen precipitation that are considered at or above the 95% confidence level are shaded. (h) Same as (g) but for Western HMA ARs. (i) Same as (g) but for Eastern HMA ARs.
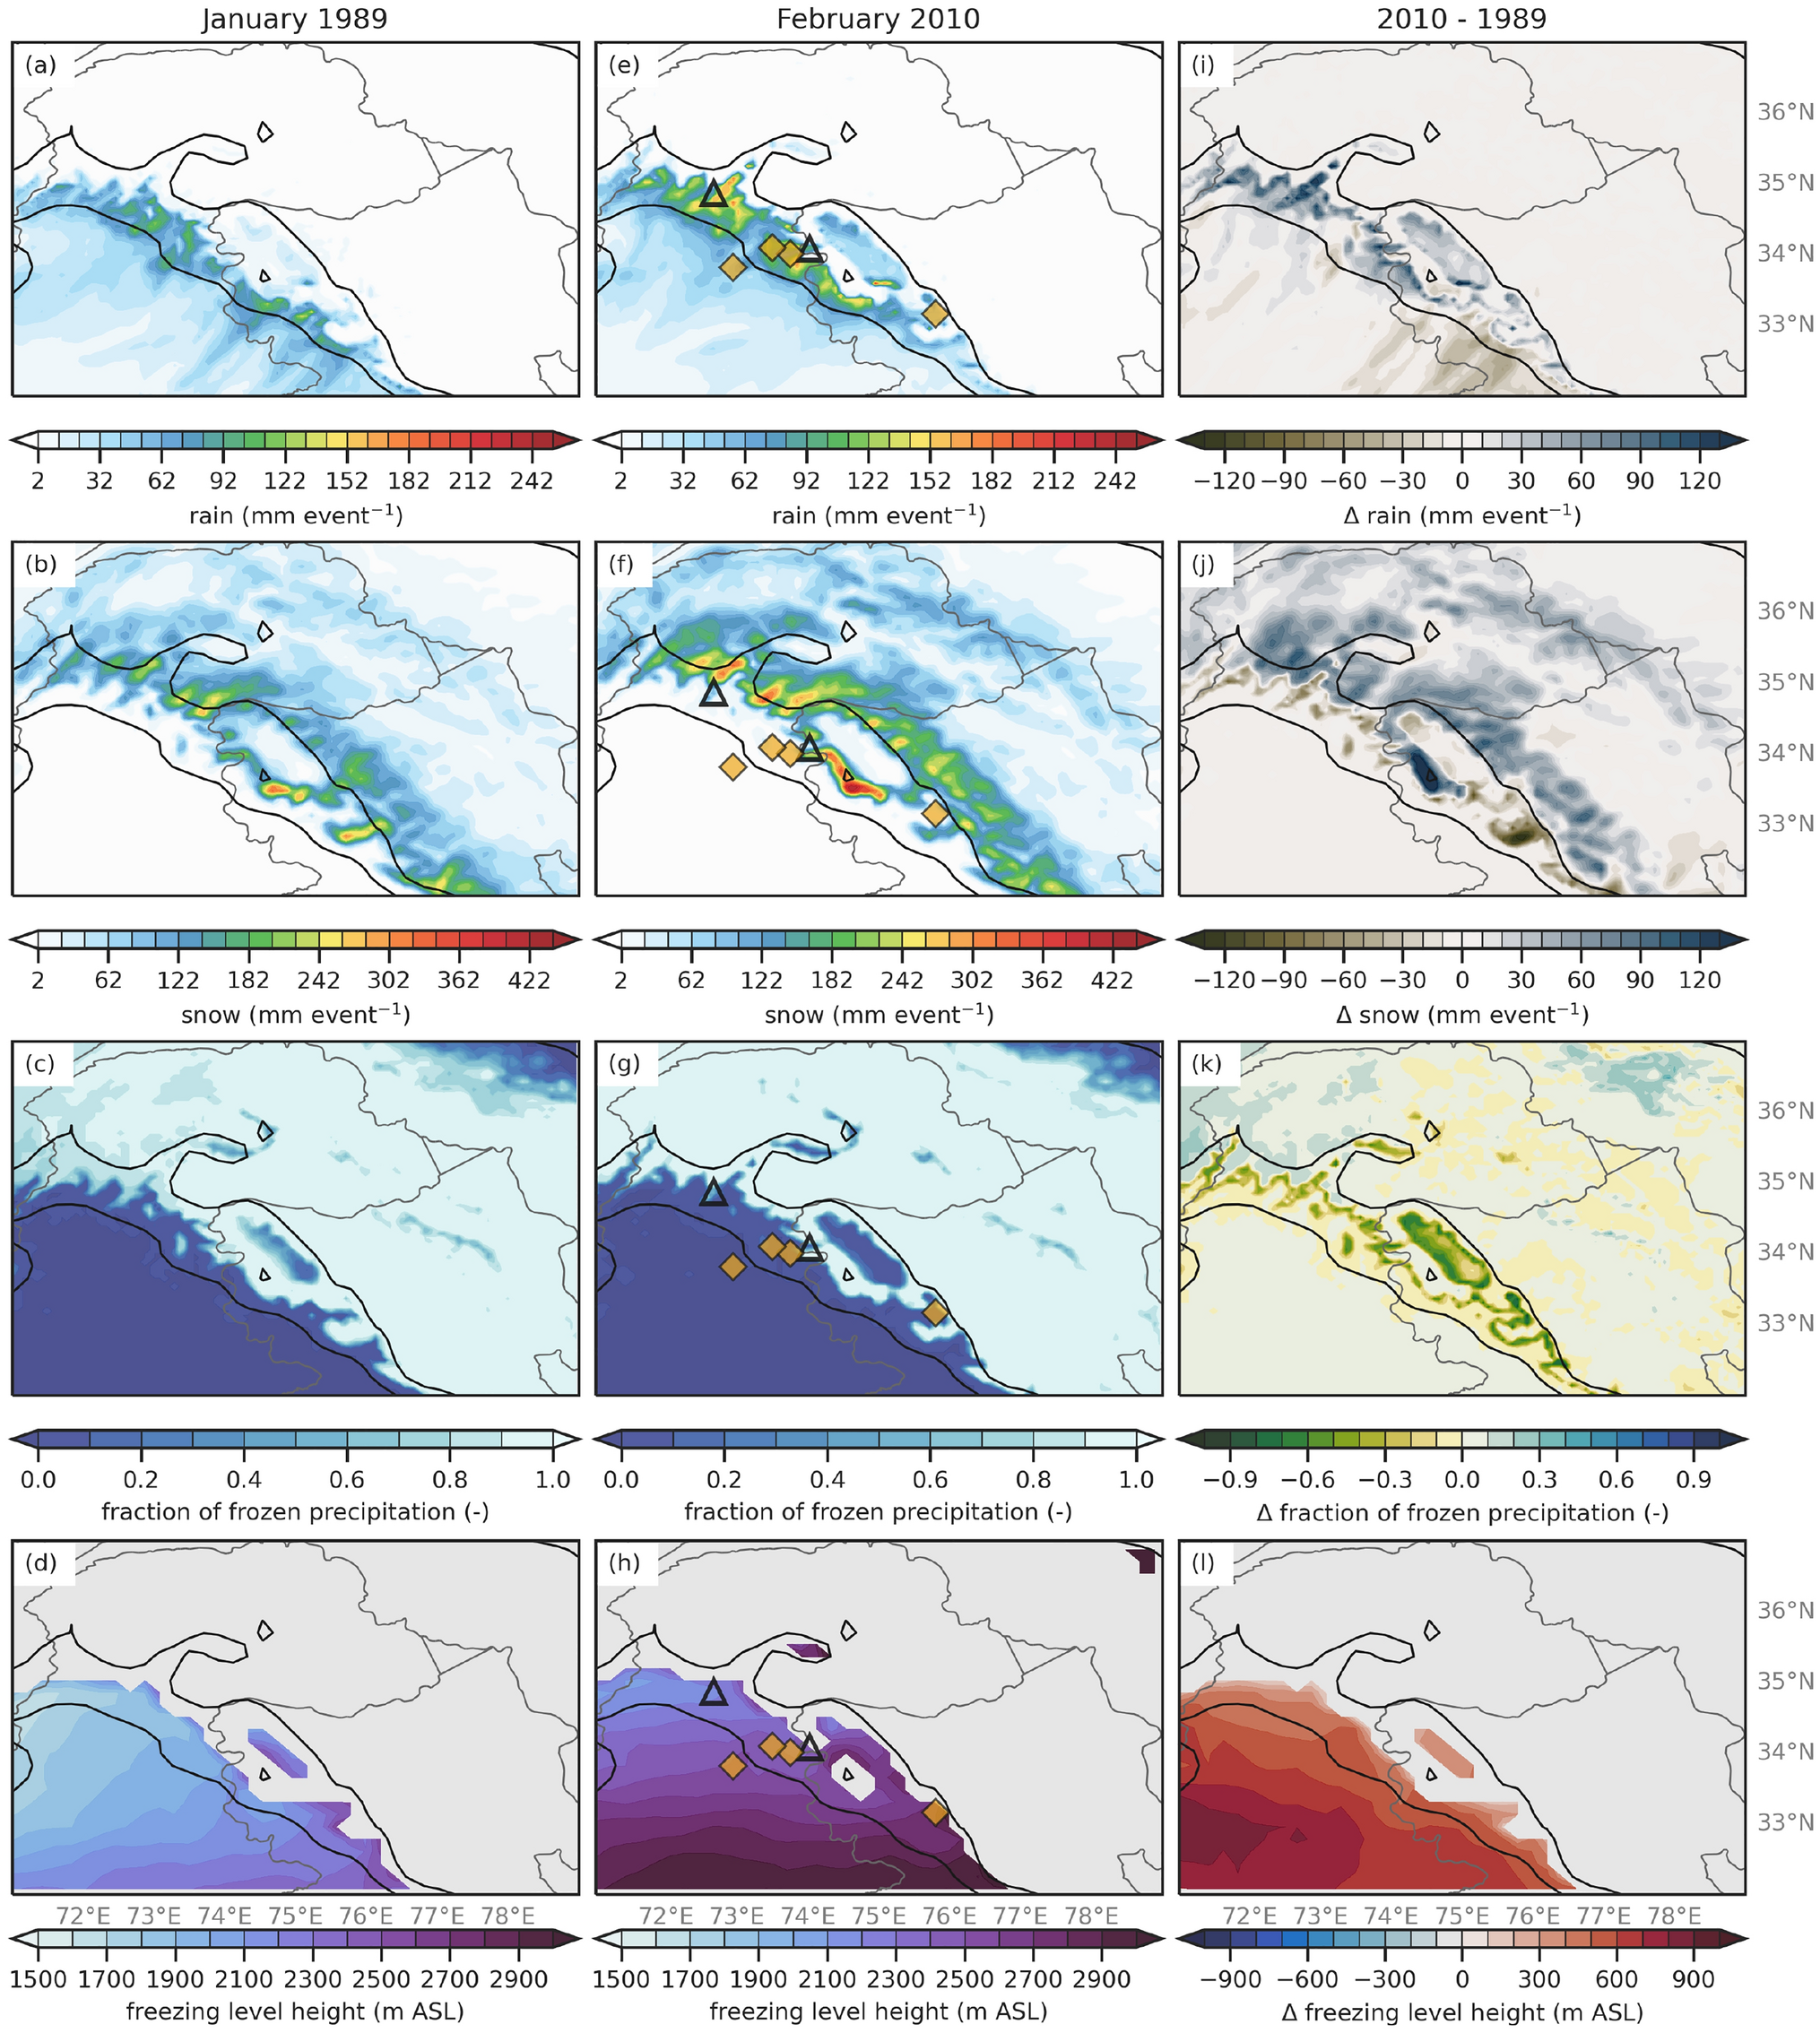
To differentiate the synoptic and mesoscale characteristics of ARs with above-average freezing level from ARs with below-average freezing level, this study compares two ARs with broadly similar characteristics (e.g., high IVT, low-level southwesterly flow, and dynamic support by an upper-level trough) that both resulted in extreme precipitation, but strikingly different impacts. The key difference between these two events is that one featured an above-average freezing level (January 1989), while the other featured a below-average freezing level and 12-h longer duration (February 2010). The longer duration is likely why the February 2010 AR case resulted in higher amounts of precipitation overall. Perhaps more notably, between 1-3 km (i.e., where changes in the freezing level are more likely to influence the fraction of frozen precipitation), the February 2010 AR had more rain and less snow than the January 1989 AR (Figure 2i, j). Although freezing levels were only 50-600 m higher during the 2010 AR, this event resulted in 10-70% less frozen precipitation than the 1989 AR (Figure 2k, l).
Overall, the examples of below- and above-average freezing level ARs presented here demonstrate the importance of mesoscale processes in orographic precipitation and highlight the varying outcomes that can result across HMA from relatively small differences in freezing level height. This study intersects with extensive CW3E research focused on a better understanding of precipitation extremes, precipitation type (the fraction of which is liquid vs. frozen within a watershed being sometimes greatly modified by relatively small changes in freezing level), and implications for water resources in an area of complex topography: California. Even as these efforts expand to other U.S. states, this study highlights the increasingly global reach of CW3E research and applications. This work is associated with two of five major priorities outlined in CW3E’s Strategic Plan: “Atmospheric Rivers Research and Applications” and “Monitoring and Projections of Climate Variability and Change.” This work addresses those priorities by furthering the understanding of AR dynamics and providing insights on historical extreme AR events.
Figure 2: Figure 6 from Nash et al. (2023) (a) Total event WRF 6.7 km rain (shaded; mm event−1) for the January 1989 AR. The black contours are the location of 1- and 3-km elevation. (b) Total event WRF 6.7 km snow (shaded; mm event−1) for the January 1989 AR. (c) Average event WRF 6.7 km fraction of frozen precipitation (shaded; -) for the January 1989 AR. (d) Average WRF 20 km freezing level (shaded; m ASL) for the January 1989 AR. (e–h) Same as (a–d) but for the February 2010 AR. The yellow diamonds and black triangles indicate the location of a precipitation-triggered landslides during the 2010 AR event, the triangles are the same points in Figs. 1b and 9e,f. (i) The difference in rain (shaded; mm event−1) for the February 2010 AR minus the January 1989 AR. (j) Same as (i) but for snow (shaded; mm event−1). (k) Same as (i) but for the fraction of frozen precipitation (shaded; -). (l) Same as (i) but for the freezing level (shaded; m ASL). The black triangles indicate the points of two of the six landslides triggered during this event and are also shown in Figs. 1b and 6e–h.
Nash, D., Carvalho, L.M.V., Rutz, J.J., and Jones, C. Influence of the freezing level on atmospheric rivers in High Mountain Asia: WRF case studies of orographic precipitation extremes. Climate Dynamics (2023) https://doi.org/10.1007/s00382-023-06929-x


