
CW3E Publication Notice
Subseasonal Potential Predictability of Horizontal Water Vapor Transport and Precipitation Extremes in the North Pacific
April 17, 2024
A new paper entitled “Subseasonal Potential Predictability of Horizontal Water Vapor Transport and Precipitation Extremes in the North Pacific” was recently published in Weather and Forecasting by CU Boulder PhD Candidate Tim Higgins, Aneesh Subramanian (CU Boulder), Will Chapman (NCAR), David Lavers (ECMWF), and Andrew Winters (CU Boulder). This work This work contributes to the Subseasonal to Seasonal Prediction of Extreme Weather priority area in CW3E’s 2019-2024 Strategic Plan by exploring differences between the predictability of integrated vapor transport (IVT) and precipitation at lead times of 3 weeks and 4 weeks. The results demonstrated that extreme IVT events (exceeding the 90th percentile) have higher predictability in the subseasonal range than extreme precipitation events do. The connection between the differences in predictability to the predictability of the North Pacific Jet, which was shown to have some forecast skill out to a lead time of four weeks in Winters (2021), was also examined.
This work used the “potential predictability” approach, which has also been used to demonstrate differences between the predictability of IVT and precipitation at medium-range lead times (Lavers et al. 2016). When assessing potential predictability, a single member from an ensemble forecast functions as the “model-observation” and the remaining ensemble members function as the forecast. The process is repeated until every ensemble member functions as the “model-observation” one time. This method operates under the assumption of a perfect model, which allows the authors to assess predictability rather than prediction skill and eliminates any potential model bias.
The study primarily focused on predictability in a region off the US West Coast that was defined as the “jet exit region”. This region has some forecast skill out to week 4 of both IVT and precipitation, is relevant to anomalously high precipitation on the coast, and is greatly impacted by regimes of the North Pacific Jet. When both IVT and precipitation were skillfully forecasted, the strength of the jet extension regime was greater than it was when IVT and precipitation were not skillfully forecasted (Figure 1). The connection between the strength of the jet extension regime and 90th percentile IVT was also stronger than the correlation between the jet extension regime and 90th percentile precipitation.
IVT in the jet exit region maintained higher skill than precipitation did at all lead times from week 1 to week 4 (Figure 2). The differences were significant at all lead times when skill was assessed at each individual grid point. When conditions were averaged over the jet exit region before assessing skill to account for local variability, the skill gap decreased, with differences generally remaining significant at subseasonal lead times and no longer being significant at medium-range lead times. The relationship between IVT and a teleconnection (North Pacific Jet regimes) that has some forecast skill in the subseasonal range is a likely cause of differences in predictability.
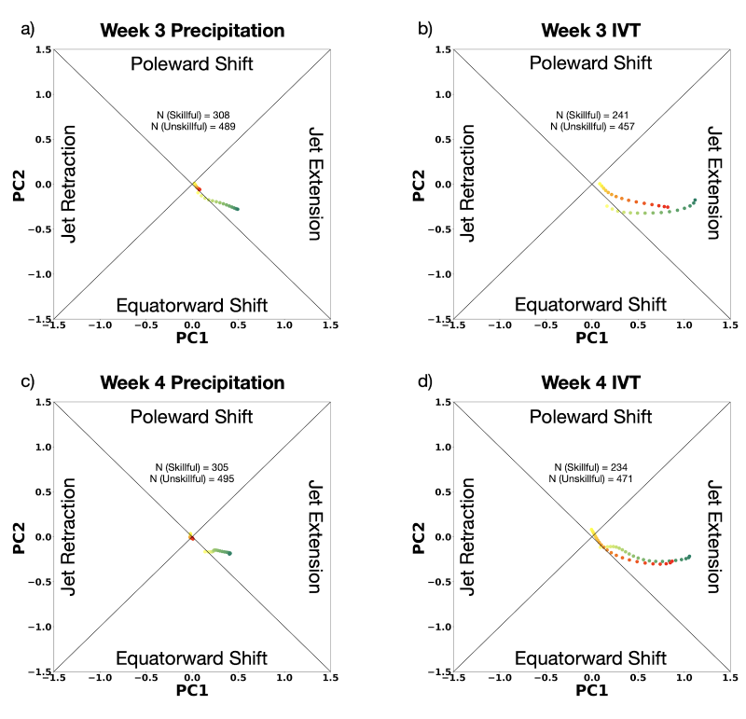
Figure 1. (Fig. 5 from Higgins et al., 2024): Composites of Principal Component Analysis values of the model-observed NPJ during model-observed (a) 90th percentile precipitation at week 3, (b) 90th percentile IVT at week 3, (c) 90th percentile precipitation at week 4, and (d) 90th percentile IVT at week 4 during skillful (green) and unskillful (red) forecasts. Lighter colors represent earlier lead times and become darker through the progression of the forecasts. Forecasts of wet weeks within all individual points from 31.5°N – 40°N, 139.5°W – 152.5°W were used. Each data point represents a mean of lead times spanning 7 days starting at days 1-7. N (Above) and N (Below) represent the number of unique initialization times in which model-observed 90th percentile conditions existed during skillful and unskillful forecasts, respectively.
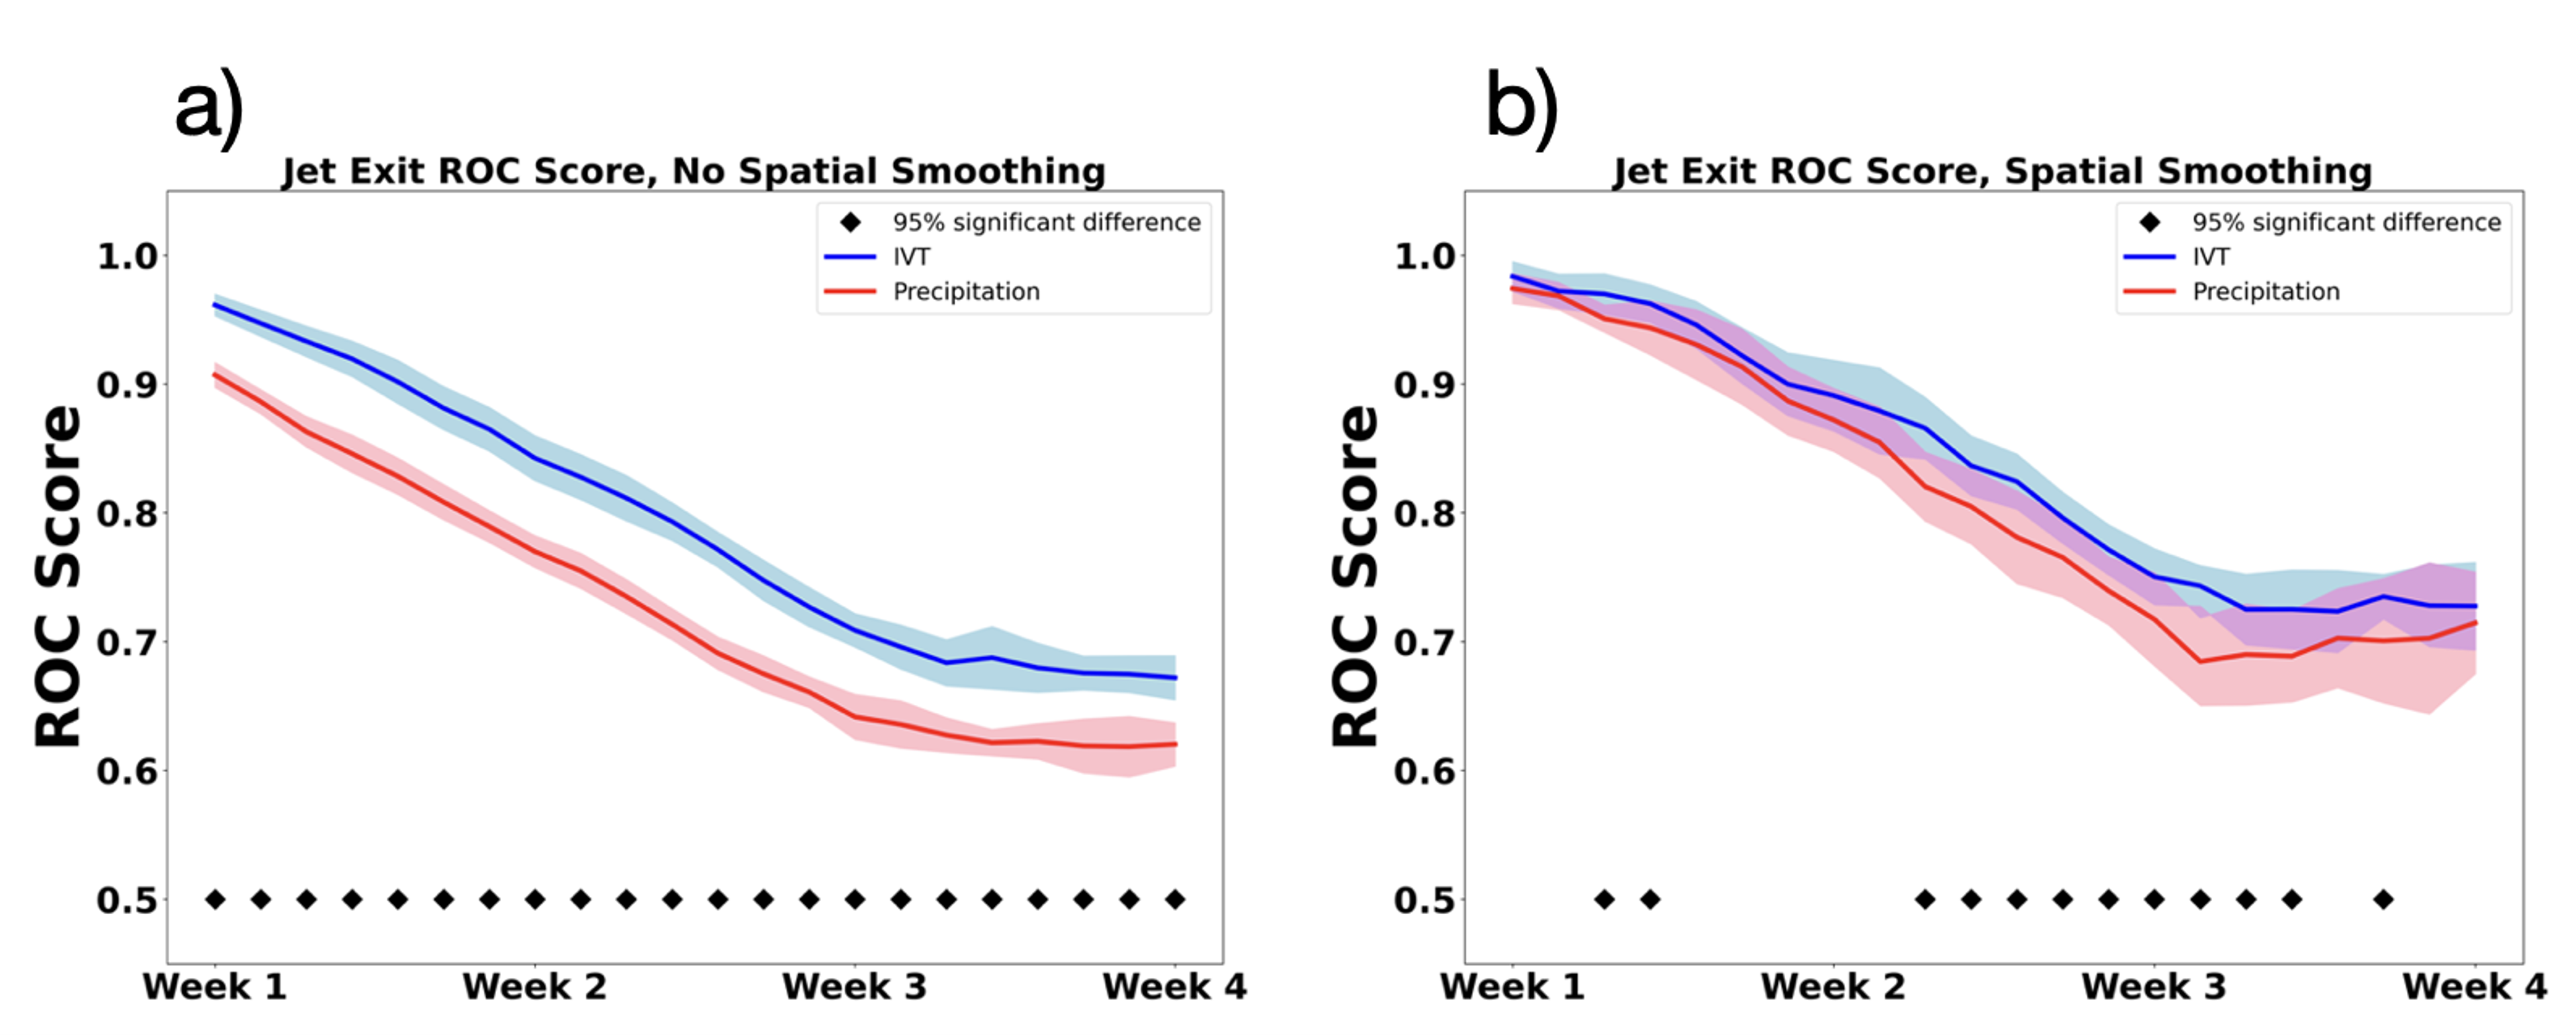
Figure 2. (Fig. 4 from Higgins et al., 2024): Mean ROC scores of precipitation and IVT in the jet exit region at all lead times up to 4 weeks. Spatial averaging was not applied in (a) and was applied in (b). A student t-test was used to assess statistical significance at the 95% level at all lead times. The shaded area represents one standard deviation above and below the mean.
Higgins, T. B., Subramanian, A. C., Chapman, W. E., Lavers, D. A., & Winters, A. C. (2024). Subseasonal Potential Predictability of Horizontal Water Vapor Transport and Precipitation Extremes in the North Pacific. Weather and Forecasting, https://doi.org/10.1175/WAF-D-23-0170.1.
Lavers, D.A., D.E. Waliser, F.M. Ralph and M.D. Dettinger, 2016: Predictability of horizontal water vapor transport relative to precipitation: Enhancing situational awareness for forecasting Western U.S. extreme precipitation and flooding. Geophysical Research Letters, 43, 2275-2282. https://doi.org/10.1002/2016GL067765.
Winters, A. C., 2021: Subseasonal Prediction of the State and Evolution of the North Pacific Jet Stream. Journal of Geophysical Research: Atmospheres, 126 (17), https://doi.org/10.1029/2021JD035094..