CW3E Publication Notice
Using Deep Learning for an Analysis of Atmospheric Rivers in a High-Resolution Large Ensemble Climate Dataset
June 5, 2023
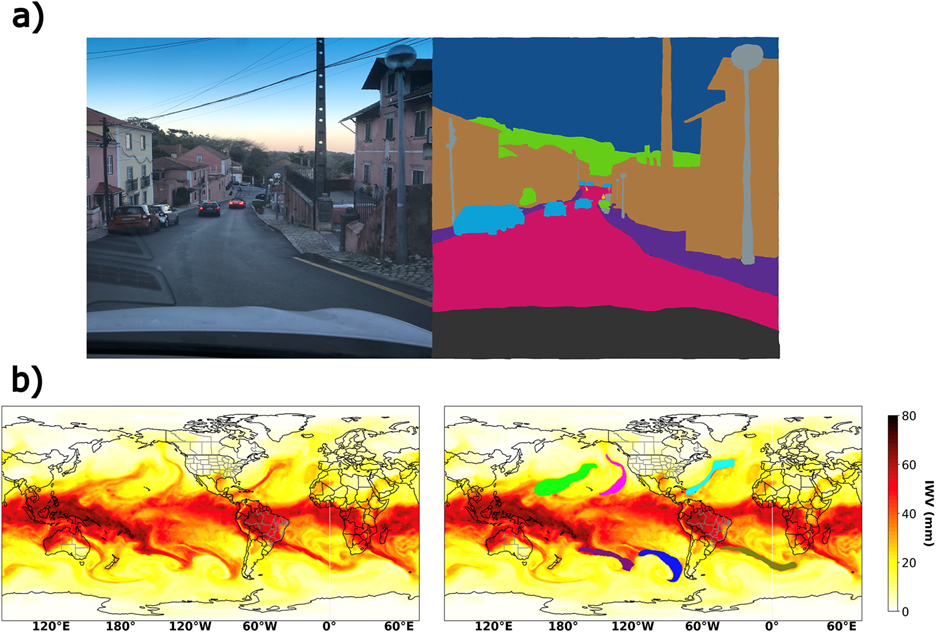
A new paper entitled “Using Deep Learning for an Analysis of Atmospheric Rivers in a High-Resolution Large Ensemble Climate Dataset” was recently published in Journal of Advances in Modeling Earth Systems by CU Boulder PhD Candidate Tim Higgins, Aneesh Subramanian (CU Boulder), Andre Graubner (ETH Zurich), Lukas Kapp-Schwoerer (ETH Zurich), Peter A. G. Watson (University of Bristol), Sarah Sparrow (University of Oxford), Karthik Kashinath (NVIDIA), Sol Kim (UC Berkeley), Luca Delle Monache (CW3E), and Will Chapman (NCAR). In this work, a light-weight convolutional neural network (CNN) that was first introduced in Wu et al. (2019) and named “CGNet”, was applied towards tracking ARs. The same CNN has previously been applied to other purposes including object identification in cityscapes (Figure 3a). This method, which took the name “CG-Climate”, was used to both track ARs in reanalysis data to show consistency with other common methods and to demonstrate the benefits of using it to track ARs in a large-ensemble regional climate dataset.
Human expert hand labels from 80 different weather and climate scientists at labeling campaigns taking place at CW3E, NCAR, UC Berkeley, Lawrence Berkeley National Laboratory, the 2019 ARTMIP workshop, and the 2019 Climate Informatics Workshop were used to create the training dataset, “ClimateNet” (Prabhat et al. 2021). Examples of human hand labels are shown in Figure 3b. The CNN was trained on AR masks as well as IWV, mean sea level pressure, 850 mb zonal wind, and 850 mb meridional wind. While there are already many existing AR tracking methods that work well, this method has some unique benefits in some contexts. It is able to run at an exceptionally fast speed and uses an exceptionally low amount of computational resources. It is also highly flexible with constraints on input data. It does not require IVT, which can be unavailable in some datasets, and it can be run on any regional domain and at any resolution.
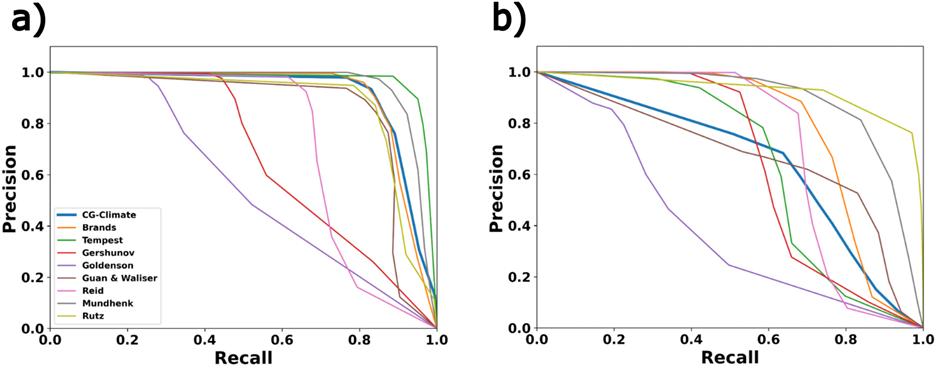
One key characteristic of this method is that ARs detected from it were typically bigger than those detected by more traditional heuristic-based methods. This resulted in inconsistencies between CG-Climate and other methods when evaluating every individual grid point (Figure 8a). This could largely be attributed to labels in the training set that were created by humans being larger than labels that were calculated from other methods. CG-Climate was consistent in finding the same AR events as a variety of other detection methods (Figure 8b).
CG-Climate was run on a large-ensemble and high-resolution climate dataset named “Weather@Home”. A case study was used to extrapolate the time and computational resources that would be required to run it on a common heuristic-based method. CG-Climate used several orders of magnitude less computational memory and almost one order of magnitude less time, which can be a critical constraint when applying an AR tracking method to a large amount of data. ARs that were tracked in Weather@Home under the early-21st century forcing scenario had a similar frequency to those tracked in reanalysis data over the same years.
Figure 1: Figure 3 from Higgins et al. (2023). An example of two different applications of semantic segmentation. (a) A feature-label pair of objects in a cityscape. (b) A feature label pair of ARs in an IWV field. AR contours are shown in purple, blue, green, and pink.
Figure 1: Figure 8 from Higgins et al. (2023). Precision and recall between each detection algorithm and all other ARTMIP algorithms (truth). The thresholds used are the number of algorithms that overlap for any given AR. Precision is defined as the number of true positives divided by the sum of true positives and false positives. Recall is defined as the number of true positives divided by the sum of true positives and false negatives. The area under the curve indicates the level of agreement with the truth. Precision/recall curves are shown for (a) AR events and (b) AR grid points.
Higgins, T. B., Subramanian, A. C., Graubner, A., Kapp‐Schwoerer, L., Watson, P. A. G., Sparrow, S., et al. (2023). Using Deep Learning for an Analysis of Atmospheric Rivers in a High‐Resolution Large Ensemble Climate Data Set. Journal of Advances in Modeling Earth Systems, 15(4), e2022MS003495. https://doi.org/10.1029/2022MS003495
Prabhat, Kashinath, K., Mudigonda, M., Kim, S., Kapp-Schwoerer, L., Graubner, A., et al. (2021). ClimateNet: an expert-labeled open dataset and deep learning architecture for enabling high-precision analyses of extreme weather. Geoscientific Model Development, 14(1), 107–124. https://doi.org/10.5194/gmd-14-107-2021
Xu, B., Wang, N., Chen, T., & Li, M. (2015, November 27). Empirical Evaluation of Rectified Activations in Convolutional Network. arXiv. Retrieved from http://arxiv.org/abs/1505.00853


