CW3E Publication Notice
Characterizing the Influence of Atmospheric River Orientation and Intensity on Precipitation Distributions over North-Coastal California
Spetember 12, 2017
Chad Hecht, a CW3E staff researcher, and Jason Cordeira, a CW3E affiliate and professor at Plymouth State University, recently published an article in AGU Geophysical Research Letters: Hecht, C. W., and J. M. Cordeira, 2017: Characterizing the Influence of Atmospheric River Orientation and Intensity on Precipitation Distribution over North-Coastal California. Geophys. Res. Lett., 44, doi:10.1002/2017GL074179. click here for personal use pdf file.
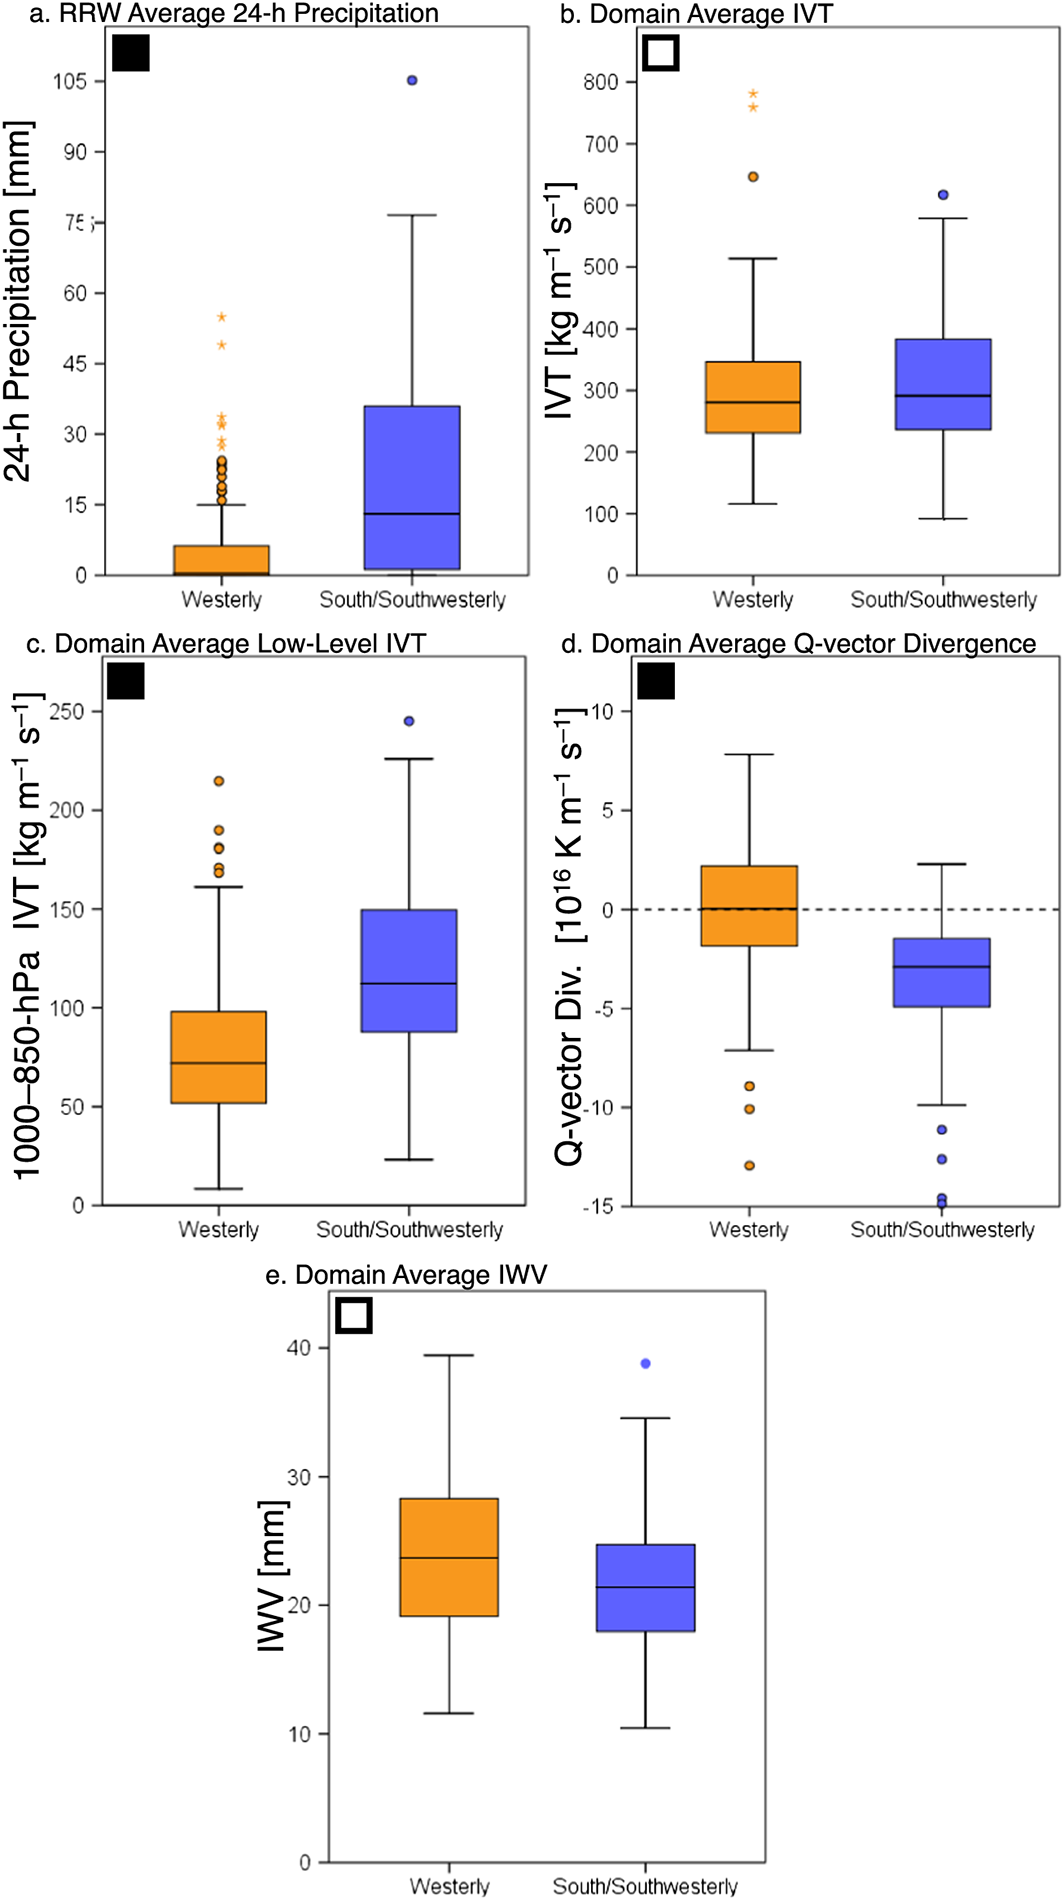
The key result of the study found that south-southwesterly oriented atmospheric rivers (ARs) produce significantly more Russian River watershed areal-average precipitation compared to westerly ARs (median areal-precipitation of 13 mm vs. .5 mm). This difference in precipitation accumulations is attributed to both the orientation of water vapor flux relative to the watershed topography and large-scale forcing that results in ascent.
The study uses clustering to objectively identify different orientations and intensities of ARs that make landfall over the California Russian River watershed (Fig. 1). Daily averaged IVT was calculated using 11-years of National Centers for Environmental Prediction (NCEP)–Climate Forecast System Reanalysis (CFSR) data spanning from 1 January 2004 to 31 December 2014. The paper analyzed the synoptic-scale flow configurations and resulting precipitation accumulations and distributions of westerly and south-southwesterly oriented ARs (Orange and Blue clusters in Fig. 1b).
Figure 1. (a) Domain averaged daily IVT direction (angular coordinate) and magnitude (kg m/s ; radial coordinate) for all days from 1 January 2004 to 31 December 2014 that data were available. Markers are color-coded based on 24-h accumulated precipitation (mm). The colored lines illustrate the average IVT for days with precipitation >10 (black), >25 (blue) and >50 mm (red). The 200 kg/m/s threshold that was applied in this study is shown by the black circle. (b) As in (a) except for days with daily average IVT ≥200 kg/m/s and color-coded based on K-means cluster.
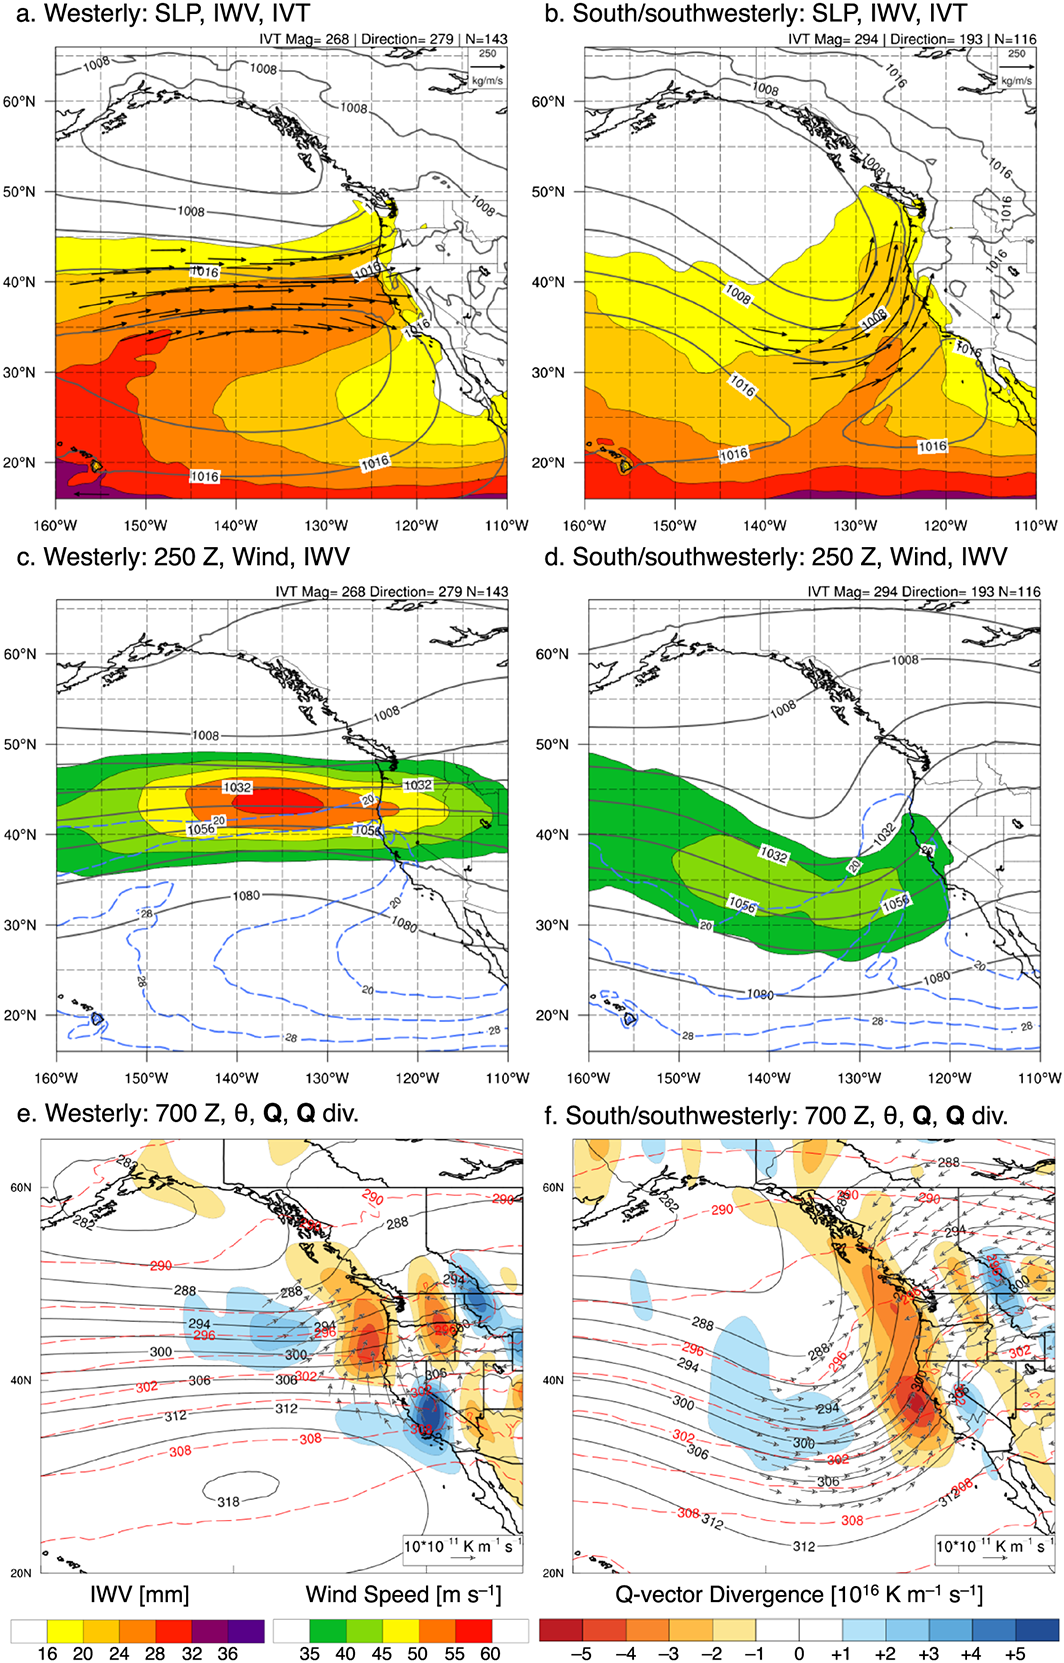
Composite analyses illustrate the vastly different synoptic-scale characteristics associated with westerly and south/southwesterly ARs (Cluster 2 and Cluster 3). These different synoptic-scale flow configurations result in differences in synoptic scale forcing co-located over the composite AR and the Russian River watershed (Fig. 2).

Figure 2. (a, b) Composite mean IVT (kg/m/s ; plotted according to the reference vector in the upper right), SLP (hPa; contoured), and IWV (mm; color-coded according to scale), (c, d) composite mean 250-hPa geopotential height (dam; contoured), wind speed (m s–1 ; colorcoded according to scale), and IWV (mm; dashed blue contour), and (e, f) composite mean 700-hPa geopotential height (dam; solid contours), Q-vectors (1011 K/m/s ; plotted according to the reference vector in the bottom right), Q-vector divergence (1016 K/m/s ; color-coded according to scale) and potential temperature (K; dashed red contours) at t–12 h during (a,c,e) westerly and (b,d,f) south–southwesterly ARs.
The large difference in Russian River watershed area-averaged precipitation between westerly and south-southwesterly ARs (Fig. 3a) is not likely explained by statistically similar cluster IVT magnitudes (i.e., AR intensity; Fig. 3b) and IWV values (Fig. 3e) but likely a combination of a more favorable southwesterly IVT direction (i.e., AR orientation) relative to the orientation of the local topography and favorable synoptic-scale forcing for ascent (Fig. 2) illustrated by Q-vector convergence (Fig. 3d). While both AR types exhibit significantly statistically similar mean IVT, south-southwesterly ARs are associated with statistically significantly higher mean low-level IVT (1000–850 hPa; Fig. 3c).
Results from this study suggest that extreme precipitation produced by ARs is the result of both upslope moisture flux and quasi-geostrophic forcing for ascent.

Figure 3. Box and whisker plots of Russian River Watershed (a) area-average 24-h precipitation (mm), (b) domain average IVT (kg/m/s ), (c) domain average lower tropospheric (1000–850 hPa) IVT (kg/m/s ), (d) domain average Q-vector divergence (1016 K/m/s ), and (e) domain average IWV (mm) for westerly (orange) and south–southwesterly (blue) ARs. The boxes represent the interquartile range of the data and the whiskers represent upper and lower quartile of the data. The horizontal line within the boxes is the median value. The colored dots represent outliers and the asterisks represent extreme outliers. The box in the upper-left corner of each panel indicates the result of the independent samples t-test with 95% confidence (white indicates significantly statistically similar means and black indicates significantly statistically different).
Support for this project was provided by the State of California-Department of Water Resources and the U.S. Army Corps of Engineers, both as part of broader projects led by CW3E. A majority of this work was conducted while Chad was a graduate student at Plymouth State University. Dr. Cordeira and his graduate students at Plymouth State University actively collaborate with CW3E on topics related to atmospheric rivers, such as analyzing, understanding, and forecasting their impacts along the U.S. West Coast.
