CW3E Event Summary: 20-22 March 2023
23 March 2023
Click here for a pdf of this information.
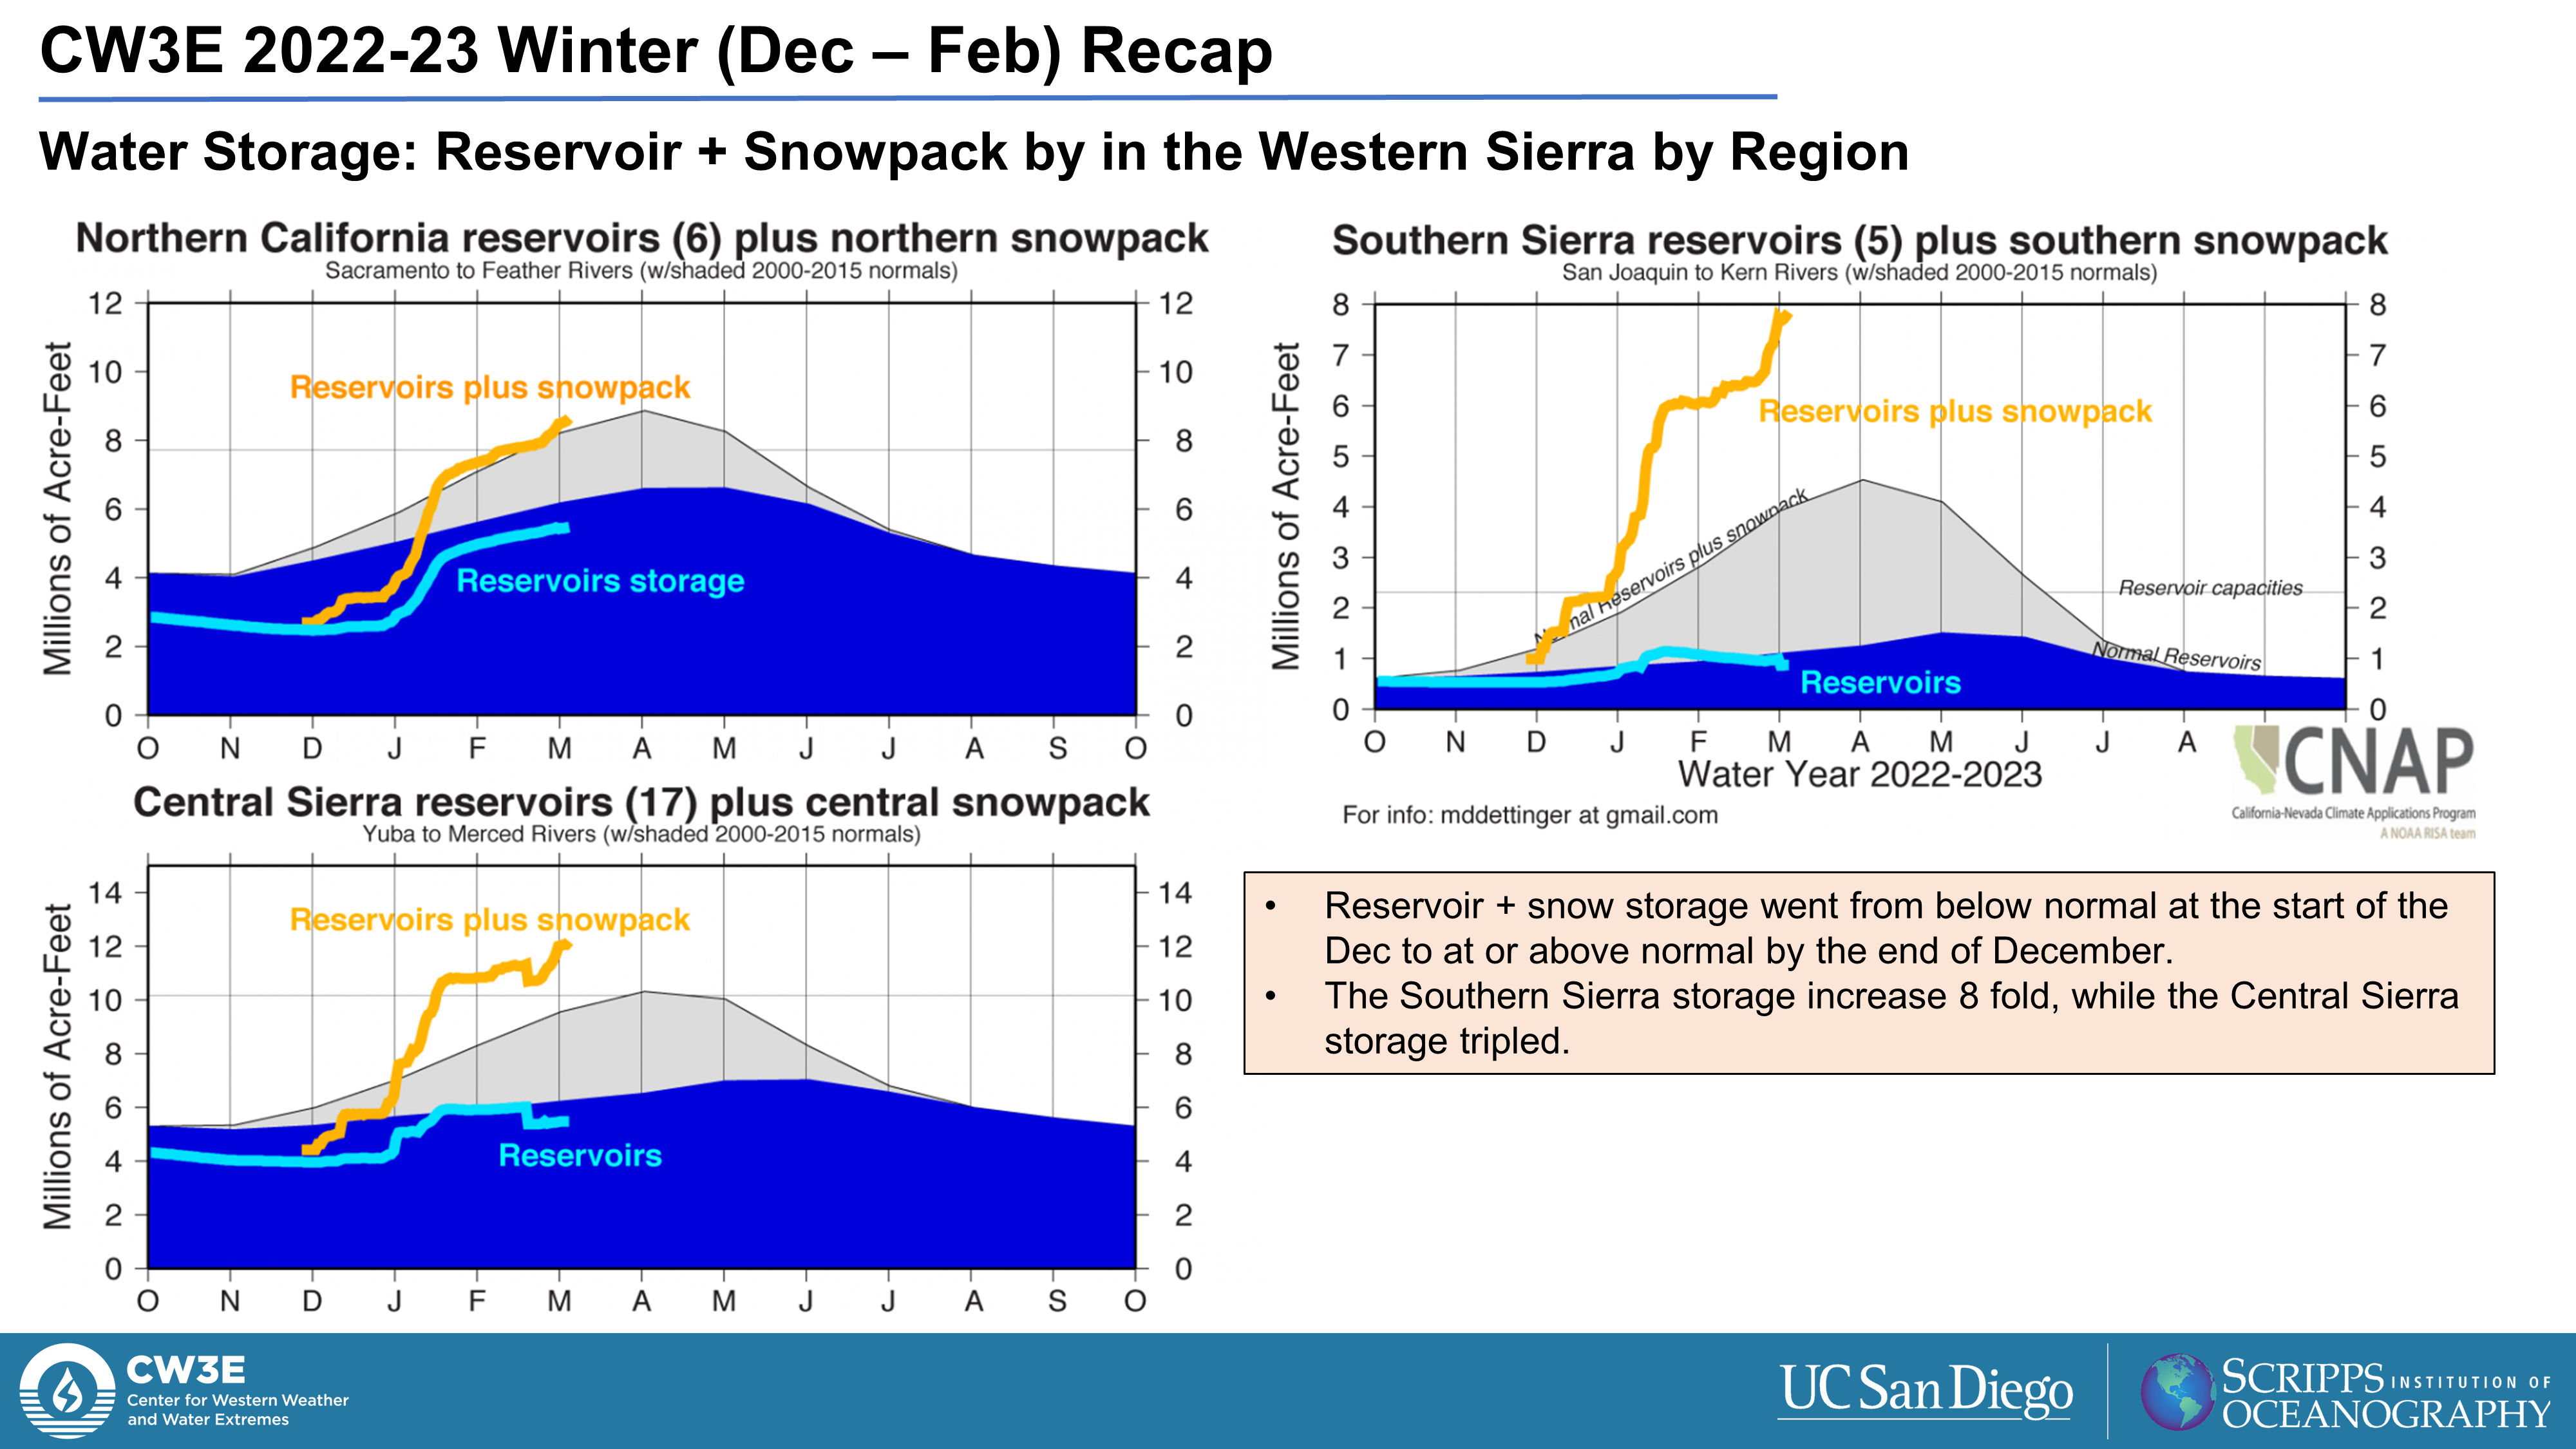
Atmospheric River Brings More Rain and Flooding to California and Arizona
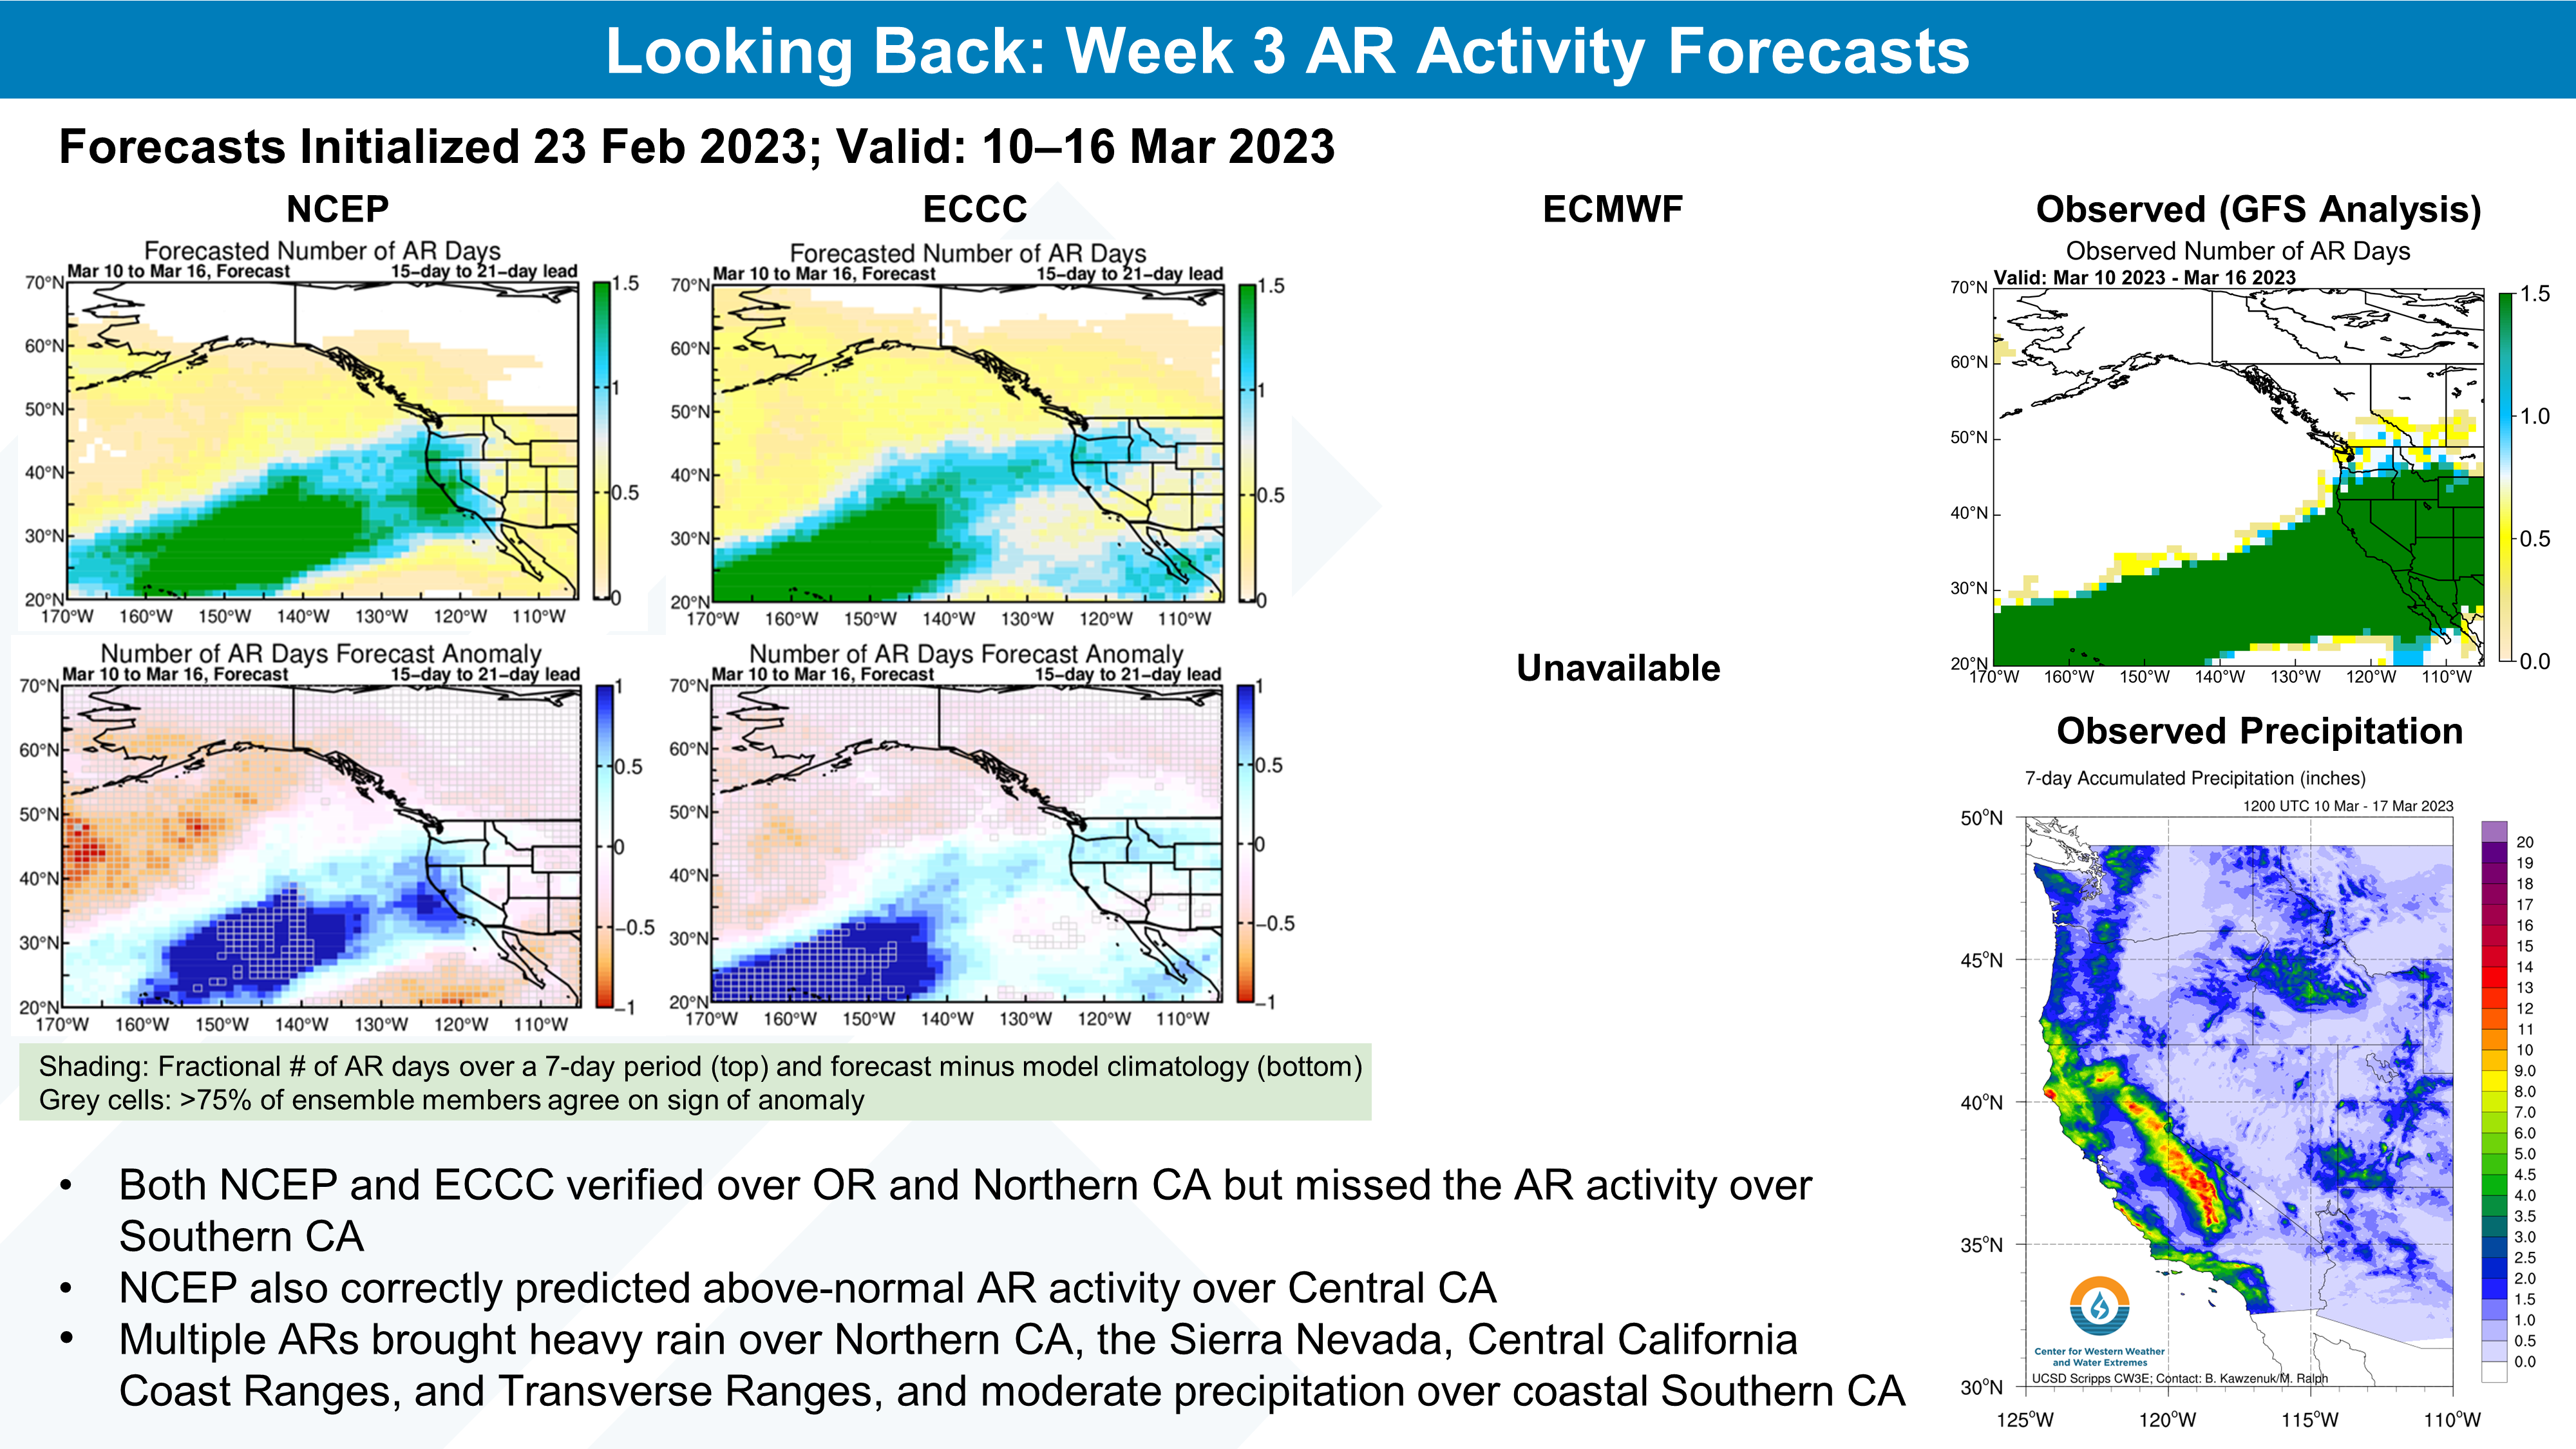
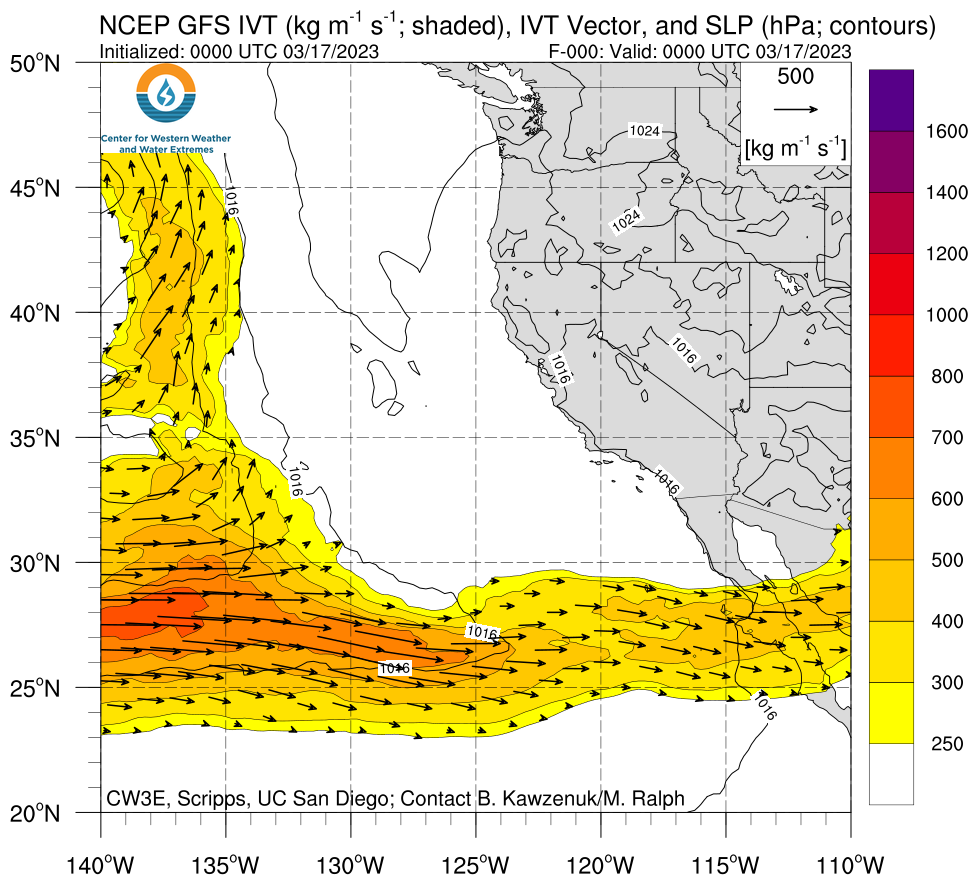
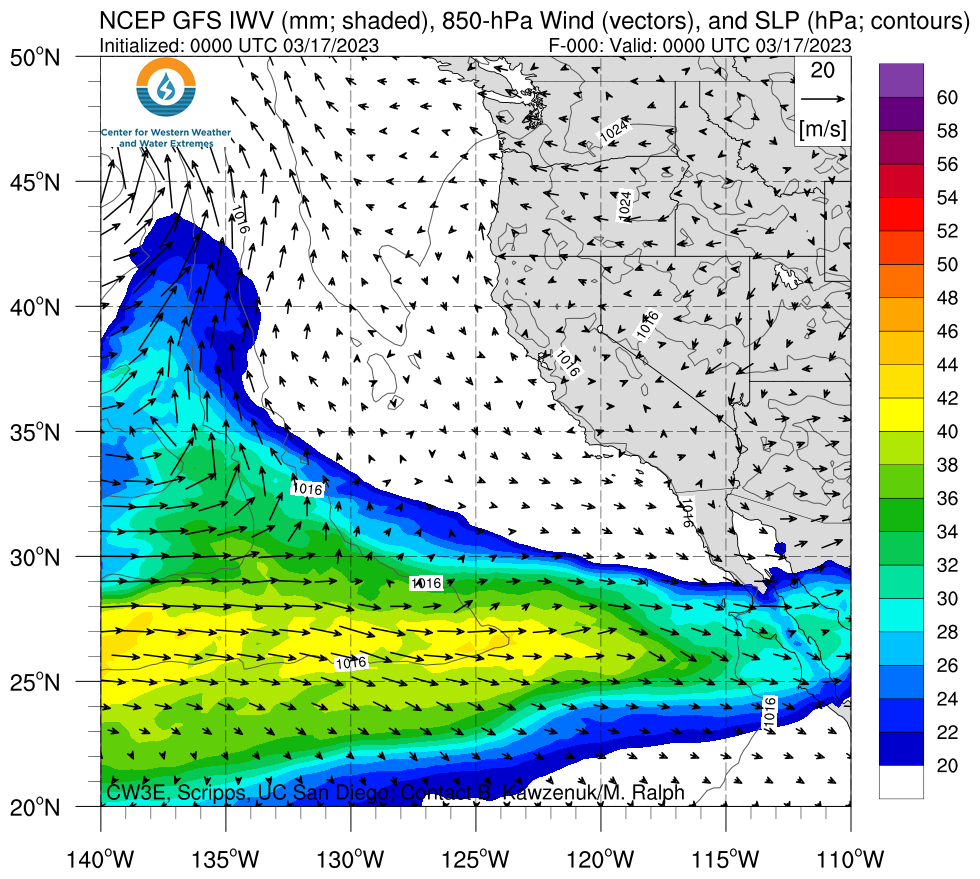
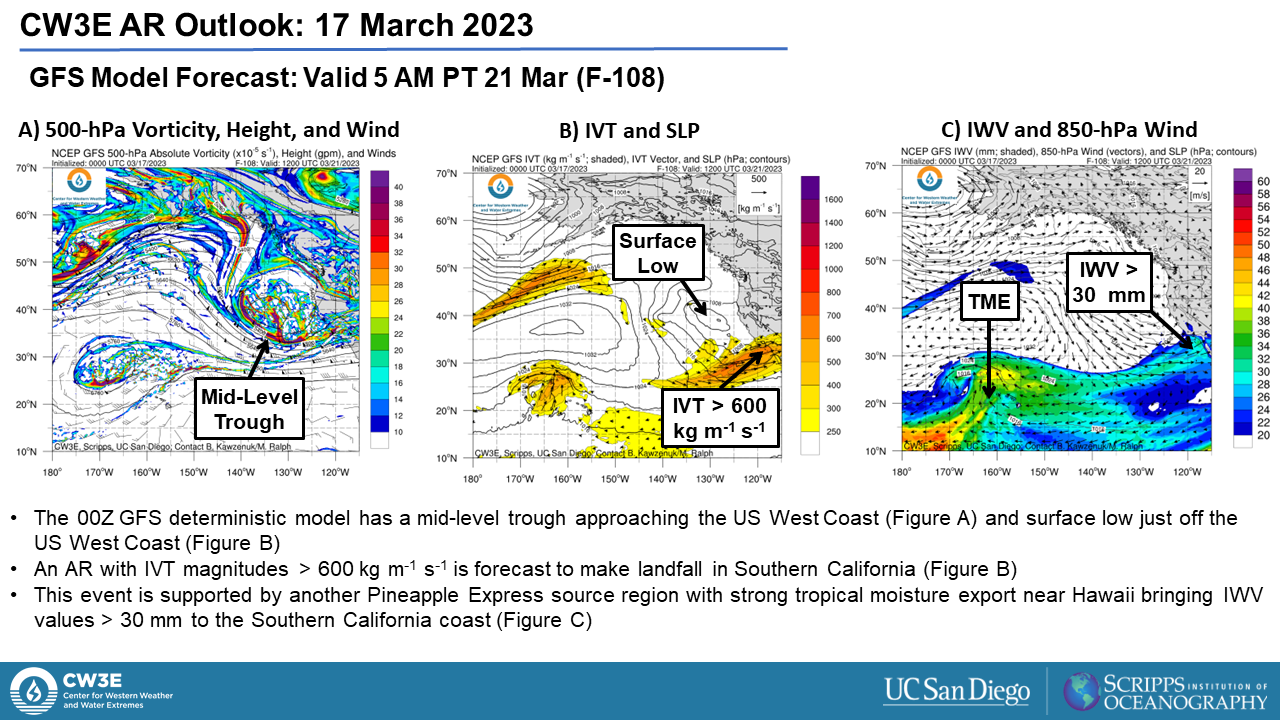
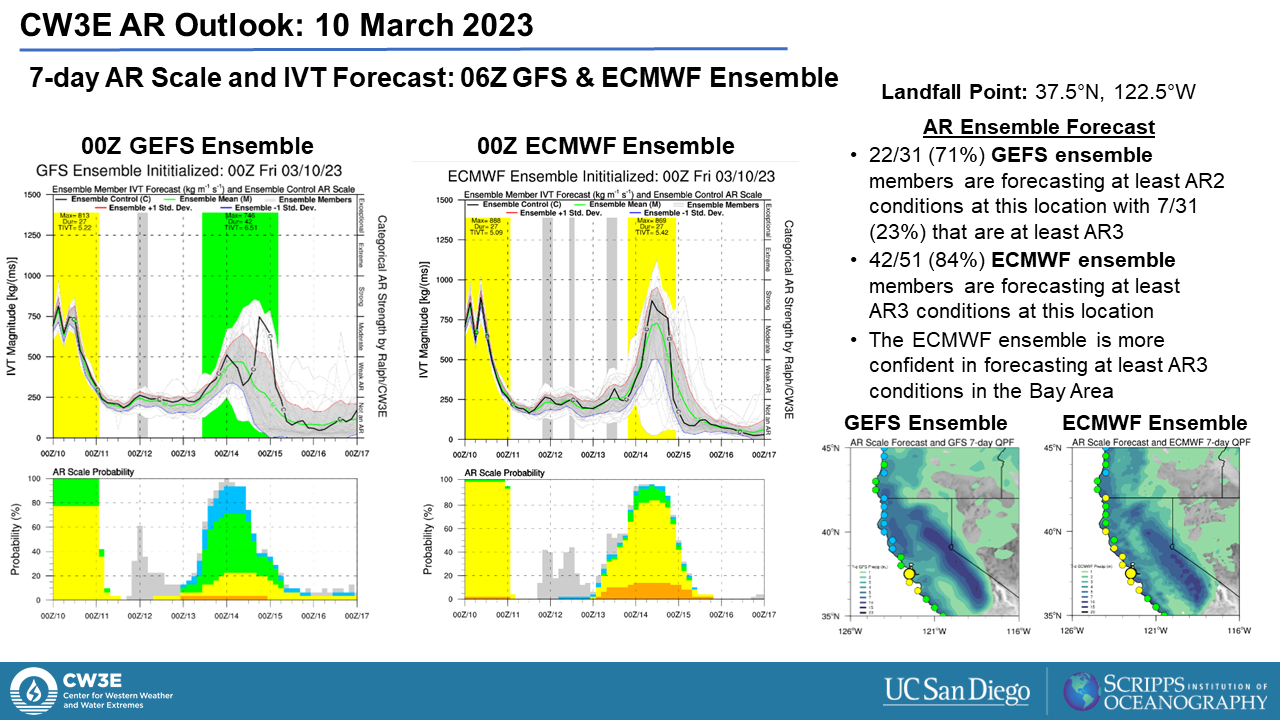
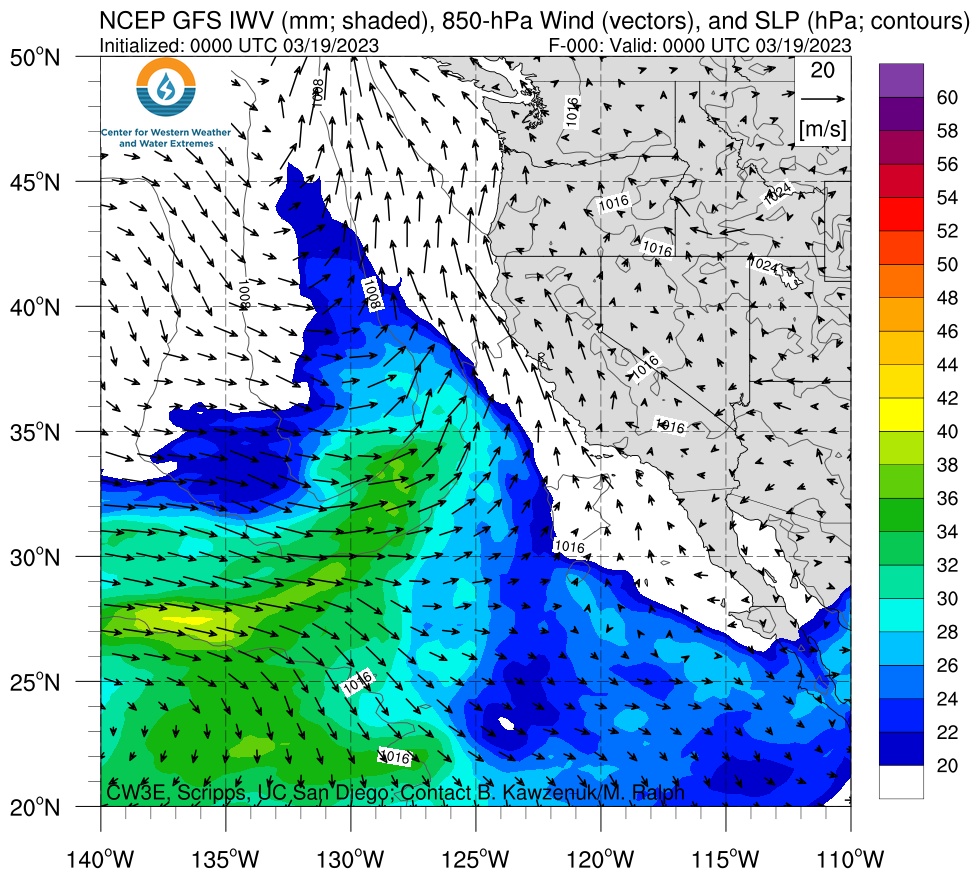
- An atmospheric river (AR) formed over the subtropical Northeast Pacific and made landfall in Southern California on 20 Mar
- A surface cyclone developed on the cold side of the AR and underwent rapid intensification as it approached the Bay Area
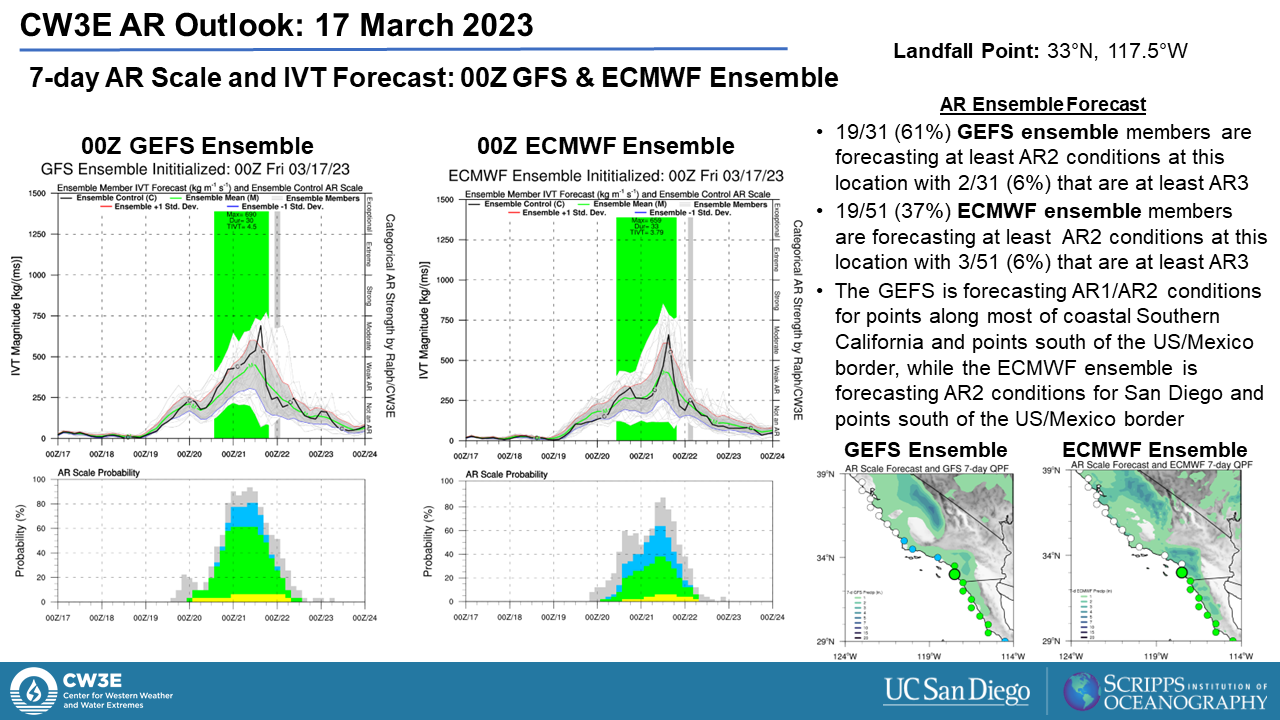
- AR2 conditions were observed in coastal San Diego County and southern Arizona
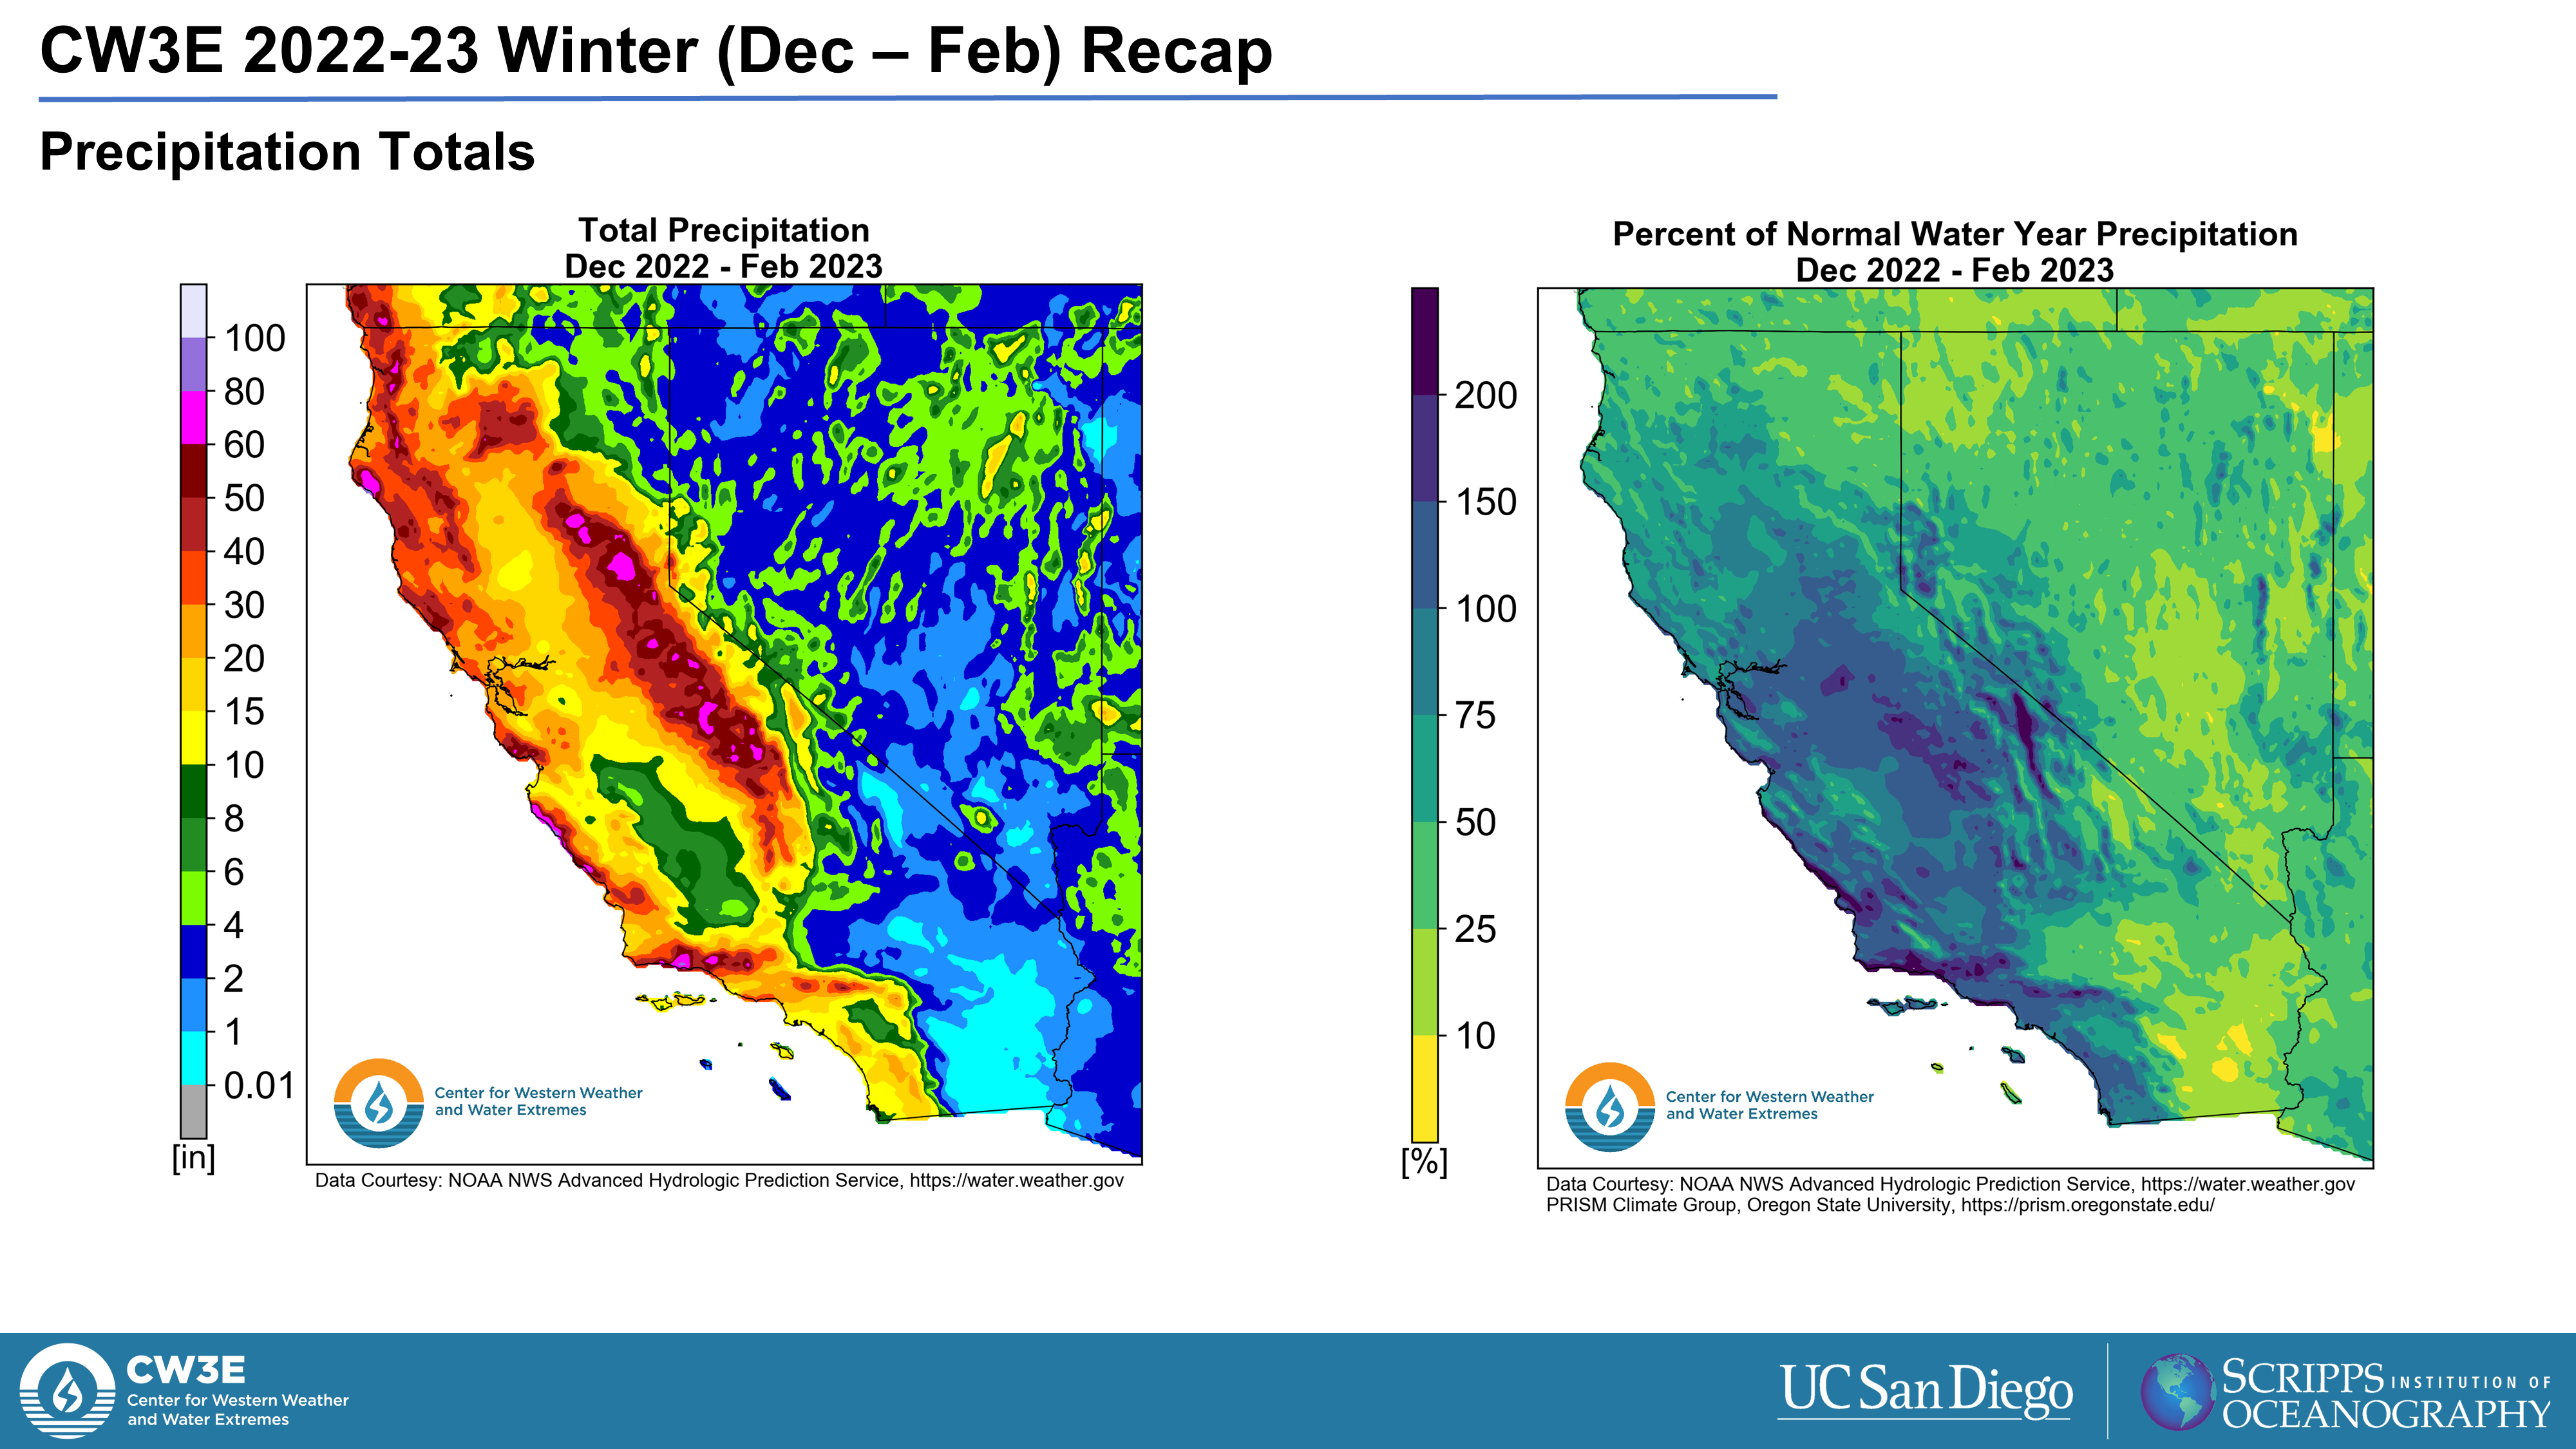
- The AR produced at least 1–3 inches of precipitation across coastal Southern CA and North Central AZ, with the highest amounts (> 4 inches) observed in the San Gabriel Mountains, CA and Coconino County, AZ
- Rainbands wrapping around the low-pressure center produced > 4 inches of precipitation in a 24-hour period in portions of San Mateo and Santa Cruz Counties
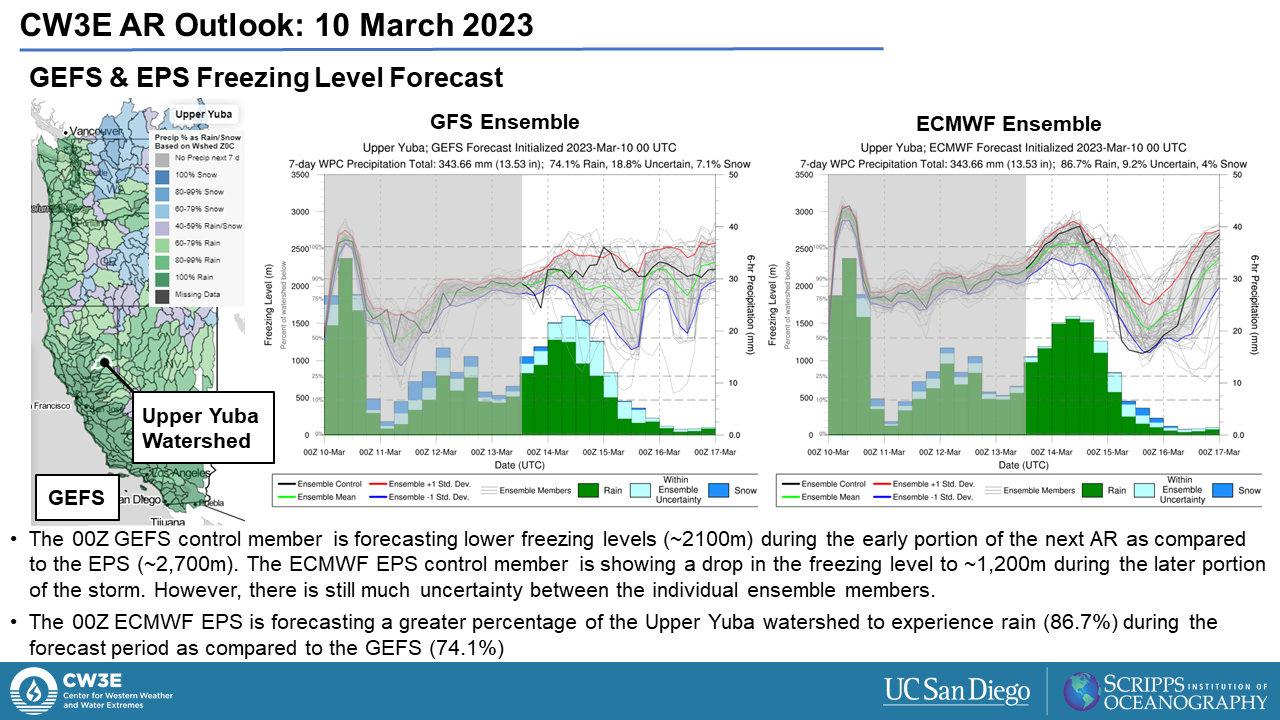
- Lower snow levels during this storm (compared to the two previous storms) allowed for significant snowfall accumulations (> 12 inches) in the higher terrain of the Transverse Ranges
- Two weak tornadoes were reported in California during this storm; an EF0 on 21 March in a trailer park near Carpinteria, CA and an EF1 on 22 March in an industrial area of Montebello, CA, both causing structural damage to multiple buildings
- According to ABC7 News Bay Area, at least 5 people died during this storm, all struck by falling trees. Two fatalities were reported in San Francisco and one in Oakland, Portola Valley, and Rossmoor respectively. (Link to ABC7 News Bay Area Reporting)
- Damage due to high winds, heavy rain, and flooding were reported across Southern California and in parts of Arizona
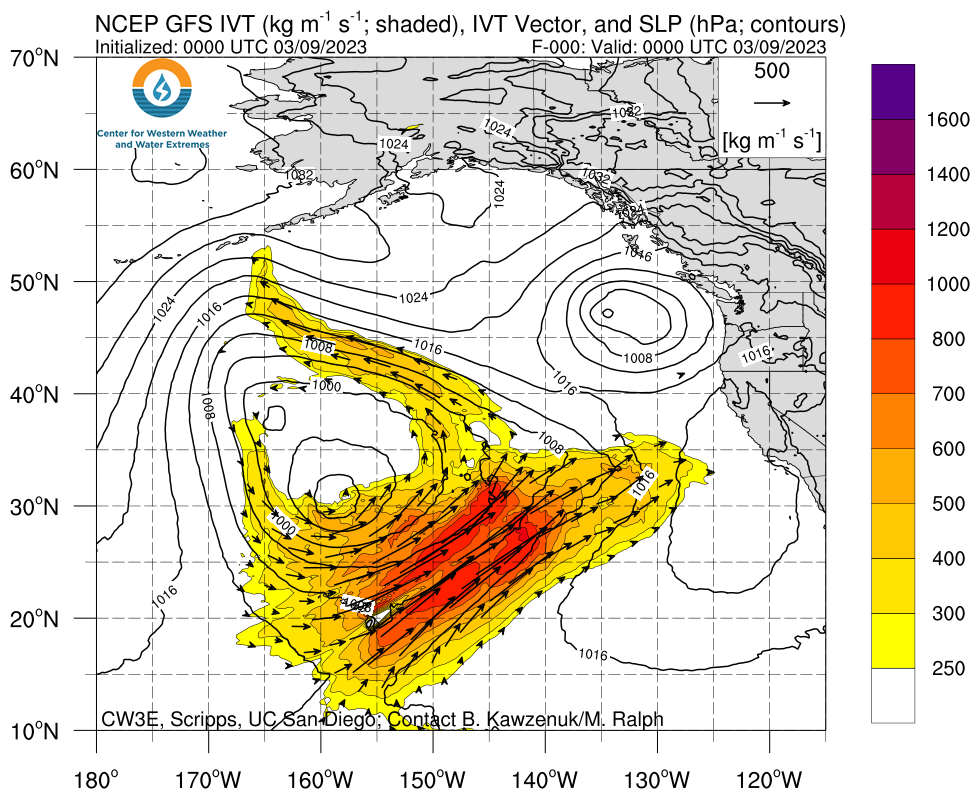
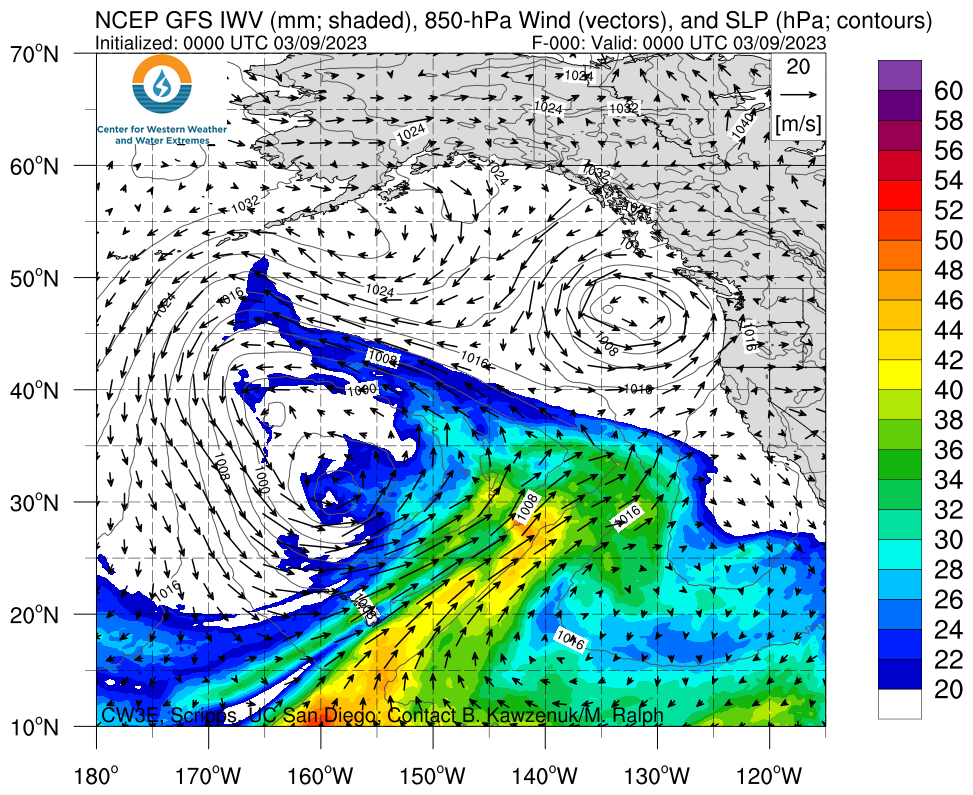
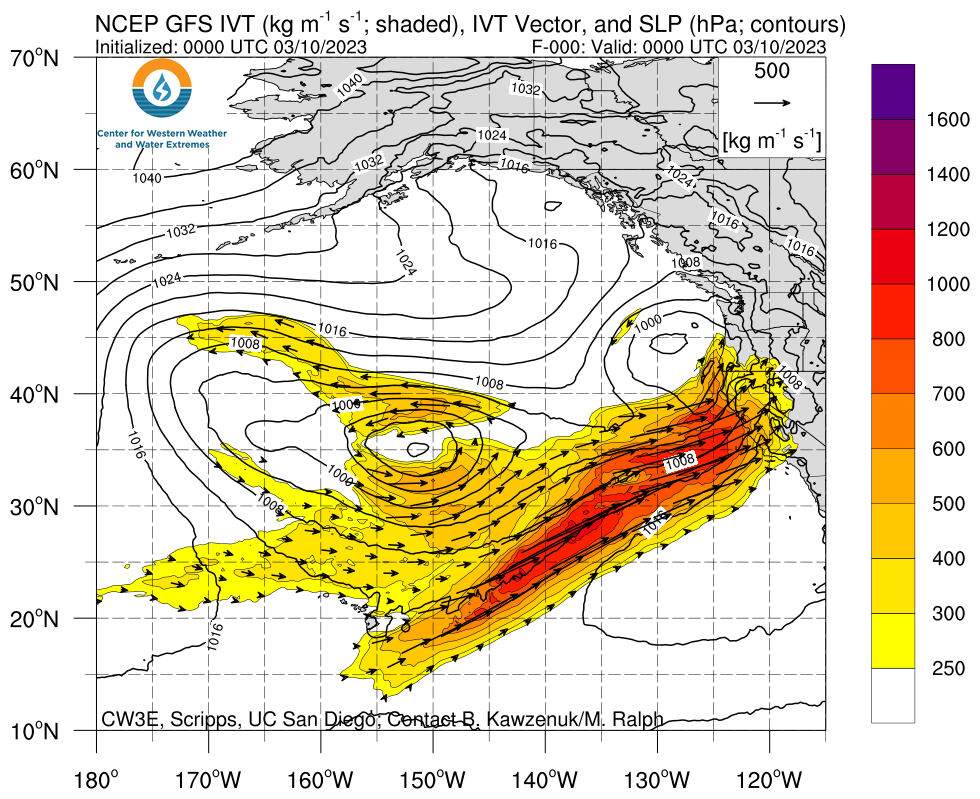
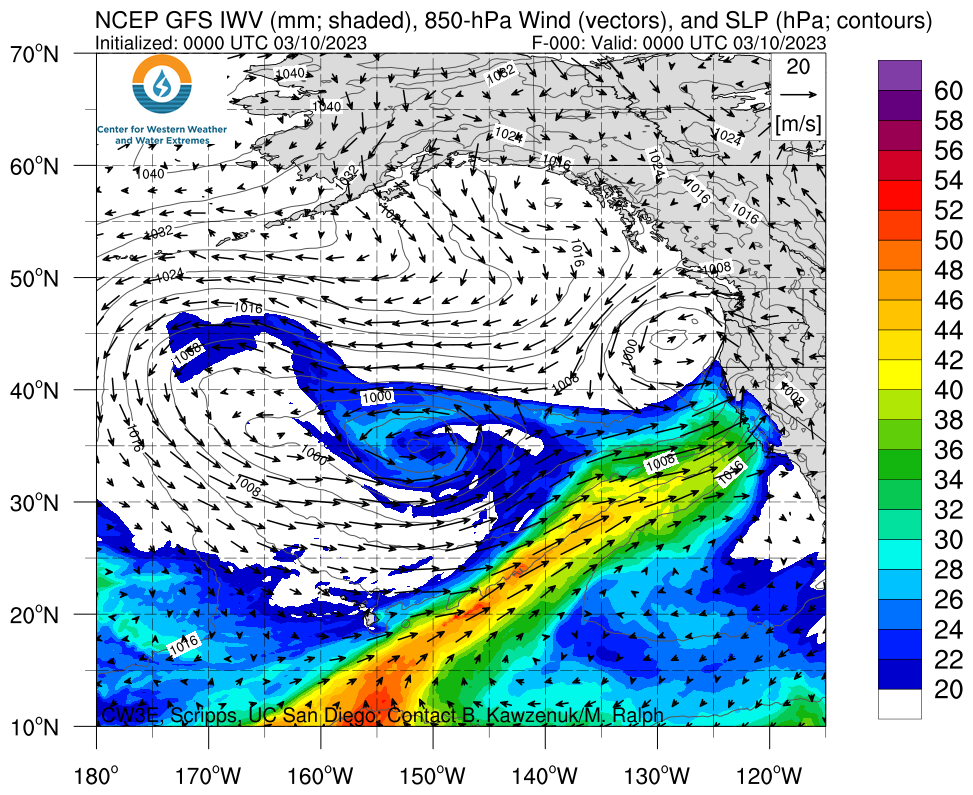
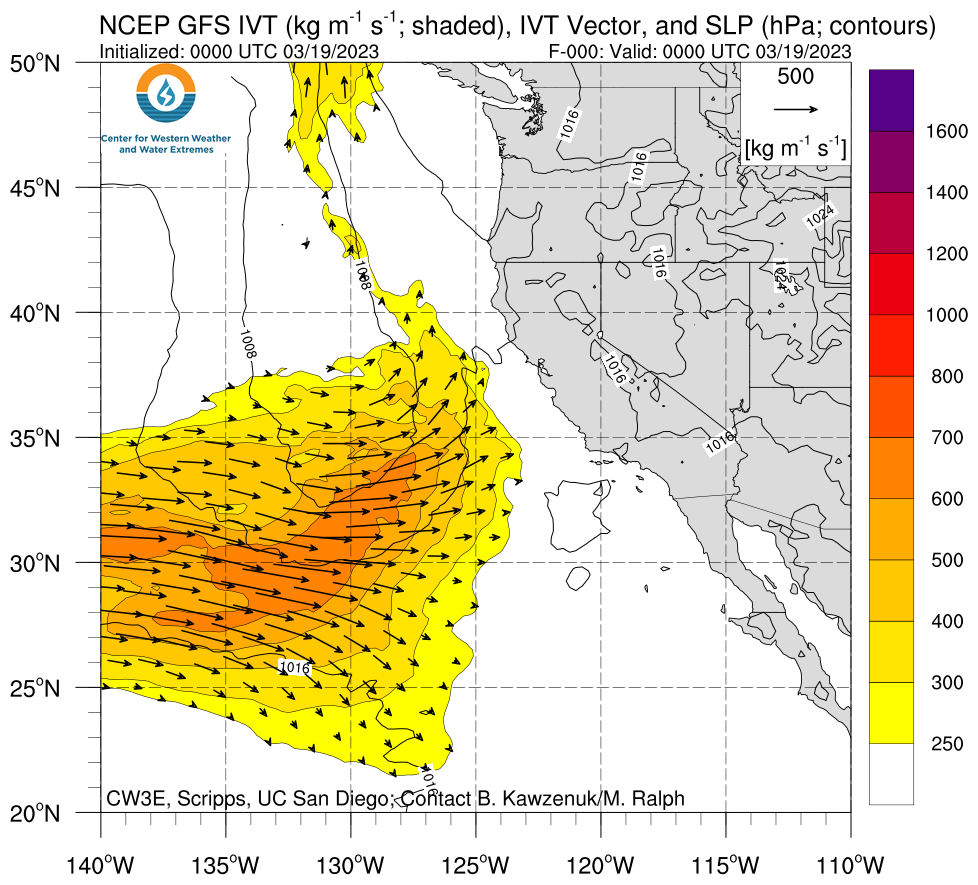
Click images to see loops of GFS IVT/IWV analyses Valid 0000 UTC 19 March – 0000 UTC 22 March 2023 |
|
 |
 |
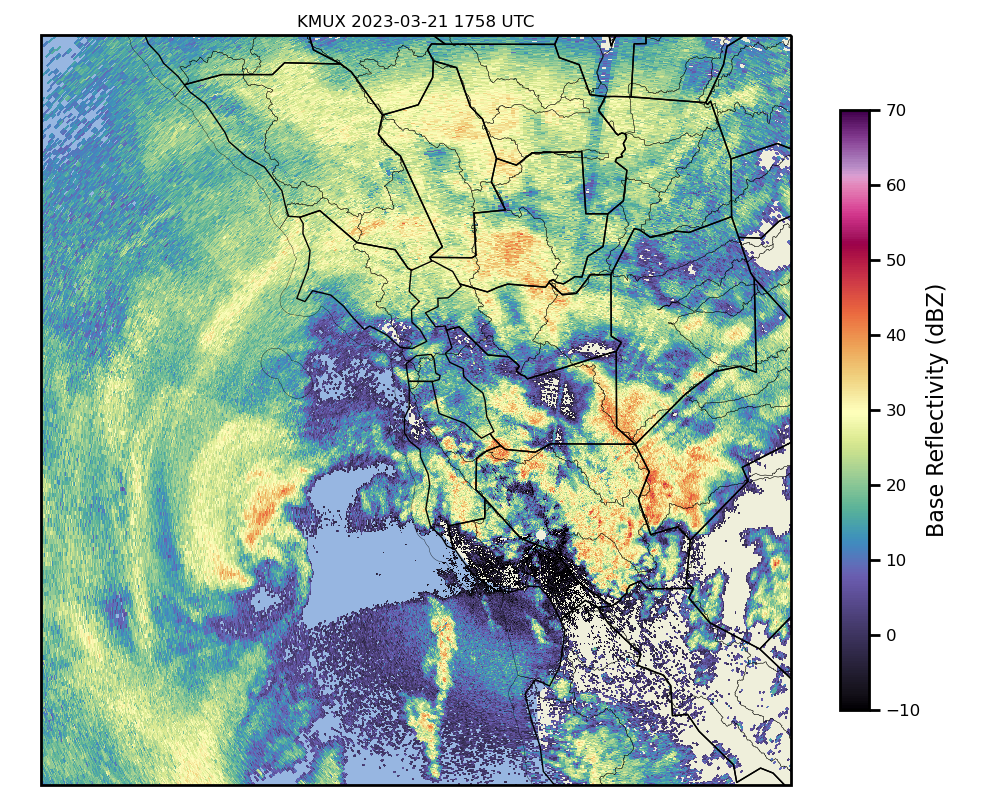
Click image to see loops of NEXRAD Imagery from KMUX
Valid 1800 UTC 21 March – 2345 UTC 21 March 2023


Summary provided by S. Roj, C. Castellano, S. Bartlett, and J. Kalansky; 23 Mar 2023
To sign up for email alerts when CW3E post new AR updates click here.
*Outlook products are considered experimental