CW3E Welcomes Sawyer Smith
March 4, 2025
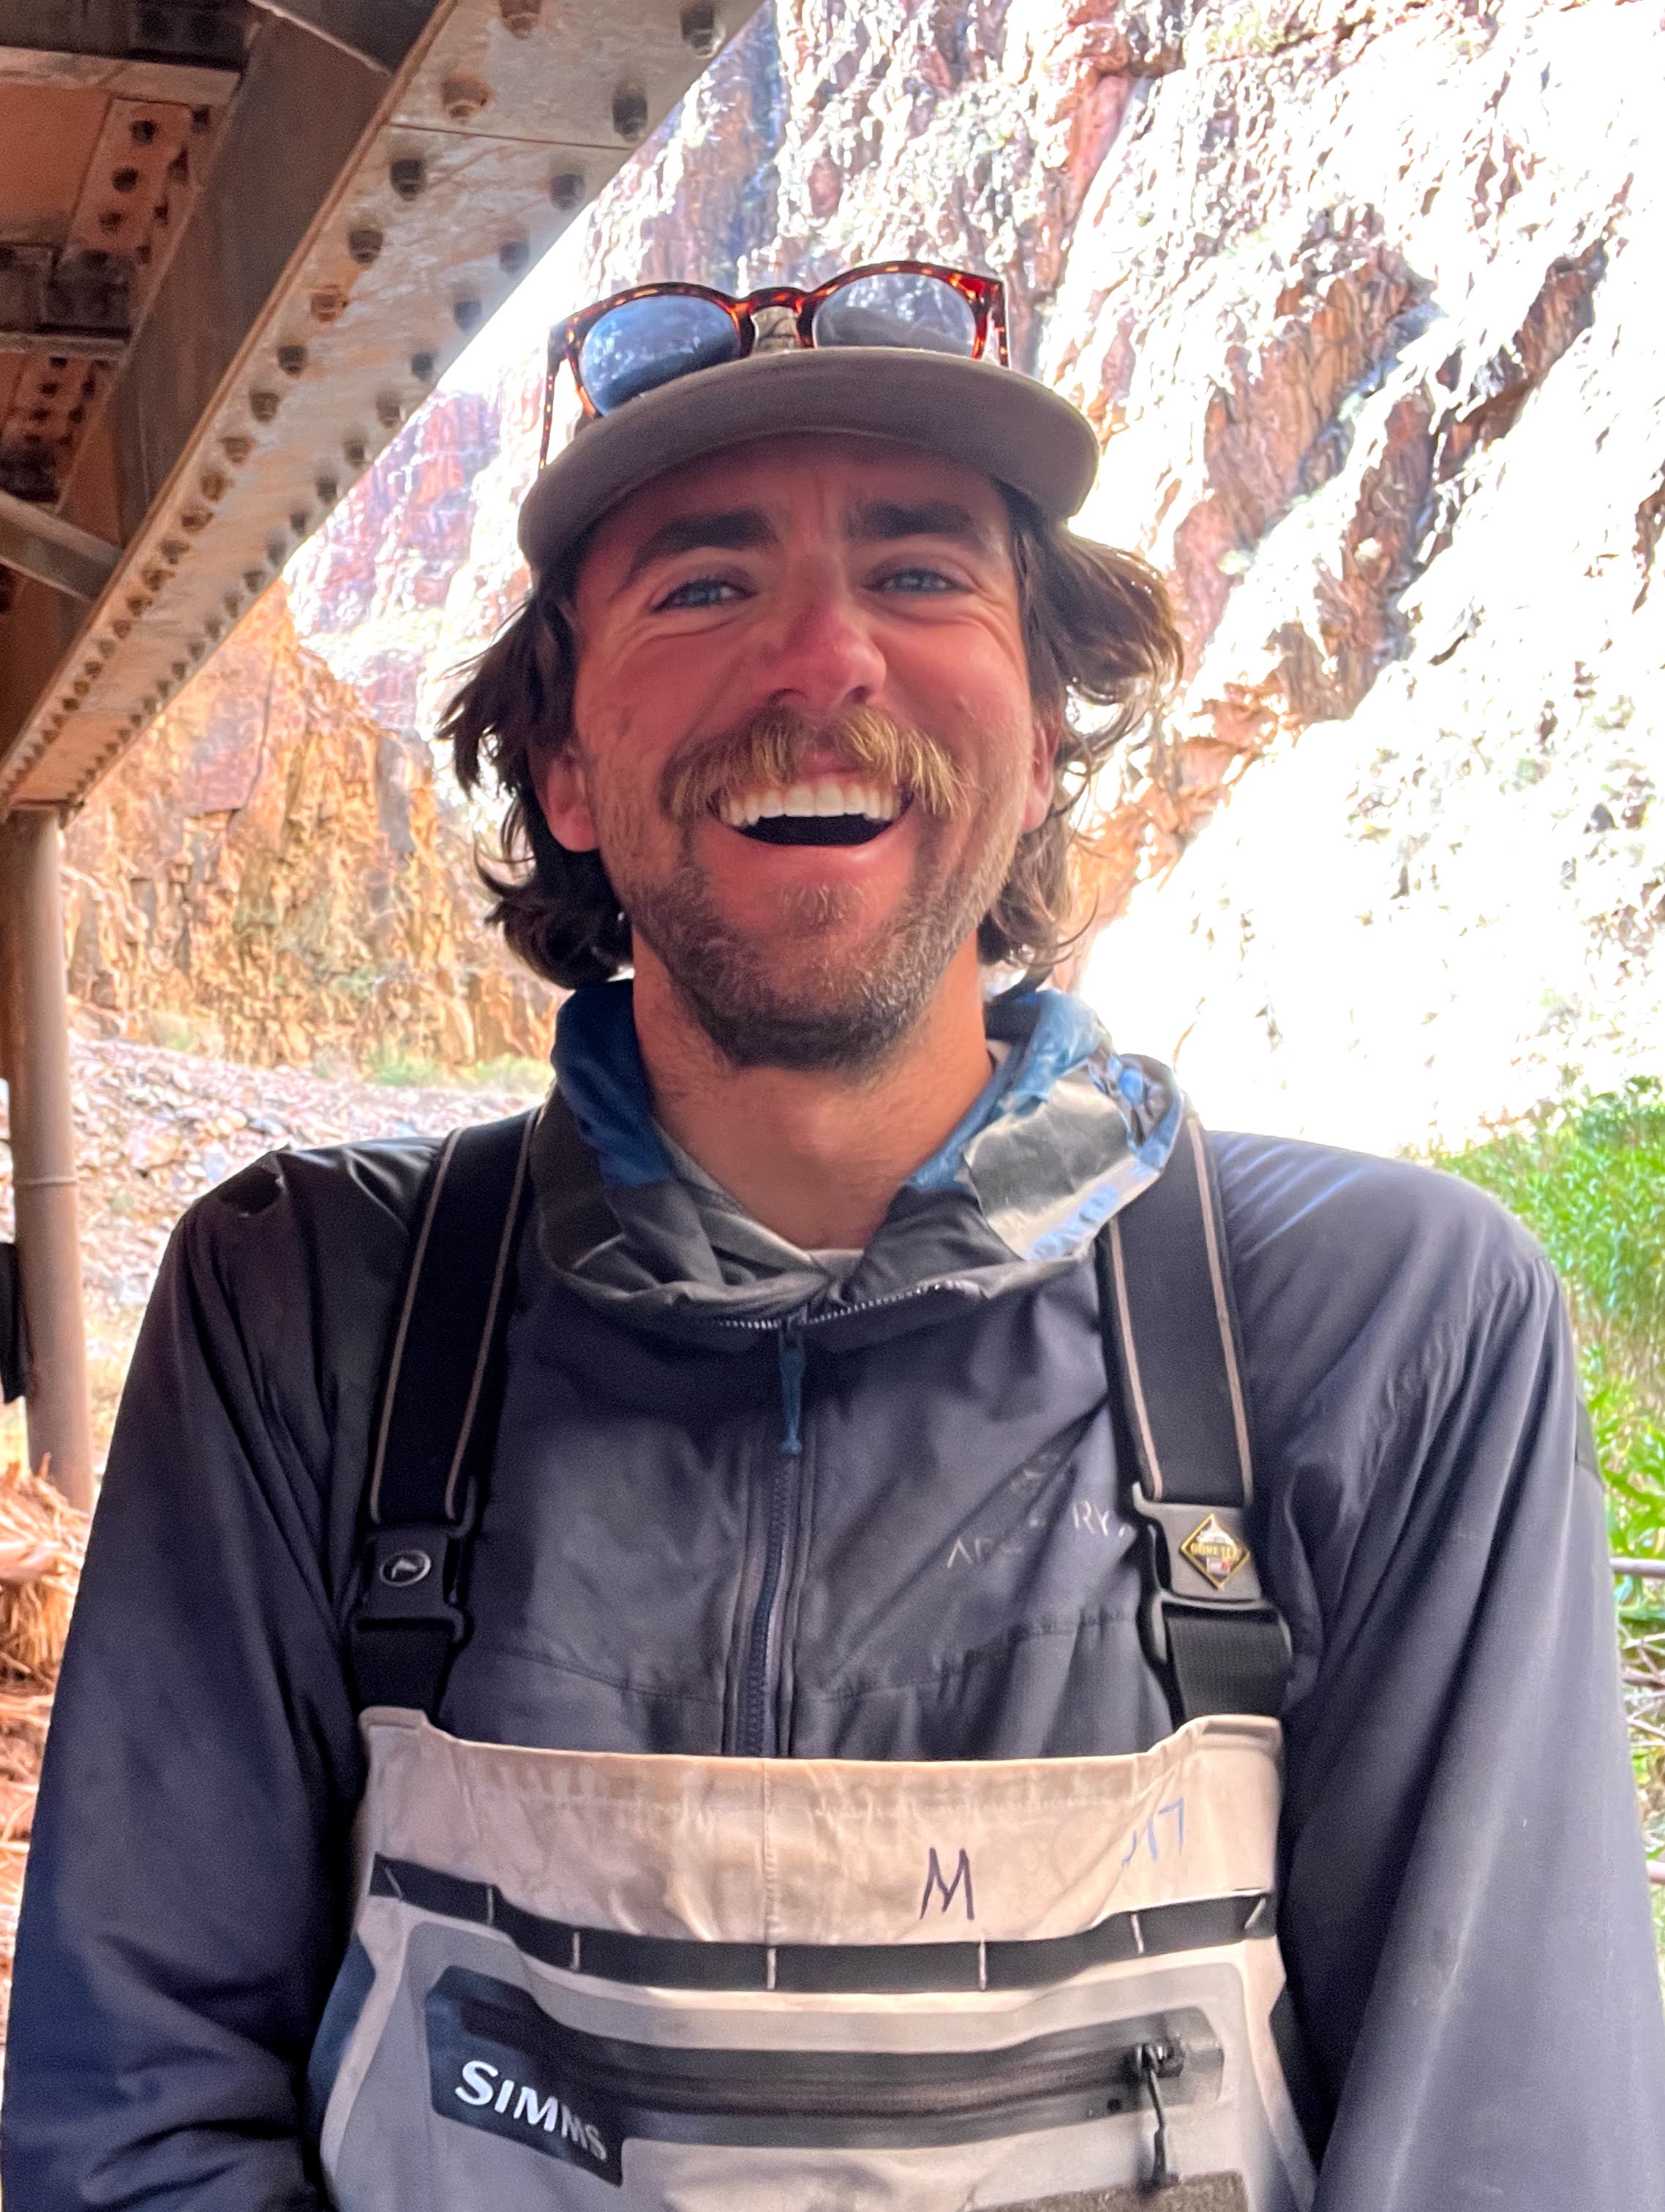
Sawyer Smith joined CW3E in February 2025 as a numerical weather prediction scientist and research data analyst on the CW3E modeling team. He holds a B.S. in Meteorology from Metropolitan State University of Denver (MSU Denver) and received an M.S. in Atmospheric Science from North Carolina State University in December 2024.
During undergrad, Sawyer took advantage of the wealth of opportunities for atmospheric scientists along the Front Range of Colorado, where he served as an Upper Air Observer for the National Weather Service in Boulder, CO and a Winter Weather Aviation Student Assistant at the National Center for Atmospheric Research.
His thesis work, which was funded by CW3E, focused on the sensitivity of orographic precipitation forecasts to the choice of microphysics parameterization along the Sierra Nevada using the West-WRF model. Ironically, cloud microphysics was neither his favorite nor his strongest subject in undergrad—in fact, it was the only meteorology class he did not ace. However, while taking a numerical weather prediction course taught by his graduate advisor, Dr. Gary Lackmann, Sawyer became intrigued by some of the new microphysical parameterization schemes in WRF-ARW and their potential to improve orographic precipitation forecasts.
Thus, as fate would have it, he found himself revisiting his meteorological “Achilles’ heel”—microphysics. Since then, Sawyer has developed a deep enthusiasm for cloud microphysics and is eager to apply his expertise toward CW3E’s mission of advancing the science and prediction of extreme hydrological events.