Science, Policies, Projects, and People: Seventh Annual Yampa Basin Rendezvous Highlights the Ingredients for Water Resiliency in the Yampa Basin
June 18, 2024
The 7th Annual Yampa Basin Rendezvous (YBR) was held 29th-30th May 2024, serving to highlight the multiple complementary ways that the region is working towards increasing climate and water resilience in the face of a changing future climate. The conference was held at the Allbright Auditorium at Colorado Mountain College’s Steamboat Springs campus and was organized by representatives from a plethora of organizations devoted to this goal, including the Center for Western Weather and Water Extremes (CW3E), Friends of the Yampa (FOTY), Yampa Valley Sustainability Council (YVSC), Colorado Mountain College (CMC), the Upper Yampa Water Conservancy District, River Network, Yampatika, The Nature Conservancy, and the Community Agriculture Alliance.
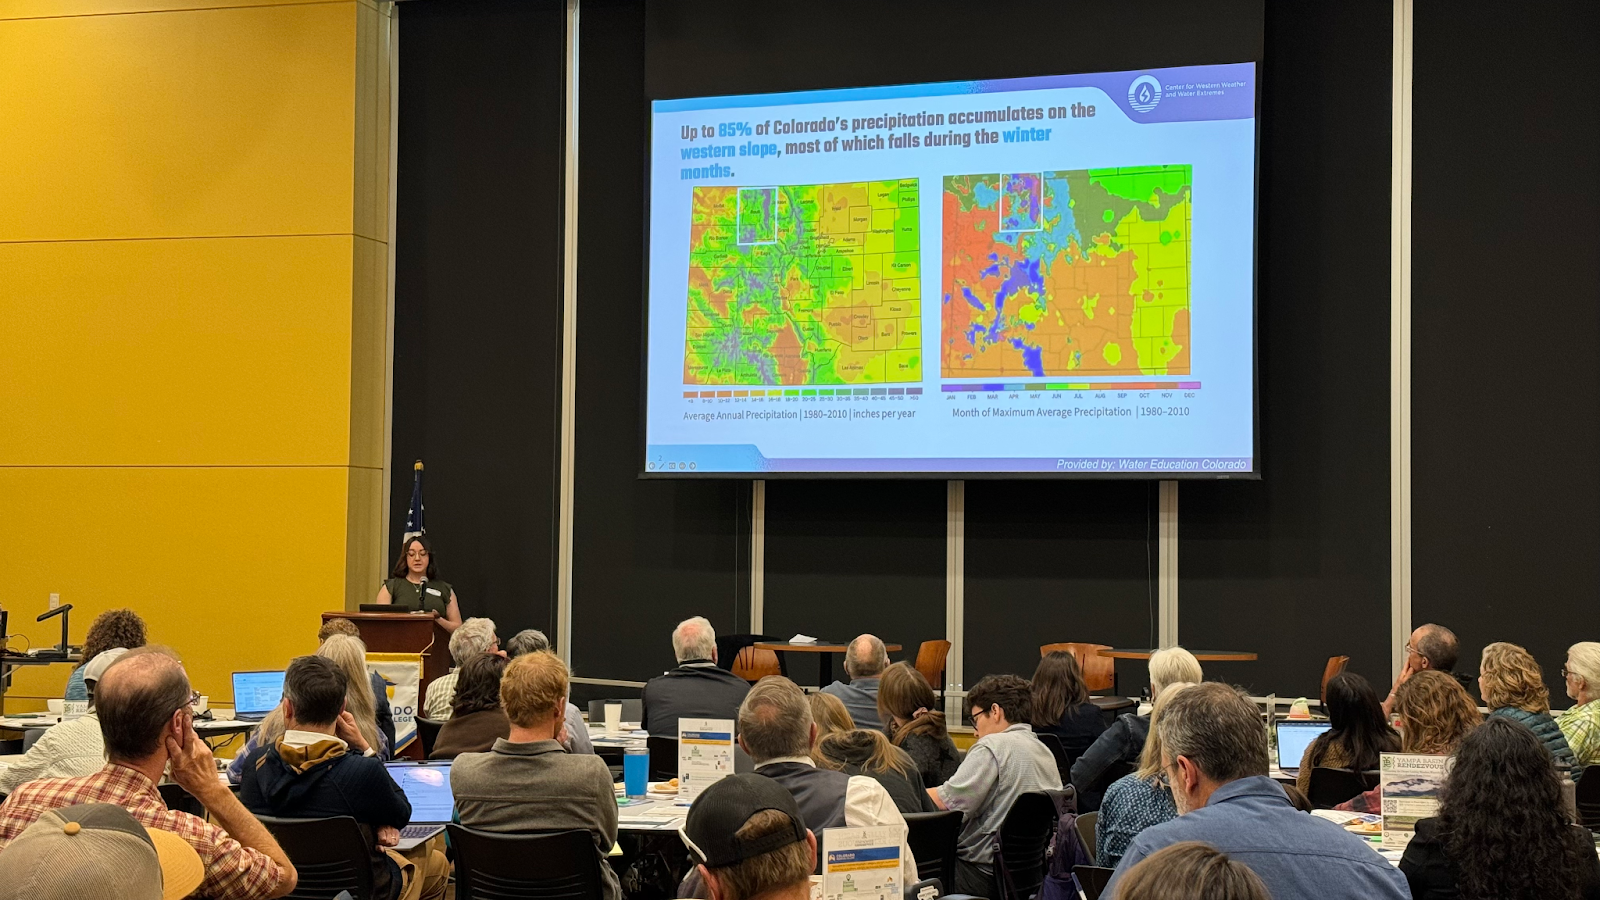
CW3E’s Dr. Deanna Nash presents to YBR attendees on the role of Atmospheric Rivers in Colorado’s precipitation and snowpack patterns. Photo Credit: Nathan Stewart.
This year’s conference theme, “Connecting the Drops: Linking Weather, Watersheds, and Communities for a Resilient Water Future”, highlights the interwoven and interdisciplinary nature of the path to water resiliency, with connection between diverse communities being the key to success. In that vein, YBR 2024 provided a forum for experts in the disparate fields of science and research, policy and advocacy, land management and project implementation, and science communication and outreach to share their work and ideas, with a focus on the Yampa River Basin. The two days of the conference featured three panel sessions each examining a different aspect of climate and water resilience. The panel sessions were complemented by ample opportunity for networking and casual conversations including two Field Excursions and an evening Community Showcase & Happy Hour event.
The first day of the conference opened with welcoming remarks from outgoing President of CMC and long-time YBR attendee, Dr. Carrie Besnette Hauser, who spoke of the close ties between CMC and the rivers that run through its district. She drew analogy between the founding stories of both CMC and YBR as small, dedicated groups of citizens banding together to advocate for something they believed was important to the rural Western Slope communities they cared deeply about. Dr. Hauser’s remarks were followed by speakers from the first panel, who together examined the State of the Science and Policy. This panel featured talks from Becky Bolinger, Colorado’s Assistant State Climatologist; Kelly Romero-Heaney, Assistant Director of Water Policy for the Department of Natural Resources; and Deanna Nash, CW3E Postdoctoral Researcher. Deanna shared her latest CW3E research into the role of atmospheric rivers on precipitation in Colorado and the Yampa Basin, including the potential role of atmospheric rivers as “drought busters”. Next, the second panel showcased examples of Connected Land-Water Planning and Management. The invited speakers were Andrea Harbin Monahan of the Colorado Water Conservation Board; Andy Rossi of the Upper Yampa Water Conservancy District, and 5th-generation Yampa Valley rancher Kyle Monger, who shared his perspectives from decades of family ranching operations on the Yampa River.
During the lunch break, YBR attendees were treated to a surprise visit by members of the Colorado State Legislature. Colorado Governor Jared Polis, Senator Dylan Roberts, House Speaker Julie McCluskie, and Representative Meghan Lukens visited the conference to sign two important pieces of water legislation into law. The bills, HB24-1362 and SB24-197, aim to help the State increase resilience to drought in the basin by incentivising greywater recycling, and by implementing recommendations from the Colorado River Drought Task Force. Their visit signifies a growing recognition of YBR as a venue for driving change on this issue and for channeling research and knowledge into action.
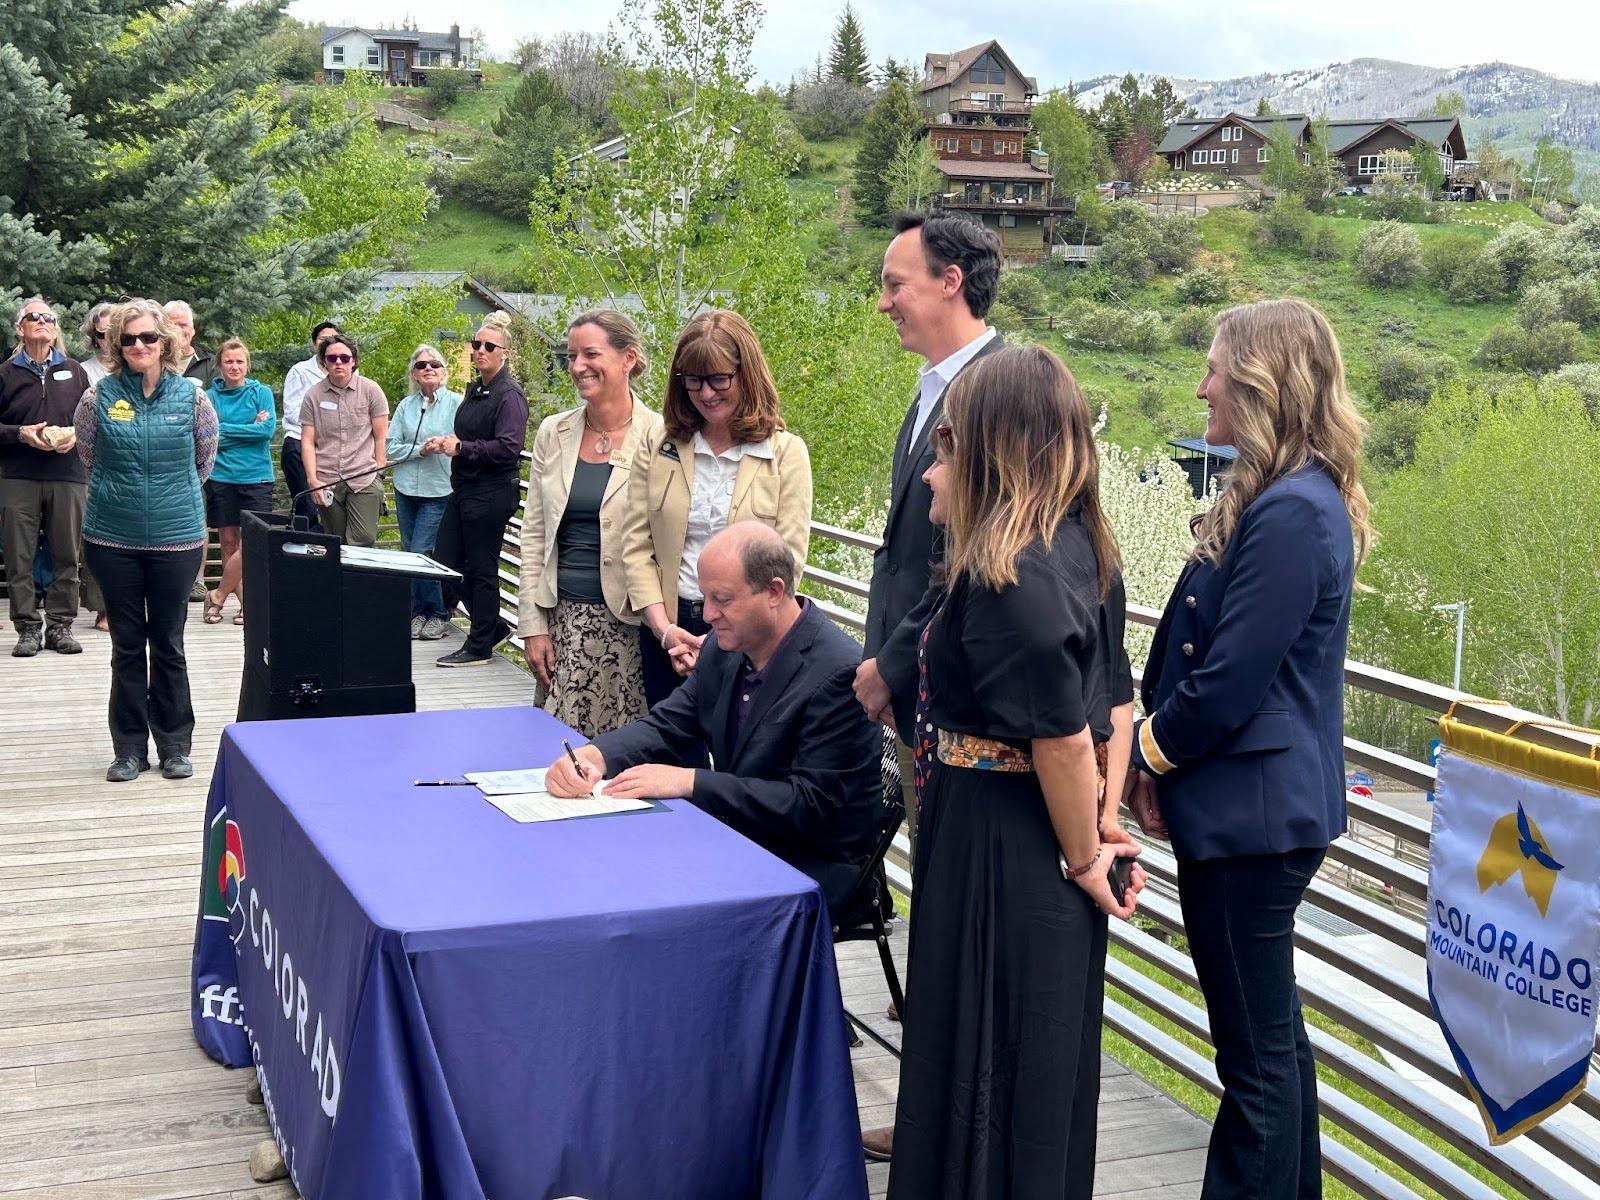
Gov. Polis signs SB24-197 at this year’s YBR. The bill implements some of the recommendations from the Colorado River Drought Task Force. Photo Credit: Madison Muxworthy.
In the afternoon, participants ventured out on a field excursion to a climate and soil moisture monitoring station operated by the Y-BASIN project team. The Y-BASIN project is a partnership between CW3E, YVSC, and CMC and supported by the Upper Yampa Water Conservancy District, Colorado River District, and Colorado Water Conservation Board. Participants learned from CW3E Director Marty Ralph and YVSC Director Michelle Stewart about the goals of the Y-BASIN project and the importance of soil moisture measurements in accurately predicting seasonal water availability. They inspected the station and its sensors up close, and had the chance to collect their own soil moisture measurements using handheld probes, led by USFS Soil Scientist Ryan Adams. The field excursion was immediately followed by the Community Showcase event, which featured posters, booths, and other presentations from community organizations in an informal setting with conversation stimulated by light refreshments. The venue, right on the banks of the Yampa River, provided a charming opportunity to reflect on the day’s learning.
The next morning, returning attendees were welcomed by CW3E Director Dr. Marty Ralph, who reflected on the importance of YBR to CW3E’s mission and the history of the relationship between the center and the Yampa Basin. Dr. Ralph also showcased some of the critical research advancements in climate and water resiliency that the Center has been a part of and continues to work on. The third panel highlighted the work of communicators in the Yampa Basin. Filmmaker Cody Perry and journalist Luke Runyon shared their perspectives on storytelling around rivers and water in Colorado and Jessica Counts, of local non-profit YVPS3, shared her work on furthering education and career opportunities for young students in the Yampa Valley.

Field excursion attendees learn about soil moisture monitoring for water resource management at one of the Y-BASIN climate and soil moisture monitoring stations. Photo Credit: Nathan Stewart.
For the afternoon field excursion, participants were joined by invited speakers CJ Mucklow, Jeremiah Psiropoulos, Bill Badaracca, and Mark Monger, all local landowners and experts in ecology, ranching, and land management. The field party visited a series of ranches in the Elk River drainage to compare landscape characteristics in the presence and absence of beavers and BDA (beaver dam analogue) structures. The speakers not only discussed the challenges of managing the impacts of beaver activity on ranch operations, but also passionately emphasized the myriad benefits they can bring to both the rancher and the ecosystem thanks to their modulation of water movement through the landscape.
The end of the field excursion marked the end of the official YBR program, although participants were eager to continue their conversations into the evening at FOTY’s State of the Yampa Address and over the weekend at the Yampa River Festival. The sharing of knowledge and the connections made at this year’s conference will surely contribute to a better informed and more energized Yampa Basin community as we strive for a more sustainable and resilient future.
– Yampa Basin Rendezvous 2024 Steering Committee