CW3E in the Press: Recent Media Coverage From the New York Times, BBC, CNN and More
June 30, 2025
Recent media coverage including by major outlets New York Times, BBC, CNN, PBS, and the Water Education Foundation, has explored how CW3E’s Research And Operations Partnerships are helping communities and water managers prepare for extreme weather in the US. These articles highlight programs CW3E has led, or co-led the development of, especially FIRO and AR Recon. They quote CW3E experts, from its Director, Dr. Marty Ralph, to Drs. Anna Wilson, Jay Cordeira, Tom Corringham, and consultant Jay Jasperse.
In the article “California’s Quest to Turn a Winter Menace Into a Water Supply Bonus is Gaining Favor Across the West,” author Matt Jenkins provides a comprehensive overview of how Forecast Informed Reservoir Operations (FIRO) was developed in collaboration with federal, state, and local partners. The article explains how Lake Mendocino emerged as an ideal pilot site because of a convergence of scientific developments on the role of atmospheric rivers in flooding in the area, and public and political pressures brought on by California’s severe drought in 2012–2015. While FIRO is already helping to shape smarter, more flexible reservoir operations in California, Oregon, and Washington, the program is poised to expand across the country. Cary Talbot, USACE’s National Lead for FIRO, Marty Ralph, CW3E Director, FIRO Chief Scientist and AR Recon PI, Jay Jasperse, formerly Sonoma Water Agency’s Chief Engineer, and Patrick Sing, USACE’s reservoir operator for Lake Mendocino, were all interviewed for this in-depth summary.
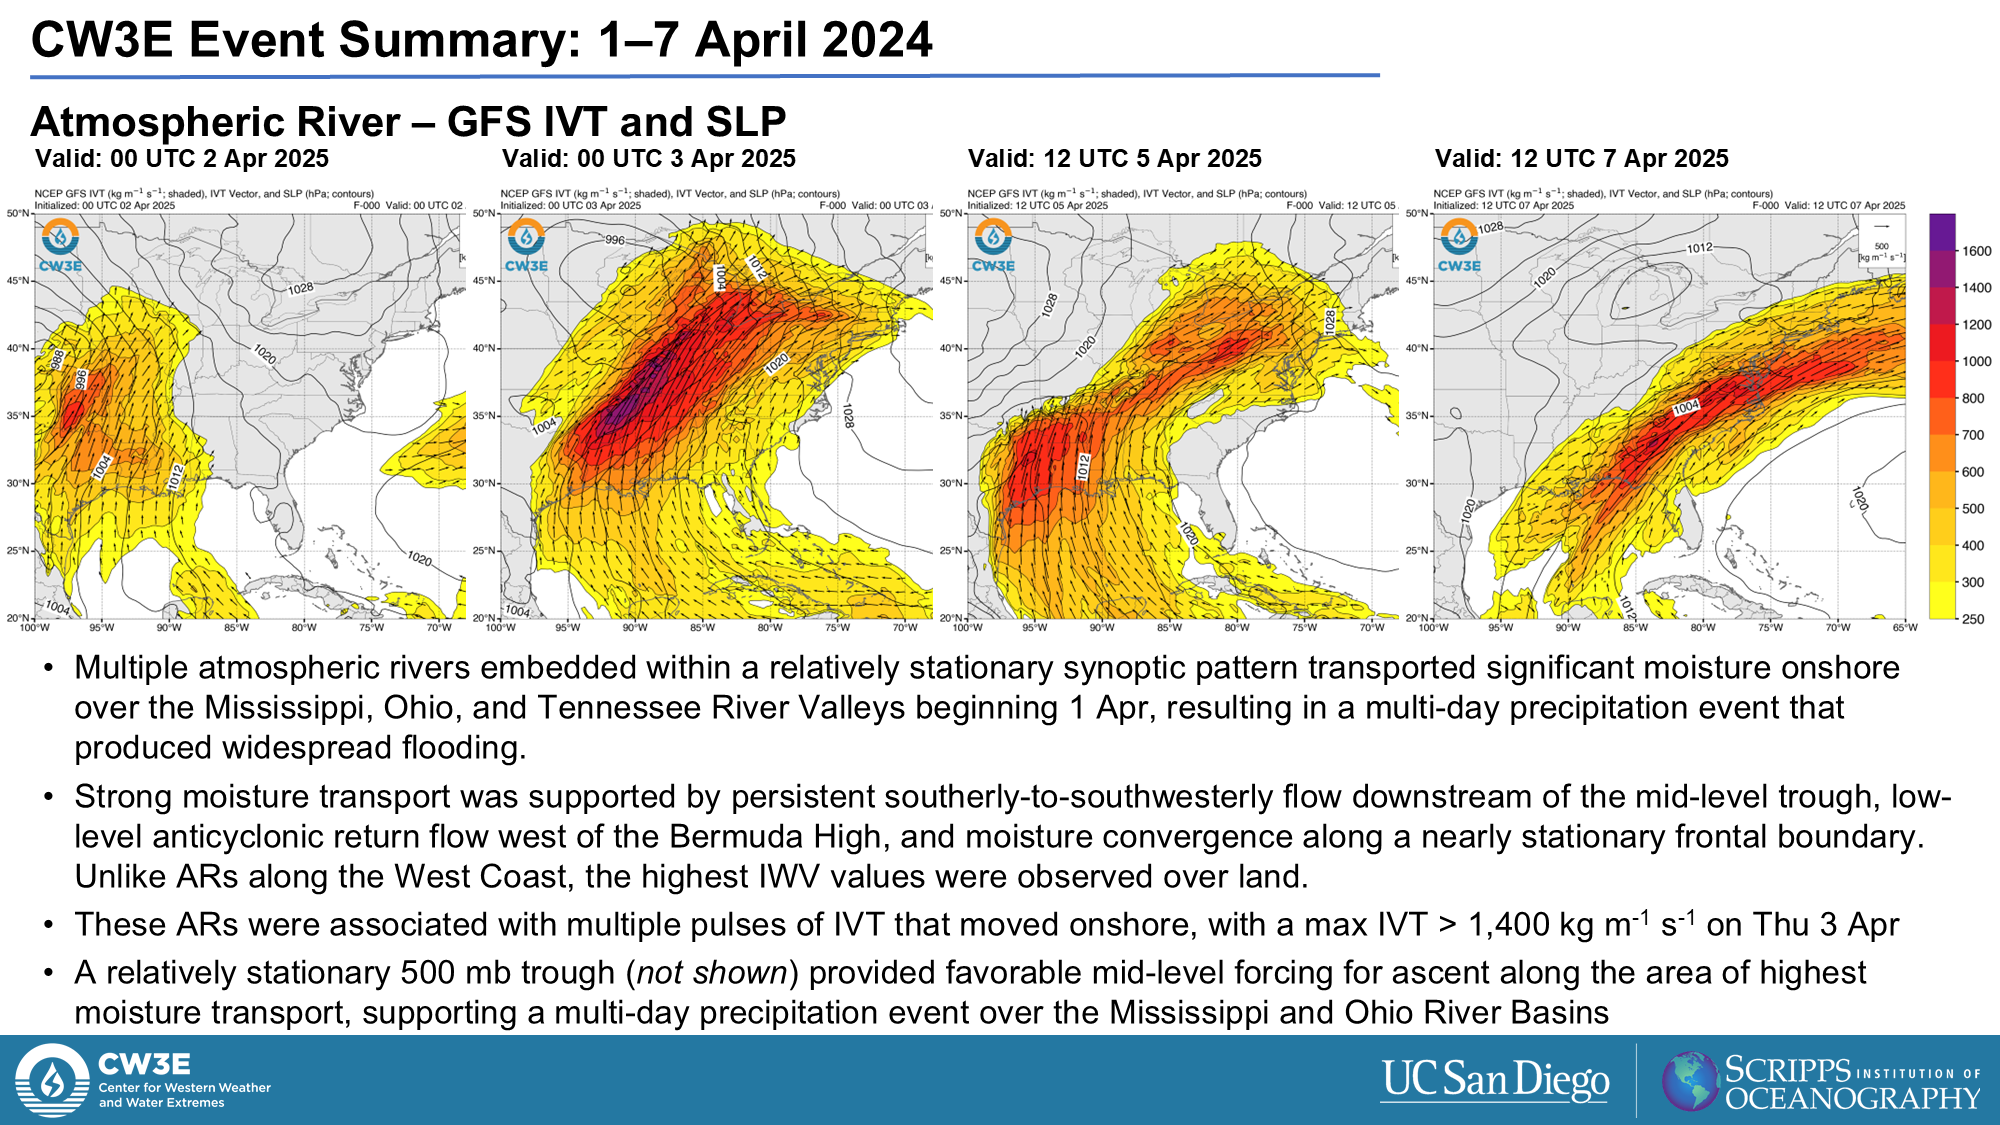
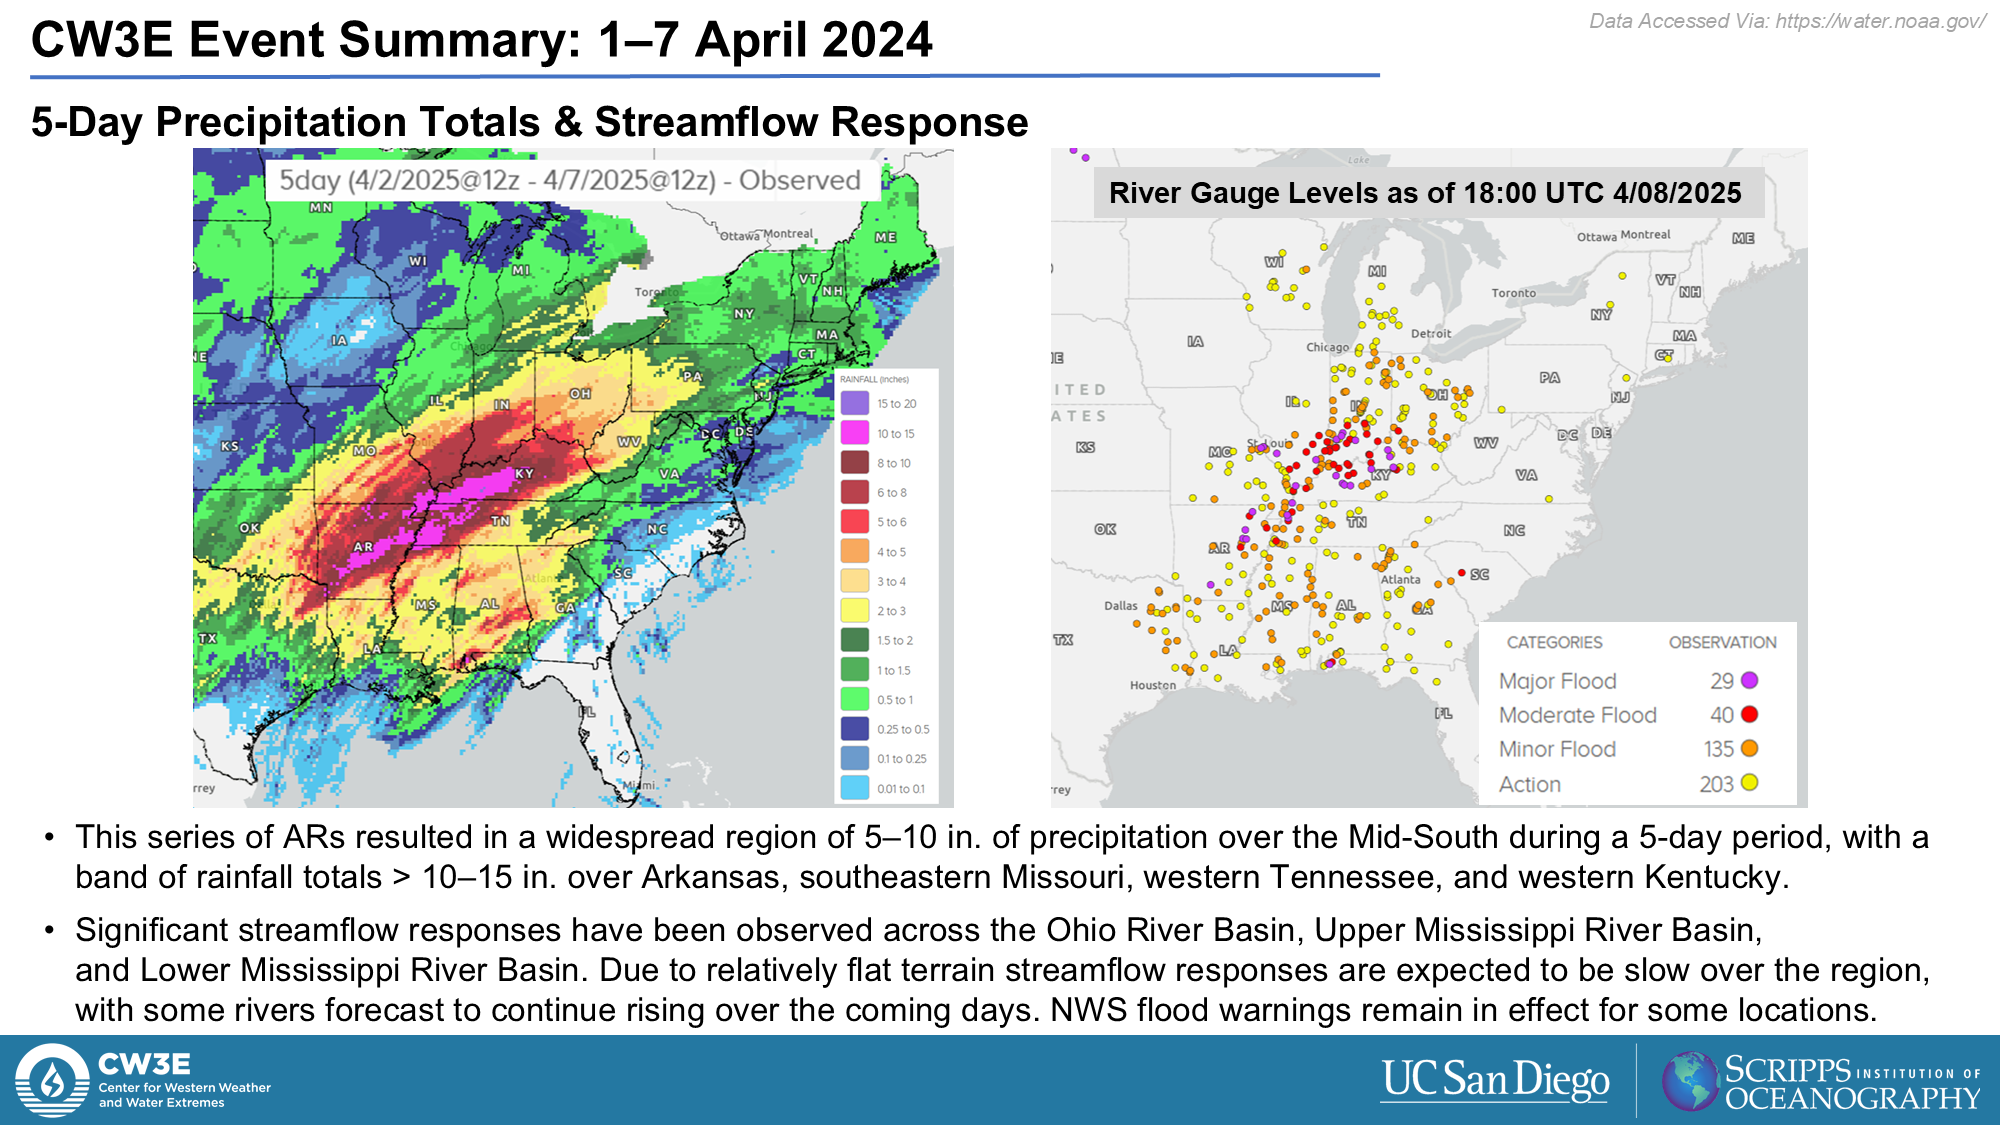
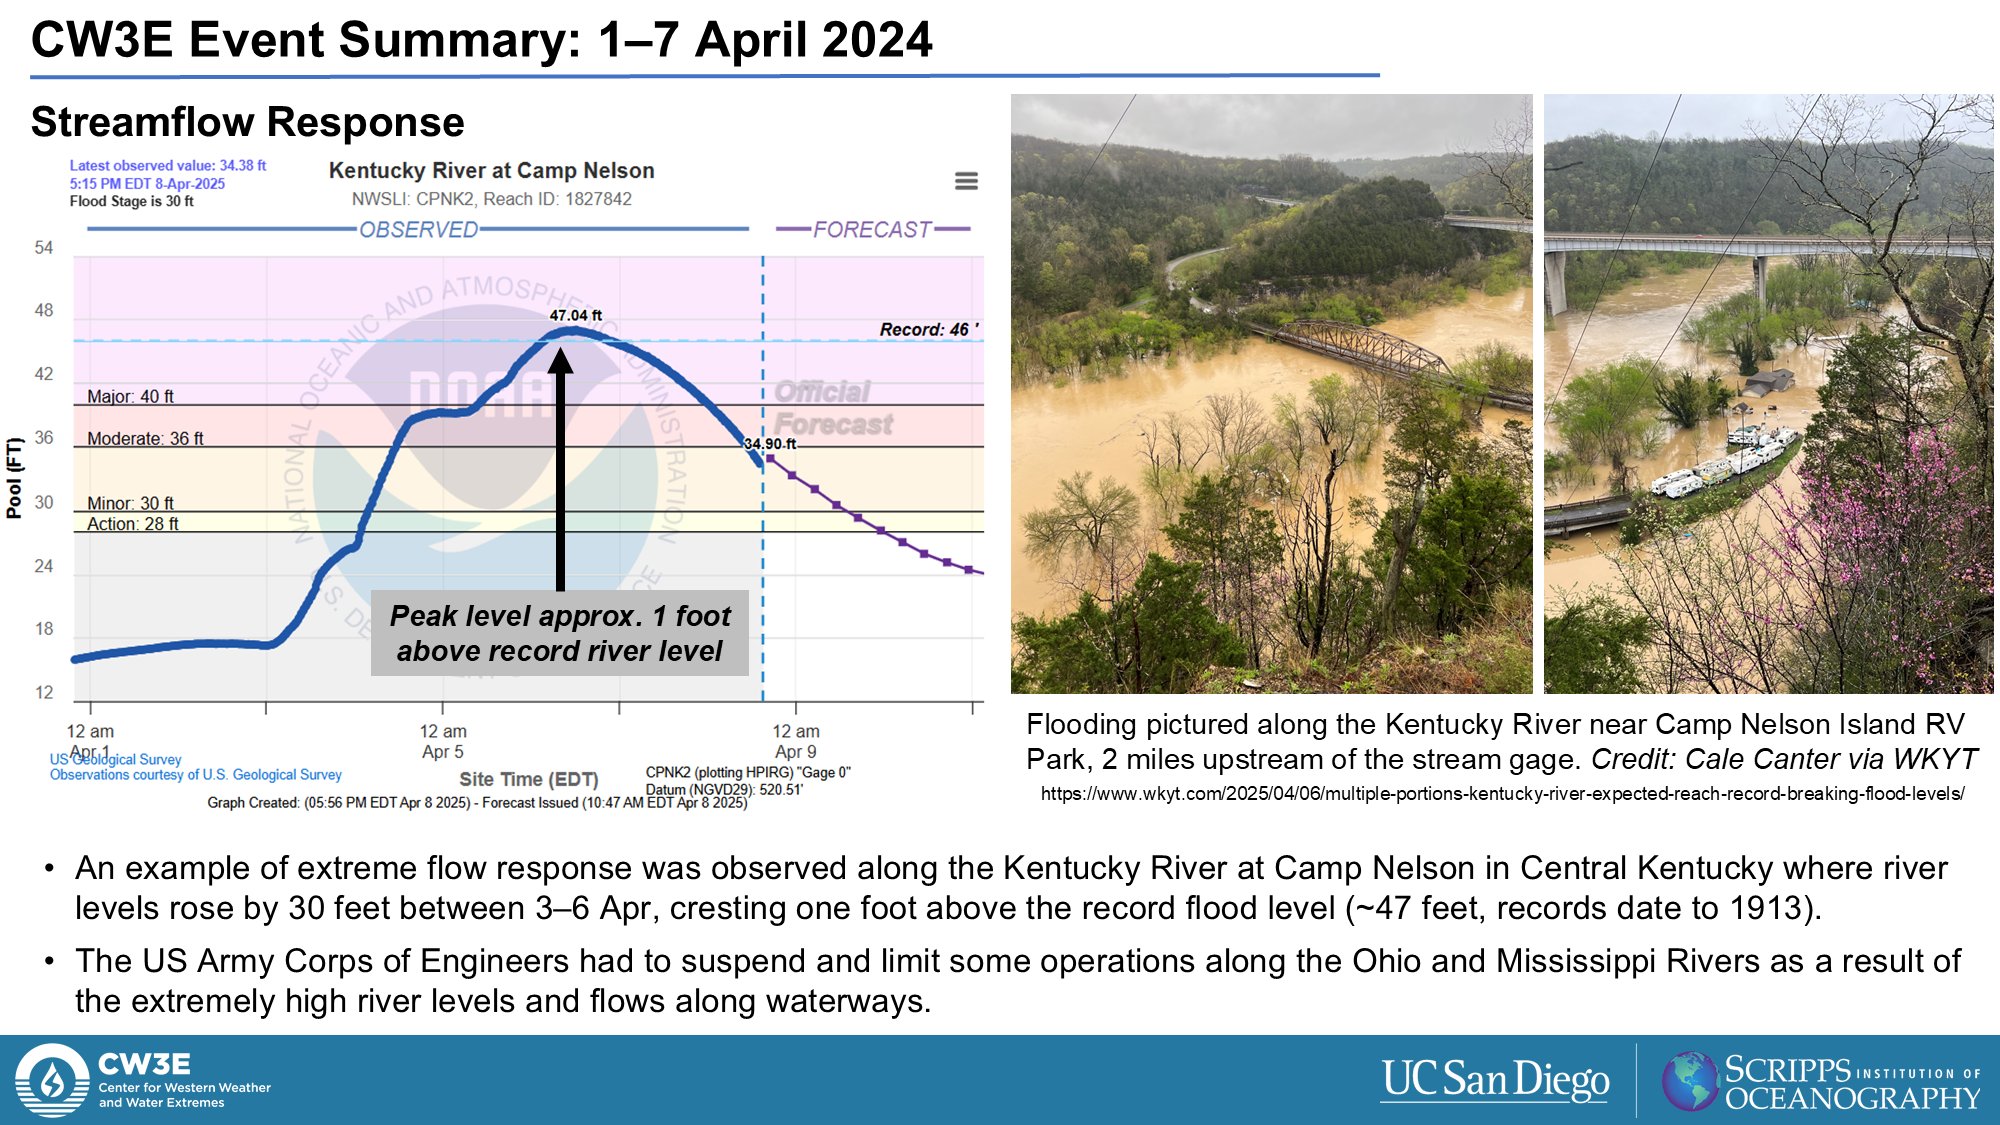
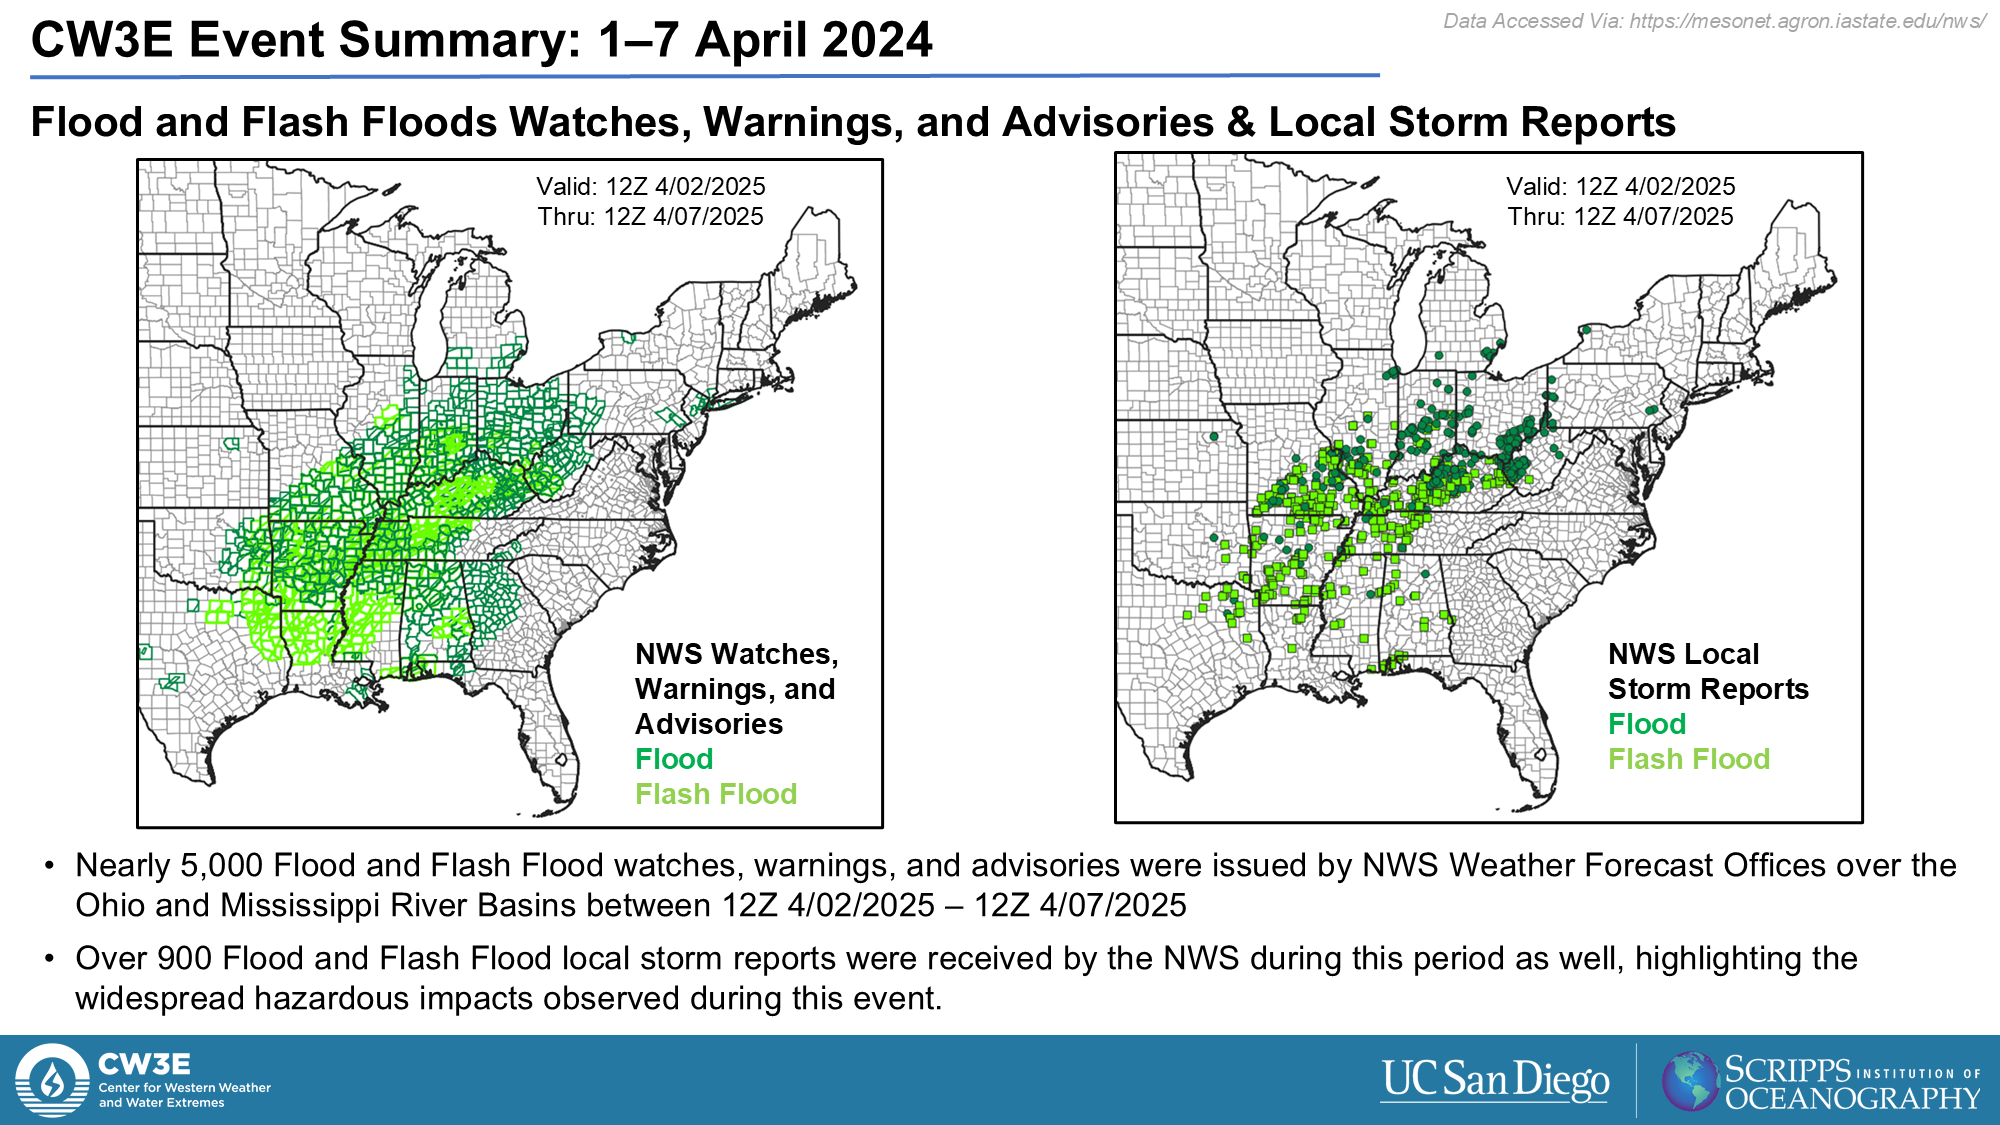
Media curiosity about atmospheric rivers (ARs) is also expanding. Last April, CNN meteorologist Mary Gilbert spoke to CW3E’s Dr. Jay Cordeira about the role atmospheric rivers played in recent flooding in the central US. The story, titled “This notorious West Coast phenomenon fueled historic floods in the East. Another one is on the way” highlights both the differences and the similarities of how ARs impact the East versus the West. Dr. Cordeira explains that while ARs are most often associated with the West Coast, they do occur regularly throughout the country, though typically with less severe impacts. However, as recent events show, it’s important to recognize that ARs may increasingly drive significant rainfall and flood risk in unexpected parts of the country.
In The New York Times article “One of the Weather World’s Biggest Buzzwords Expands Its Reach,” weather writer Amy Graff shares that while many meteorologists in the Midwest and East Coast are recognizing the role of ARs in extreme rainfall events, they are hesitant to use the term because of its West Coast connotation. Still, a shared vocabulary is intrinsic to effectively communicating weather to the public. Graff highlights the value of the Atmospheric River Scale, developed by Dr. Marty Ralph and colleagues/partners at CW3E, NWS, USGS, and CA-DWR, as a communication tool that helps differentiate between potentially destructive rainfall and beneficial freshwater delivery driven by ARs.
AR Recon, CW3E’s research and operations partnership with NOAA and the US Air Force, has recently been recognized by international press in the BBC’s article “How Megafloods in California Start in Japan.” Reporter Sophie Hardach interviewed Dr. Anna Wilson and Dr. Marty Ralph, as well as US Air Force’s Capt. Nate Wordal, about the expansion of AR Recon to include flights from Japan, in addition to Hawaiʻi and California. This new route increases the path of data collection as a storm moves eastward over the Pacific, improving forecasting accuracy, and ultimately, increasing the amount of time communities and water managers have to prepare for extreme rainfall.
A report from the U.S. Air Force Reserve’s 403rd Wing, “Hurricane Hunters Brief Lawmakers on Life-Saving Mission,” echoes the unique value of AR Recon as Lieutenant Colonel Steven Burton of the 53rd Reconnaissance Squadron, along with CW3E’s Dr. Anna Wilson and NOAA Corps officer Commander Kevin Doremus, explained to lawmakers on Capital Hill how the interagency partnership “saves lives, property, and taxpayer dollars.” The article notes that AR Recon is helping to expand the Hurricane Hunters mission beyond hurricanes, highlighting the growing understanding that AR research is a critical national priority.
While CW3E’s research expands national and international capacity to forecast, prepare for, and communicate extreme weather, the Center is also contributing to conversations on what climate resilience looks like here in San Diego. In early June, KPBS Midday Edition host Jade Hindman spoke with CW3E economist Dr. Tom Corringham in a panel discussion titled “How can our homes and communities be more resilient to climate change“. Corringham emphasizes the importance of using science to inform land use policy and development planning to adapt to climate change while explaining that we currently have several tools and strategies at our disposal ready to address the impacts of climate change on a local level.
Whether flying high above atmospheric rivers in the Western Pacific or working alongside communities in San Diego, CW3E demonstrates its commitment to turning research into impact through collaboration and innovative partnerships.