CW3E Publication Notice
Atmospheric River Families: Definition and Associated Synoptic Conditions
September 16, 2019
CW3E graduate student, Meredith Fish, along with co-authors Anna Wilson and Marty Ralph, published a paper in the Journal of Hydrometeorology entitled, “Atmospheric River Families: Definition and Associated Synoptic Conditions”.
Atmospheric rivers (AR) can cause flooding when they are strong and stall over an already wet watershed. While earlier studies emphasized the role of individual, long-duration ARs in triggering floods, it is not uncommon for floods to be associated with a series of ARs that strike in close succession. This study uses measurements from an atmospheric river observatory at Bodega Bay (BBY), in Northern California, to identify periods when multiple AR events occurred in rapid succession. Here, an AR “event” is the period when AR conditions are present continuously at BBY. An objective method is developed to identify such periods, and the concept of “AR families” is introduced.
During the period studied there were 228 AR events. Using the AR family identification method, a range of aggregation periods (the length of time allowed for ARs to be considered part of a family) were tested. For example, for an aggregation period of 5 days, there were 109 AR families, with an average of 2.7 ARs per family. Over a range of possible aggregation periods, typically there were 2-6 ARs per family.
Compared to single AR events, the synoptic environment of AR families is characterized by lower geopotential heights throughout the mid-latitude North Pacific, an enhanced subtropical high, and a stronger zonal North Pacific jet. Analysis of water year 2017 demonstrated a persistent geopotential height dipole throughout the North Pacific and a positive anomaly of integrated water vapor extending toward California. AR families were favored when synoptic features were semi-stationary.
Figure 1 shows the synoptic conditions associated with AR family conditions at BBY compared to a December – February climatology.
Figure 1: Composites of all 120-hour AR families at BBY, with anomalies shaded and DJF climatology in contour lines, of the following variables: A) 500-hPa geopotential heights (m), B) 250-hPa wind speed (m/s), C) 850-hPa geopotential heights (m), D) IWV (mm).
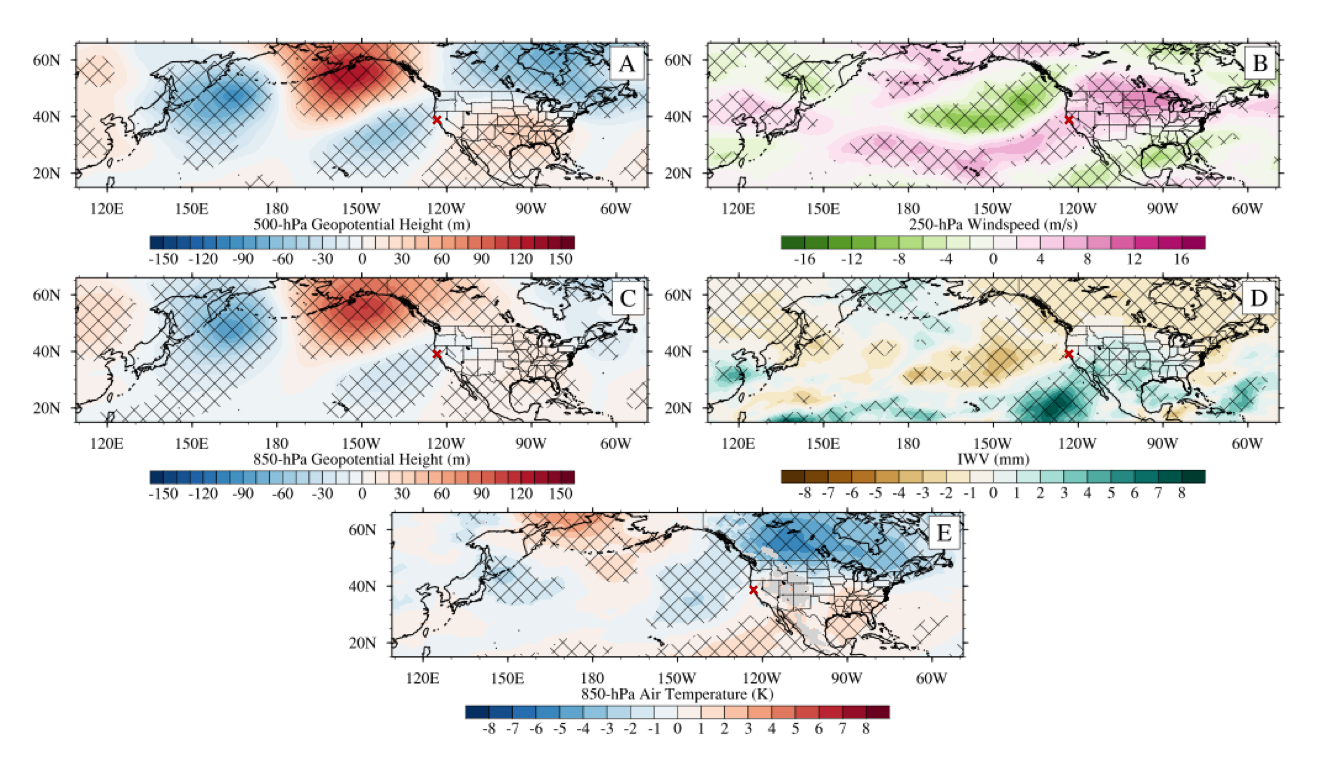
Figure 2 highlights WY 2017 and the Rossby wave train like conditions that were present during that WY leading to the largest number of AR families detected during this catalog.
Figure 2: Composites of the difference between WY 2017 AR families (n = 208 time steps) and AR families. Significance at 99% confidence marked by hatching. A) 500-hPa geopotential heights (m), B) 250-hPa wind speed (m/s), C) 850-hPa geopotential heights (m), D) IWV (mm), E) 850-hPa temperature (K).
Figure 3 shows an example of a notable AR family, making landfall in early February 2017. The culmination of these events coincided with the Oroville Dam incident in Northern California.
Figure 3: Time evolution of notable AR events in February 2017 showing the integrated water vapor transport, IVT (kg/m/s, colored contour) and 850-hPa geopotential heights (m, contour).
Figures are every 24 hours starting on 03 February 2017 at 0000 UTC to 10 February 2017 0000 UTC from left to right, top to bottom.
Fish, M.A, A.M. Wilson, F.M. Ralph: Atmospheric River Families: Definition and Associated Synoptic Conditions. J. Hydromet., doi:10.1175/JHM-D-18-0217.1


