CW3E Publication Notice
Genesis, Pathways, and Terminations of Intense Global Water Vapor Transport in Association with Large-Scale Climate Patterns
February 13, 2018
CW3E researchers Scott Sellars and Brian Kawzenuk and director Marty Ralph in collaboration with Phu Nguyen (UC Irvine) and Soroosh Sorooshian recently published a paper in Geophysical Research Letters titled Genesis, Pathways, and Terminations of Intense Global Water Vapor Transport in Association with Large-Scale Climate Patterns (http://onlinelibrary.wiley.com/doi/10.1002/2017GL075495/full). The study uses the CONNected objECT (CONNECT) algorithm applied to integrated water vapor transport (IVT) data for the period of 1980 to 2016 calculated from Modern-Era Retrospective analysis for Research and Applications version 2 (MERRA-2) to identify objects associated with extreme moisture transport (Sellars et al., 2013, 2015).
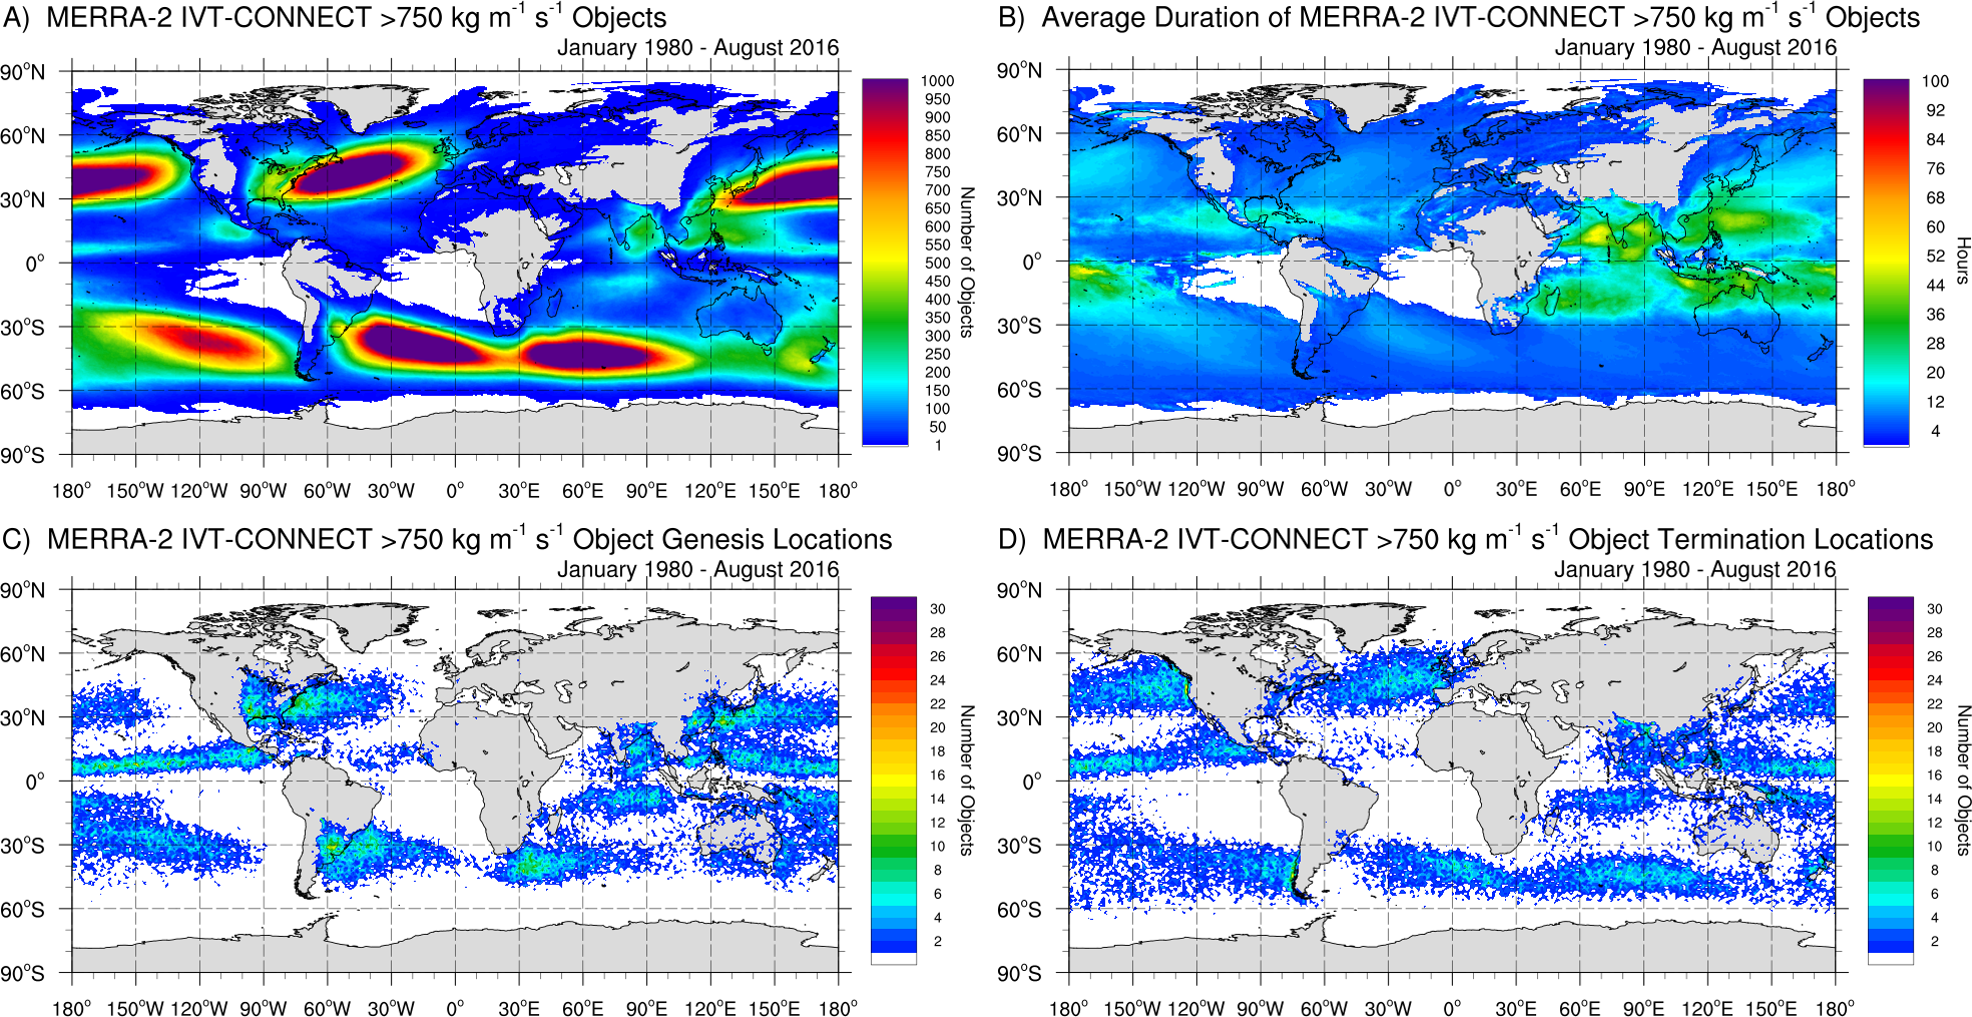
The algorithm generated a global dataset of life-cycle records in time and space of evolving strong water vapor transport events. Each object was associated with distinct physical and climatological features such as object size, location, and intensity, various climatological teleconnection patterns, and many other characteristics. This algorithm identified various weather phenomena associated with strong moisture transport such as atmospheric rivers, hurricanes and tropical cyclones, monsoon transport, and various other systems that produced extreme moisture transport. It was illustrated that these events typically occurred in five distinct regions located in the midlatitudes (off the coast of the southeast United States, eastern China, eastern South America, off the southern tip of South Africa, and in the southeastern Pacific Ocean) (Figure 1a). Additional analysis showed distinct genesis and termination regions and global seasonal peak frequency during Northern Hemisphere late fall/winter and Southern Hemisphere winter (Figure 1c and d). In addition, the frequency and location of these events were shown to be strongly modulated by the Arctic Oscillation, Pacific North American Pattern, and the Quasi-Biennial Oscillation. Moreover, a positive linear trend in the annual number of objects was reported, increasing by 3.58 objects year-over-year. The vast dataset produced in this study will be used for various future research opportunities focused on extreme moisture transport and its connection to large-scale climate dynamics.

Figure 1:(a) Total number of IVT objects from January 1980 to August 2016. (b) Average duration in hours of object at each grid cell. (c) The number of objects at genesis (starting) locations for all IVT objects. (d) The number of objects at termination (ending) locations for all IVT objects. The gray areas represent landmass.
