CW3E Publication Notice
The Gauging and Modeling of Rivers in the Sky
August 8, 2018
The first publication using dropsonde observations from the “Atmospheric River Reconnaissance” Program has just appeared in Geophysical Research Letters (Lavers et al. 2018). For a brief description of the AR Recon Program, which is co-led by CW3E’s Director, Marty Ralph, and NCEP’s Vijay Talapragada, with partners from NRL, ECMWF, NCAR and other universities, please see cw3e.ucsd.edu/atmospheric-river-reconnaissance-2018-underway/. This paper also represents the first product from an interagency team focused on step-by-step exploration of the impact of the dropsondes through data assimilation and modeling tests.
It is titled “The Gauging and Modeling of Rivers in the Sky.” The analysis was led by ECMWF’s David Lavers, a leader in AR research and applications from Europe, and formerly a Postdoctoral Scholar at CW3E. The other authors are Mark Rodwell, David Richardson, and Florian Pappenberger from the European Centre for Medium-Range Weather Forecasts (ECMWF), James Doyle and Carolyn Reynolds from the Naval Research Laboratory, Vijay Tallapragada of NOAA/NCEP/Environmental Modeling Center, and CW3E director Marty Ralph.
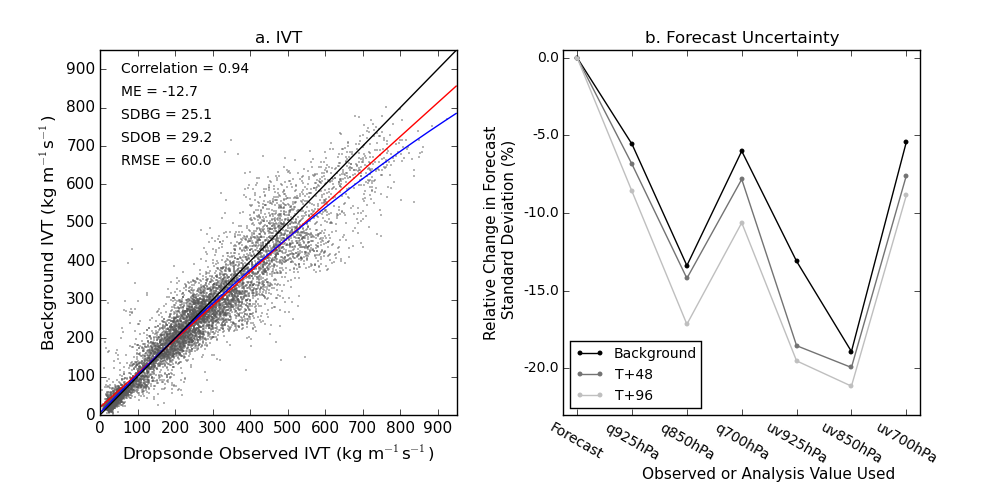
The research undertook a diagnostics study into how well the ECMWF Integrated Forecasting system represents atmospheric rivers (ARs). Using observations from 319 dropsondes released during the AR Reconnaissance 2018 (AR Recon) campaign, the structure of ARs was shown to be well captured in the model, but the short range water vapor flux errors were ~22% of the mean observed flux. These errors are most related to uncertainties in low-level winds near the top of the planetary boundary layer (Fig. 1). The study hypothesizes that improved initialization of the forecasts, and thus water vapor flux forecasts, may be possible via extra observations of low level winds and water vapor from proposed future targeted airborne dropsonde campaigns and space-based observations.

Figure 1. (Figure 4 from Lavers et al., 2018): Uncertainty in IVT forecasts. (a) Scatterplot of the IVT in the 25 Ensemble of Data Assimilations background and observed realizations at the 319 dropsondes (n=7975). The linear correlation, mean error (ME; forecast-observed), standard deviation of the background forecasts (SDBG), standard deviation of the perturbed observations (SDOB), and the root mean square error (RMSE) are given. The 1:1 line is given in black, the linear regression line is in red, and the second degree polynomial line is in blue. (b) The relative change in IVT forecast standard deviation (%) compared to the forecast when replacing the forecast specific humidity q or winds uv at 925, 850, and 700 hPa levels with the unperturbed observation or unperturbed analysis value from the ensemble forecast system.
Lavers, D.A., M.J. Rodwell, D.S. Richardson, F.M. Ralph, J.D. Doyle, C.A. Reynolds, V. Tallapragada, and F. Pappenberger, 2018: The Gauging and Modeling of Rivers in the Sky. Geophysical Research Letters. doi:10.1029/2018GL079019.
