
CW3E Releases Update to California Watershed Precipitation Forecasts
December 13, 2021
The Center for Western Weather and Water Extremes at the UCSD/Scripps Institution of Oceanography has updated its popular watershed precipitation forecasts as part of its interactive “Decision Support Tools” page. These forecasts focus on quantifying and illustrating the 10-day precipitation forecasts averaged for the 126 Hydrologic Unit Code 8 (HUC-8) watersheds in California from four numerical weather prediction models. These models include the deterministic and ensemble models of the National Centers for Environmental Prediction Global Forecast System and the European Centre for Medium-Ranged Weather Forecasts model.
The webpage now features enhanced interactivity over its predecessor with improved navigation, additional quantitative information, point-and-click interaction, and the addition of ensemble information. An example of the precipitation forecast from the ECMWF ensemble model for the Upper Yuba watershed from 13 December 2021 is shown below:
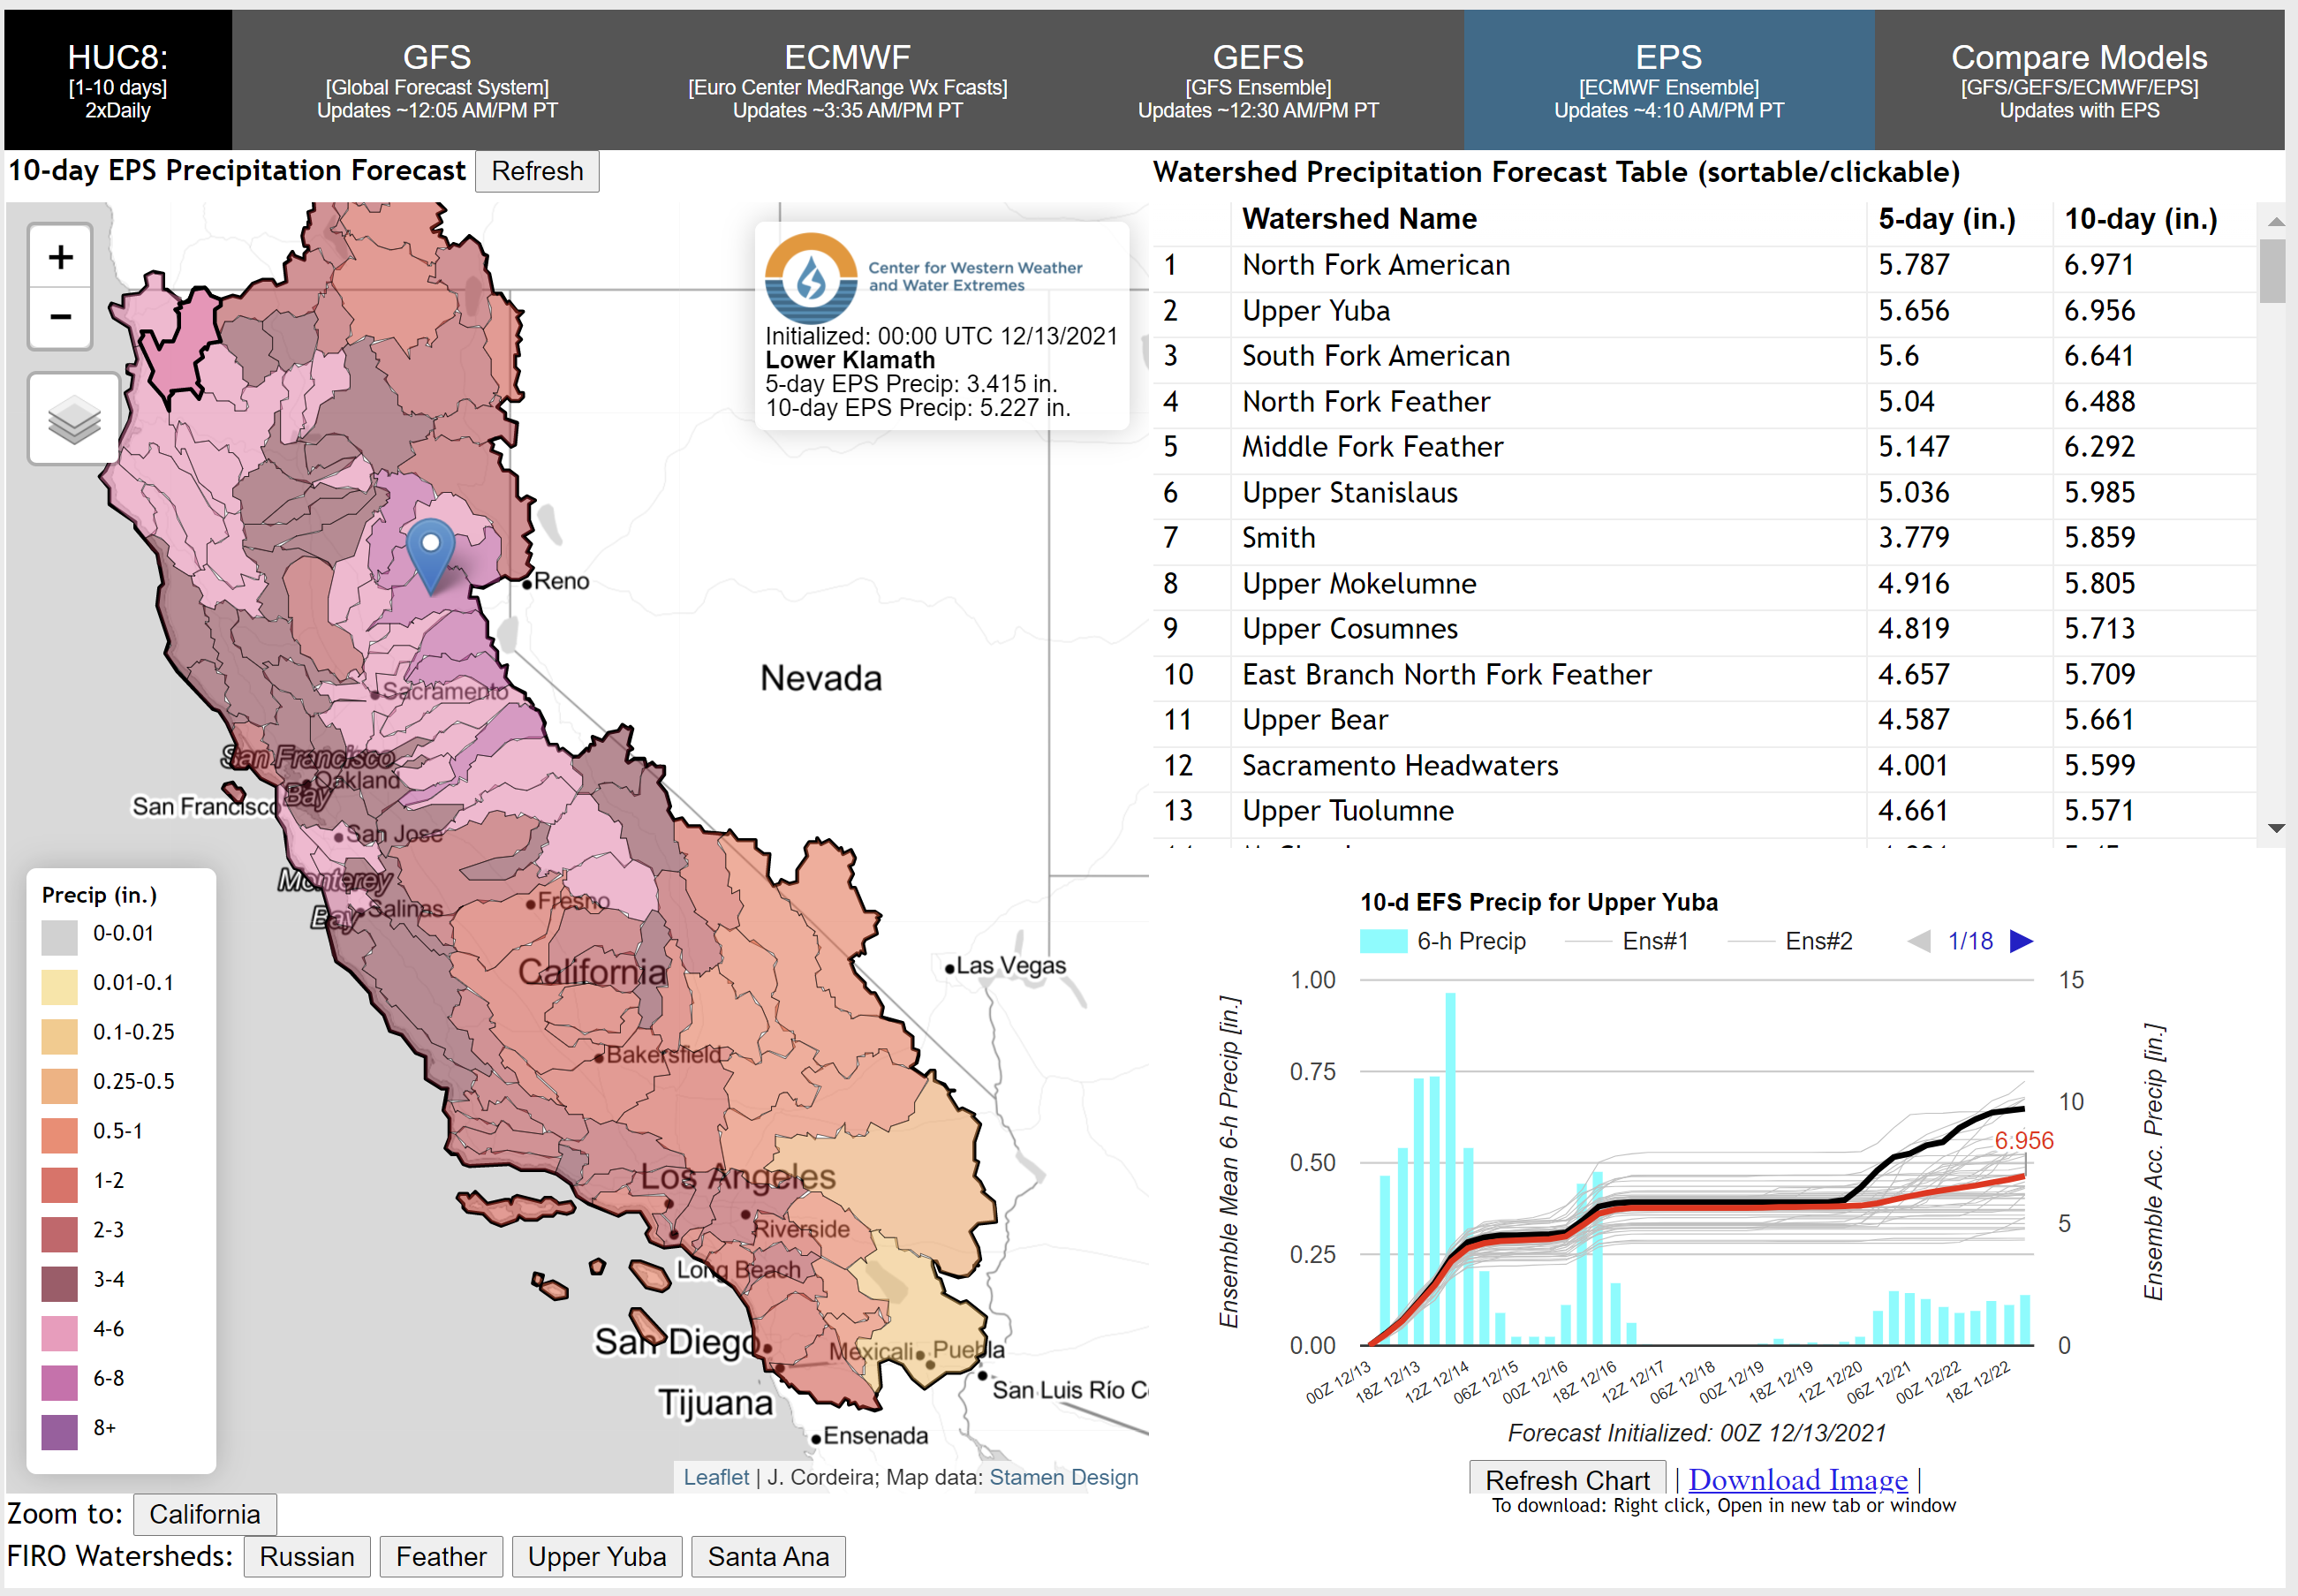
The left panel illustrates the 10-day watershed mean areal precipitation forecast from the ECMWF ensemble mean (in.; shaded according to scale, with an option to change this map to the 5-day precipitation). The upper-right panel contains a list of California watersheds sorted by their 10-day (or 5-day) precipitation; this table is sortable, clickable, and linked to the map. Selecting a watershed on the map or the table will generate a time series of the precipitation forecast for the watershed in the lower-right panel with the 6-h precipitation rate in blue ensemble accumulated precipitation drawn as gray lines, ensemble mean in red, and ensemble control in black.
The webpage also features a robust means of visualizing and comparing the GFS and ECMWF model ensemble forecasts of precipitation across watersheds and for a specific watershed. The addition of the multi-model full distributions of ensemble member forecasts will allow for an improved assessment of possible precipitation outcomes associated with landfalling atmospheric rivers and an increased awareness of the potential for extreme precipitation in California watersheds. The image below illustrates a overlapping comparison of the GFS and ECMWF forecasts for the Upper Yuba River watershed initialized at 0000 UTC on 13 December 2021:
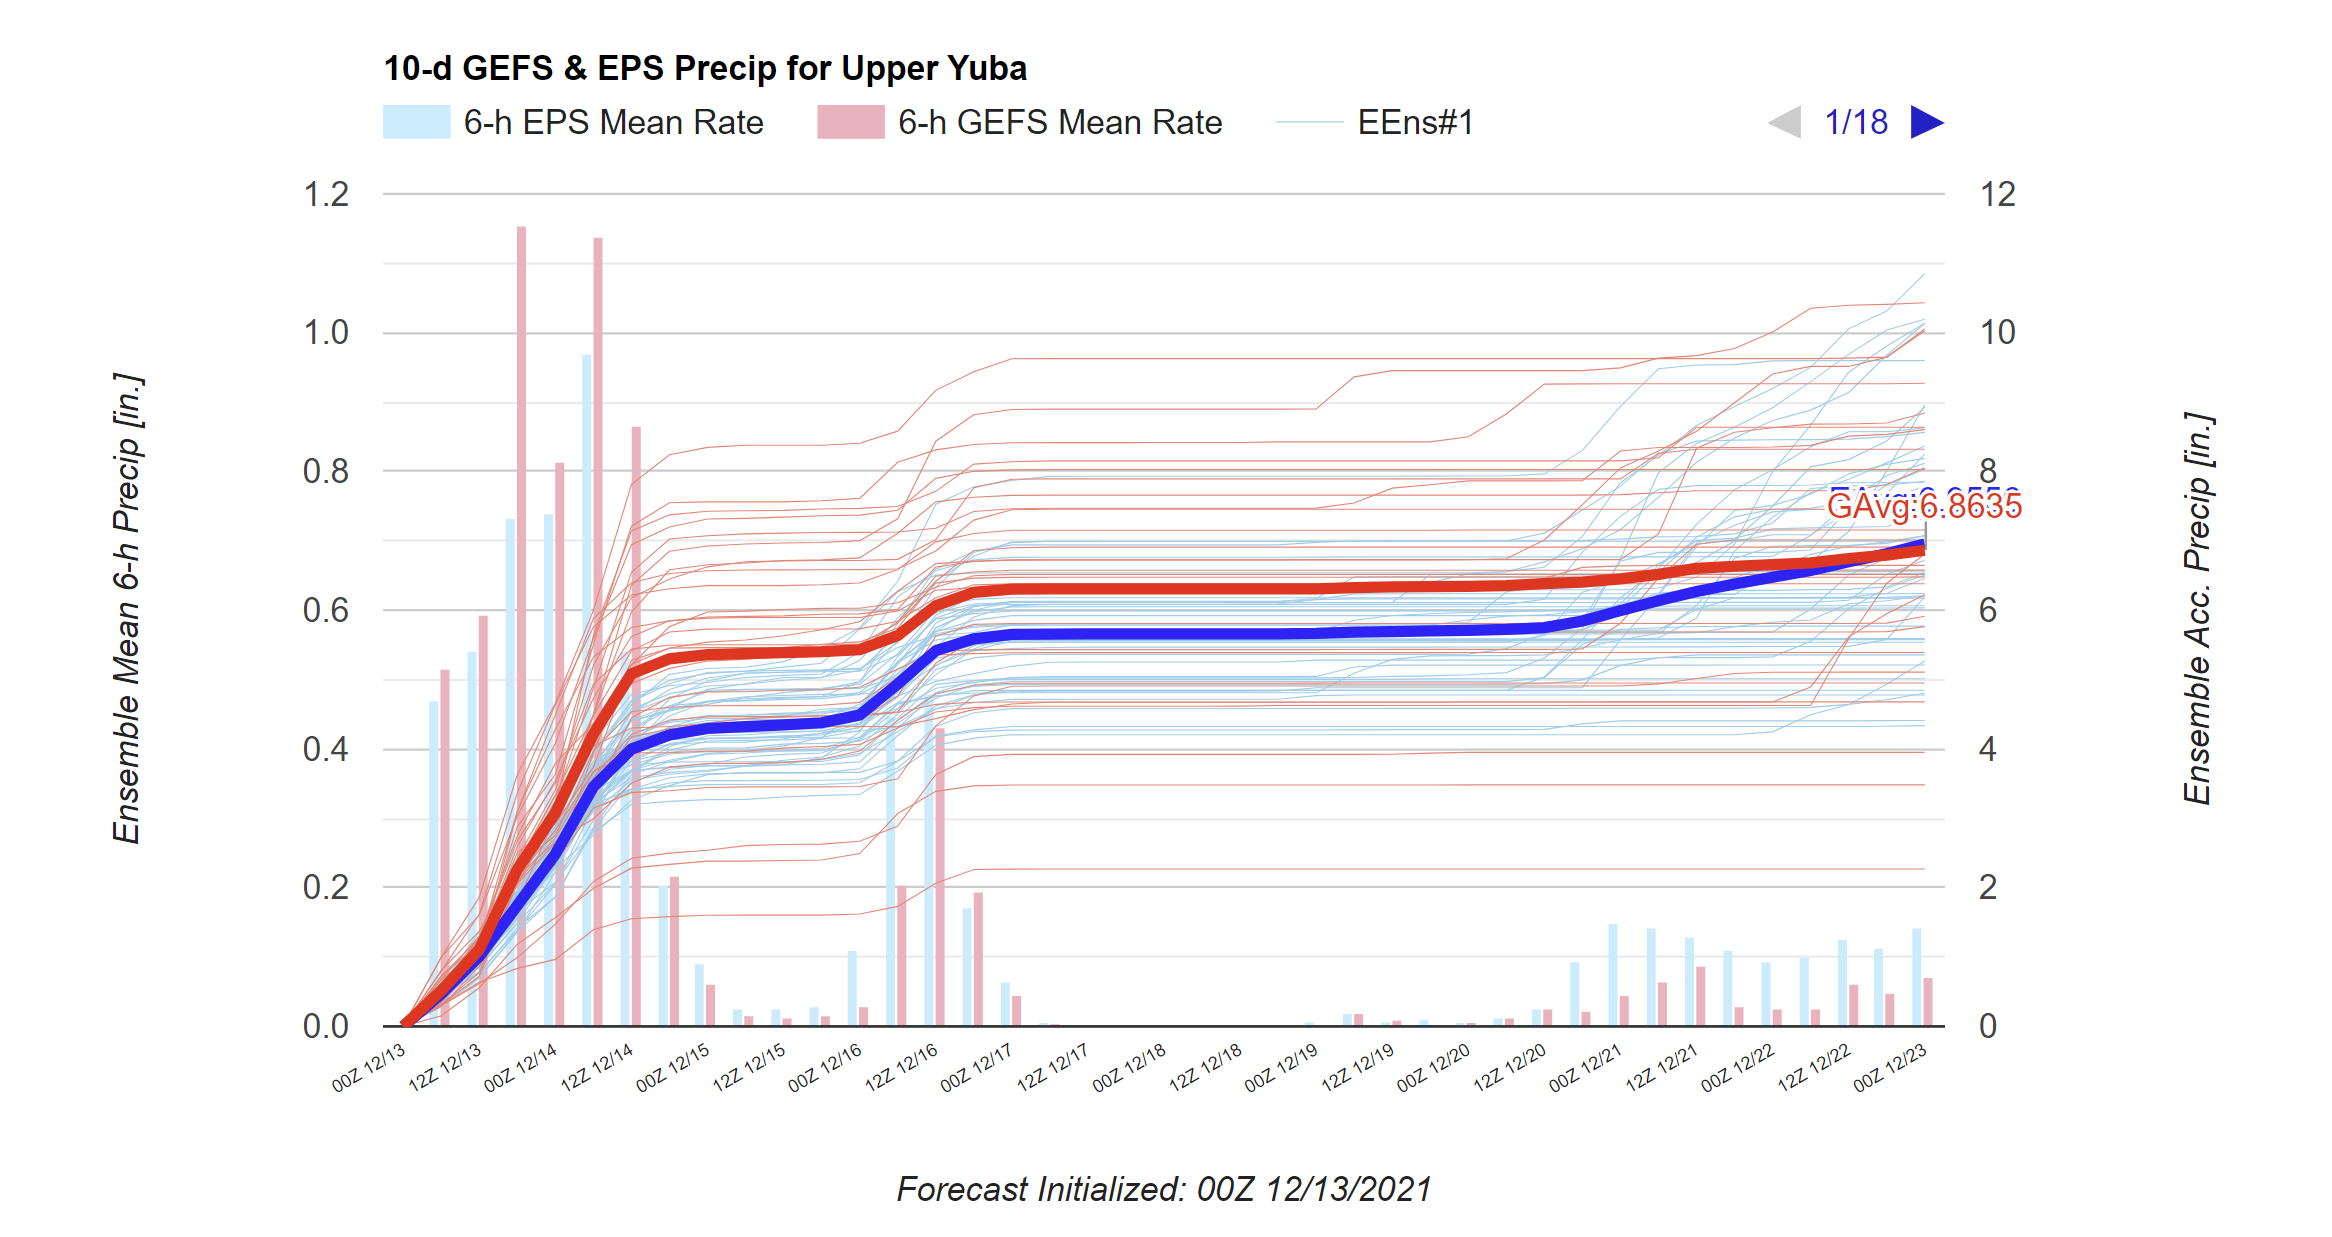
The chart illustrates the 10-day watershed mean areal precipitation forecast at the Upper Yuba River for the GFS (red) and ECMWF (blue) ensembles. Bars illustrate the six-hour precipitation on the left axis and lines illustrate the accumulated precipitation on the right axis, with the ensemble mean drawn as a thicker line with annotation.
The watershed analyses and forecasts produced by CW3E support atmospheric rivers research and applications with a key objective to produce forecasting and decision support tools that meet the needs of western U.S. forecasts, resource managers, and emergency managers. The development and maintenance of this specific set of tools is supported by the California Atmospheric Rivers Program.
Contact: Dr. Jay Cordeira | jcordeira@ucsd.edu