CW3E Event Summary: 17-22 December 2020

CW3E Event Summary: 17-22 December 2020

December 23, 2020

Click here for a pdf of this information.

Multiple storms impacted the Pacific Northwest over the Weekend and into Monday

  • The first event brought AR 1 conditions to far northwestern Washington as a decaying AR propagated down the coast from British Columbia
  • The second AR was stronger and lasted several days, bringing AR 3 conditions to Coastal Oregon
  • A mesoscale frontal wave developed along the second AR and resulted in an additional pulse of enhanced IVT and extended the overall duration of AR conditions
  • Several daily precipitation records were broken across the Seattle Metropolitan area where several both urban and river flooding was observed

MIMIC-TPW2 Total Precipitable Water

Valid 1200 UTC 17 December – 1700 UTC 22 December

Images from CIMSS/Univ. of Wisconsin

Click images to see loops of GFS IVT/IWV analyses

Valid 1200 UTC 17 December – 1200 UTC 22 December 2020


Summary provided by C. Hecht, C. Castellano, J. Kalansky, and F. M. Ralph; 23 December 2020

CW3E Publication Notice: Atmospheric river sectors: Definition and characteristics observed using dropsondes from 2014-2020 CalWater and AR Recon

CW3E Publication Notice

Atmospheric river sectors: Definition and characteristics observed using dropsondes from 2014-2020 CalWater and AR Recon

December 23, 2020

Alison Cobb, a postdoctoral scholar at CW3E, recently published a paper in Monthly Weather Review, along with CW3E co-authors Allison Michaelis, Sam Iacobellis, Luca Delle Monache and F. Martin Ralph, titled “Atmospheric river sectors: Definition and characteristics observed using dropsondes from 2014-2020 CalWater and AR Recon” (Cobb et al. 2020). This study contributes to the goals of CW3E’s 2019-2024 Strategic Plan to support Atmospheric River (AR) Research and Applications by furthering out understanding of AR dynamics. In particular, this work examines atmospheric measurements over the Pacific.

In this study, a unique set of 858 dropsondes deployed in lines transecting 33 ARs during CalWater and AR Recon field campaigns (2014-2020) are analyzed. Integrated vapor transport (IVT) is used to define five regions: core, cold and warm sectors, and non-AR cold and warm sides. The core is defined as having at least 80% of the maximum IVT in the transect. Remaining dropsondes with IVT > 250 kg m-1 s-1 are assigned to cold or warm sectors, and those outside of this threshold form non-AR sides. The mean widths of the three AR sectors are approximately 280 km. However, the core contains roughly 50% of all the water vapor transport (i.e., the total IVT), while the others each contain roughly 25%. A low-level jet occurs most often in the core and warm sector with mean maximum wind speeds of 28.3 and 21.7 m s-1, comparable to previous studies, although with heights approximately 300 m lower than previously reported. The core exhibits characteristics most favorable for adiabatic lifting to saturation by the California coastal range. On average, stability in the core is moist neutral, with considerable variability around the mean. A relaxed squared moist Brunt Väisälä frequency threshold shows ~8–12 % of core profiles exhibiting near-moist neutrality. The vertical distribution of IVT, which modulates orographic precipitation, varied across AR sectors, with 75% of IVT residing below 3115 m in the core.

The Cobb et al. (2020) study was the first of its kind to composite such a large dataset into different sectors of the AR. This analysis using only observations has revealed distinct characteristics across ARs when categorized into sectors based on IVT. There is symmetry across the AR in terms of TIVT, low-level jet wind speed, and lifting condensation level, but asymmetry in other diagnostics, including height of low-level jet and height below which 75 IVT is contained. Analyzing a large sample (858 dropsondes) has allowed for examination of the variability that is apparent in the ARs, rather than simply presenting mean characteristics, which have been reported in previous studies.

An important goal of AR observational campaigns is to retrieve data that will reduce forecast error and uncertainty in real-time. This study has shown the value of these observations to pure research, furthering the understanding of characteristics of ARs from observations. This simple technique for identifying sectors within an AR can be applied across a variety of studies, for example in forecast diagnostics and assessing model performance. Improvement in the forecast models would allow for better prediction of landfalling ARs that bring both beneficial and damaging precipitation to the U.S. West Coast. Results from this study can help to inform the sampling strategy of ARs, by further analyzing the sensitivity of forecasts to assimilation of dropsondes in different sectors, therefore helping to bridge the gap between observations and models. Following work also examines dropsondes in the sectors defined in this study to assess atmospheric reanalysis products, which is important as these are the closest we get to spatially homogeneous observations. This work supports ongoing collaborations involving CW3E, NOAA, NRL, U.S. Army Corps of Engineers, NCAR, and ECMWF.

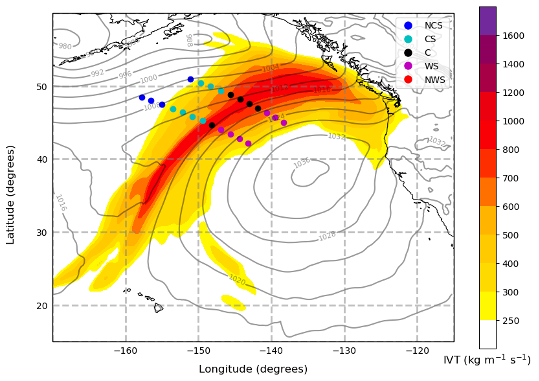
Figure 1. Locations of dropsondes deployed during IOP5 2020, centered around 00 UTC 5th February. Color of dots reflects sector of dropsonde (see legend). Non-AR cold side (NCS), AR cold sector (CS), AR core (C), AR warm sector (WS), non-AR warm side (NWS). ERA5 IVT at central time shown in colored contours and mean sea level pressure shown in grey contour lines.

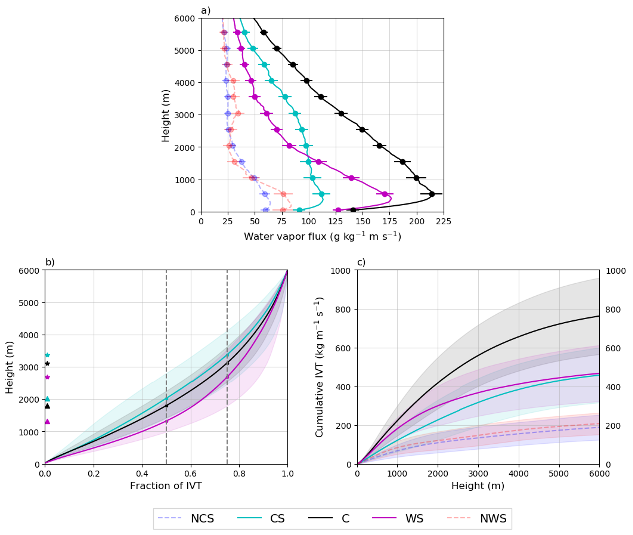
Figure 2. a) Composite vertical profiles of water vapor flux using 154 non-AR cold side, 197 cold sector, 247 core, 207 warm sector, 53 non-AR warm side dropsondes. 95% confidence interval shown at 500 m increments. b) Fraction of IVT for AR sectors (cold sector: CS, core: C, warm sector: WS). Mean shown in solid line and one standard deviation shown in shading. 0.5 and 0.75 fractions are shown in dashed vertical lines with the corresponding height value marked in triangles and stars on the y axis. c) Cumulative IVT with mean in solid line and one standard deviation in shading for all sectors.

Cobb, A., A. Michaelis, S. Iacobellis, F.M. Ralph, and L. Delle Monache, 2020: Atmospheric river sectors: Definition and characteristics observed using dropsondes from 2014-2020 CalWater and AR Recon. Mon. Wea. Rev., https://doi.org/10.1175/MWR-D-20-0177.1.

CW3E AR Update: 22 December 2020 Outlook

CW3E AR Update: 22 December 2020 Outlook

December 22, 2020

Click here for a pdf of this information.

Multiple storms forecast to bring precipitation to the Western U.S. over the next 7 days

  • An atmospheric river (AR) associated with a surface cyclone is forecast to make landfall along the U.S. West Coast on 25–26 Dec
  • A cutoff low may bring additional impacts to the southwestern U.S. on 28–29 Dec, but forecast uncertainty is currently high
  • The GFS and ECMWF are forecasting more than 2 inches of precipitation over portions of the Pacific Coast Ranges and Cascades during the next 7 days

Click images to see loops of GFS IVT & IWV forecasts

Valid 0000 UTC 22 December – 0000 UTC 30 December 2020


Probability of AR Conditions Along Coast: dProg/dt

Model Runs: 00Z 18 Dec 2020 – 00Z 22 Dec 2020 (every 12 h)


Summary provided by C. Castellano, J. Kalansky, and F. M. Ralph; 22 December 2020

*Outlook products are considered experimental

CW3E Publication Notice: A soil moisture monitoring network to assess controls on runoff generation during atmospheric river events

CW3E Publication Notice

A soil moisture monitoring network to assess controls on runoff generation during atmospheric river events

December 22, 2020

CW3E hydrologist Edwin Sumargo, CW3E affiliate Hilary McMillan, CW3E mesoscale modeler Rachel Weihs, CW3E field researcher Carly Ellis, CW3E field research manager Anna Wilson, and CW3E Director F. Martin Ralph published a paper in the Hydrological Processes, titled “A soil moisture monitoring network to assess controls on runoff generation during atmospheric river events” (Sumargo et al. 2020). As part of CW3E’s 2019-2024 Strategic Plan to support Forecast Informed Reservoir Operations (FIRO), CW3E researches the impacts of atmospheric rivers (ARs) on water management and public safety in order to improve the prediction capability. This study highlights the role of soil moisture in runoff generation from precipitation during AR events and the value-added for hydrologic model design and calibration. Ultimately, this work supports ongoing collaborations involving CW3E, California Department of Water Resources, NOAA, Sonoma Water, and the U.S. Army Corps of Engineers to improve streamflow predictions and develop situational awareness tools for FIRO at Lake Mendocino.

Soil moisture is a key modifier of runoff generation from rainfall excess. This paper presents a new and publicly available dataset from a soil moisture monitoring network in Northern California’s Russian River Basin (Fig. 1), designed to assess soil moisture controls on runoff generation under AR conditions. The observations consist of 2‐minute volumetric soil moisture at 19 sites and 6 depths (5, 10, 15, 20, 50, and 100 cm). We present short analyses of these data to demonstrate their capability to characterize soil moisture responses to precipitation across sites and depths, including time series analysis, correlation analysis, and identification of soil saturation thresholds that induce runoff. Our results show strong inter‐site Pearson’s correlations at the seasonal timescale (Fig. 2). Correlations are strong (>0.8) during events with wet antecedent soil moisture and during drydown periods, and weak (<0.5) otherwise. High event runoff ratios are observed when certain antecedent soil moisture thresholds are exceeded, and when antecedent runoff is high. Our analyses also indicate three ways in which soil moisture data are valuable for model design: (1) with multi‐depth sensors, statistical tests can be used to identify which depths show differences in soil moisture dynamics and, therefore, should be used by modelers to define distinct model layers; (2) time series analysis indicates the role of soil moisture processes in controlling runoff ratio during precipitation, which hydrologic models should replicate; and (3) analysis of decreases in soil moisture spatial correlation helps identify which areas of the watershed would benefit from a distributed calibration of model parameters related to soil moisture.

Figure 1. Terrain base maps showing the locations of RHONET soil moisture observations (left), including the HMT and CW3E stations within the Lake Mendocino sub‐basin (right). Also shown is a California map with pointers on Russian River basin and Bodega Bay ARO site (top left inset). The CW3E and United States geological survey (USGS) stream gauges are also shown, which are parts of the RHONET in the greater Russian River basin as well as within the Lake Mendocino sub‐basin. Orange contours delineate areas that drain into five CW3E stream gauges.

Figure 2. Pearson’s correlation maps of 2‐min soil moisture VWCn with BCC site at 10‐cm depth for (a) autumn (Oct–Dec), (b) winter (Jan–mar), (c) spring (Apr–Jun), and (d) summer (Jul–Sep) of WYs 2018–2019. The thick black contours demarcate the Lake Mendocino sub‐basin. The sites where the correlations are statistically significant at 99% significance level are outlined in black.

Sumargo, E., McMillan, H., Weihs, R., Ellis, C. J., Wilson, A. M., and Ralph, F. M. (2020). A soil moisture monitoring network to assess controls on runoff generation during atmospheric river events. Hydrologic Processes, e13998, https://doi.org/10.1002/hyp.13998.

CW3E Event Summary: 11-17 December 2020

CW3E Event Summary: 11-17 December 2020

December 18, 2020

Click here for a pdf of this information.

Active Weather Pattern Brings Multiple Episodes of Rain and Snow to the Western U.S.

  • Several ARs associated with a series of cyclones over the Northeast Pacific Ocean have impacted the Western U.S. during the past 7 days
  • These storms produced at least 2–5 inches of total precipitation in the Sierra Nevada, Cascades, and Pacific Coast Ranges, and lighter amounts across the Intermountain West
  • An estimated 1–3 feet of snow fell in the higher terrain of the Sierra Nevada, Cascades, and northeastern Nevada
  • Total water-year-to-date precipitation remains well-below normal across much of California

Click images to see loops of GFS IVT/IWV analyses

Valid 0000 UTC 11 December – 0000 UTC 18 December 2020


Summary provided by C. Castellano, C. Hecht, J. Kalansky, B. Kawzenuk, and F. M. Ralph; 18 December 2020

CW3E AR Update: 17 December 2020 Outlook

CW3E AR Update: 17 December 2020 Outlook

December 17, 2020

Click here for a pdf of this information.


Click images to see loops of GFS IVT & IWV forecasts

Valid 1200 UTC 17 December – 1200 UTC 27 December 2020


Summary provided by C.Hecht, C. Castellano, J. Kalansky, and F. M. Ralph; 17 December 2020

*Outlook products are considered experimental

Data Science Post-Doctoral Position at CW3E

Data Science Post-Doctoral Position

Center for Western Weather and Water Extremes (CW3E)

Scripps Institution of Oceanography, University of California San Diego

Location: La Jolla, California

To apply: Send CV, cover letter, and three references to Luca Delle Monache (ldm@ucsd.edu).

Deadline: Position is available immediately, but applicants will be considered until the position
is filled.

The Center for Western Weather and Water Extremes, (CW3E; cw3e.ucsd.edu) is a research and applications center established in 2014 at the Scripps Institution of Oceanography by its Director, Dr. F. Martin Ralph. CW3E focuses on the physical understanding, observations, and predictions of extreme weather and water events to support effective policies and practices to improve resilience in the Western U.S. CW3E carries out its goals with a diverse network of research and operational partners at several other institutions across the U.S. and internationally. Individuals will be joining a group of several existing Postdoctoral scholars and graduate students, and a number of experienced faculty, researchers, and staff at Scripps who are involved with CW3E. CW3E upholds UC San Diego Principles of Community and is working toward increasing diversity and equity in the Geosciences.

CW3E seeks a Postdoctoral researcher with a background in machine learning or computational science to develop novel methods for the prediction of precipitation and atmospheric river-related quantities (e.g., Integrated Water Vapor Transport – IVT) over the Western U.S., for weather (0-10 days) and subseasonal-to-seasonal (S2S; weeks to months) scales. The successful candidate will develop novel approaches based on machine learning, in combination with traditional postprocessing techniques, to significantly improve both deterministic and probabilistic predictions. Interpretable machine learning research is also a key focus of the work being carried out at CW3E, and various applications of this research are available for the successful candidate to work on.

Applicants should have 0-2 years of Postdoctoral experience or be nearing completion of their Ph.D. (estimated within 3 months) and be self-motivated and hard-working. Good written and verbal communication skills, including the ability to produce scientific publications and presentations and meet project milestones are required. Strong analytical backgrounds with a Ph.D. in computer science, atmospheric science, meteorology, climate science, hydrology, statistics, or environmental engineering is preferred. Programming experience working in a Unix environment with experience in scripting languages such as Python, R, or Matlab is highly desirable, along with experience using common machine learning software (Tensorflow, Keras, CNTK, PyTorch, Scikit-Learn, etc.) on cloud computing environments (AWS, Azure, etc.). Successful applicants should be comfortable working independently with large code libraries and databases, utilizing large meteorological data sets, and producing visualizations.

Per normal Postdoctoral appointment policies, all positions are envisioned as being initially for 1-year, with extension possible contingent upon performance and availability of funding. The University of California San Diego is an Affirmative Action / Equal Opportunity Employer (AA/EOE).

CW3E AR Update: 11 December 2020 Outlook

CW3E AR Update: 11 December 2020 Outlook

December 11, 2020

Click here for a pdf of this information.

Landfalling ARs to bring much-needed precipitation to Northern California

  • Multiple ARs will impact the U.S. West Coast during the next few days
  • AR 2 conditions (based on the Ralph et al. 2019 AR Scale) are forecast over portions of coastal California in association with the first landfalling AR, but the northwesterly orientation of the IVT vectors will limit precipitation amounts
  • About 1–3 inches of total precipitation are forecast over the Sierra Nevada, Northern California Coast Ranges, Oregon Coast Ranges, and Oregon Cascades during the next 72 hours
  • More than a foot of total snowfall is possible in the higher terrain of the Sierra Nevada

Click images to see loops of GFS IVT & IWV forecasts

Valid 1200 UTC 11 December – 1200 UTC 14 December 2020


Summary provided by C. Castellano, J. Cordeira, J. Kalansky, and F. M. Ralph; 11 December 2020

*Outlook products are considered experimental

CW3E AR Update: 7 December 2020 Outlook

CW3E AR Update: 7 December 2020 Outlook

December 7, 2020

Click here for a pdf of this information.

Multiple AR landfalls possible along the U.S. West Coast during the next 7 days

  • An AR over the Northeast Pacific Ocean will bring a period of AR conditions to southern British Columbia and Washington today and tomorrow
  • AR 2/AR 3 conditions (based on the Ralph et al. 2019 AR Scale) are forecast over coastal Washington in association with this landfalling AR
  • More than 2 inches of precipitation are possible across the Olympic Peninsula and North Cascades
  • A second AR may impact the U.S. West Coast this weekend, but forecast uncertainty is still very large

Click images to see loops of GFS IVT & IWV forecasts

Valid 1200 UTC 7 December – 1200 UTC 14 December 2020


Summary provided by C. Castellano, C. Hecht, J. Kalansky, B. Kawzenuk, and F. M. Ralph; 7 December 2020

*Outlook products are considered experimental

CW3E Welcomes Matthew Simpson

CW3E Welcomes Matthew Simpson

December 5, 2020

Matthew Simpson joined CW3E as a Ph.D. atmospheric scientist in December 2020. He received his Ph.D. from NC State University where he studied the dynamics of pollution transport in the marine boundary layer and the effects of urban land use on sea breeze induced precipitation.

After college, Matthew worked at Lawrence Livermore National Laboratory (LLNL) for 13 years utilizing numerical weather prediction and atmospheric transport models for national security applications. In addition, he participated in numerous research studies to improve wind and solar resource forecasting in California. A key area of research focus for Matthew at LLNL was applying ensemble-based techniques to improve weather prediction via uncertainty quantification.

Matthew’s interest in meteorology began as a child when Hurricane Hugo passed through Charlotte, NC. He learned that the weather can be both beautiful and dangerous. Over time, he developed the philosophy to enjoy the natural beauty of weather while using science and creativity to predict and mitigate the dangerous side. Matthew looks forward to supporting CW3E by using his atmospheric modeling experience to improve real-time atmospheric river forecasting, generate high-resolution data sets of historical weather conditions, and to support research projects focusing on improving hazardous weather prediction.

In his spare time, Matthew enjoys hiking and exploring the forests and deserts of the amazing American Southwest.