CW3E Hosts Collaborative Outreach and Research Event at Scripps Pier

CW3E Hosts Collaborative Outreach and Research Event at Scripps Pier

June 30, 2025

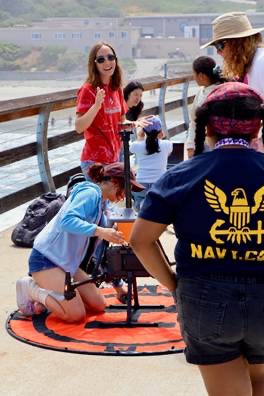
Figure 1. Bridget McNamara and the drone team demonstrate the instrumentation setup on the drone to the students prior to the flight.

On the 21st of May 2025, CW3E staff successfully hosted a dynamic outreach and research event at the Scripps Pier, bringing together university researchers, private-sector partners, and young students for a day of hands-on learning and scientific collaboration.

Participants included UCSD engineering students Julia Lee, Eric Limonadi, Bridget McNamara, and Cindy Tran, advised by SIO researcher Dr. Jooil Kim; SIO Professor Jennifer Haase and her research group; Windborne Systems engineers Jake Spisak and Nathan Kaplan; and approximately 70 fifth-grade students from Chollas Meed Elementary School. This outreach event was part of CW3E’s ongoing collaboration with Earthlab, a UCSD Community Station led by Groundwork San Diego and supported by the UCSD Center on Global Justice. The program aims to provide students hands-on exposure to the research conducted by CW3E and its partners. Windborne Systems has been a partner in CW3E’s Atmospheric River Reconnaissance Research and Operations Partnership for several years, and this marks the first time that we have conducted simultaneous data collection. CW3E has been a close collaborator with Dr. Haase and her research group, who conducted experimental atmospheric profiling measurements (humidity, temperature, and pressure) using a stationary GPS-based instrumentation at the nearby Scripps Munk Laboratory building to compare to the radiosonde measurements. The collaboration with Dr. Kim and the UCSD senior engineering students developed out of a previous radiosonde launch demonstration conducted for an SIO course, a previous outreach event. The presence of multiple research groups and cutting-edge technologies created a unique opportunity for elementary students to engage with real-world science. By interacting directly with scientists, engineers, and graduate students, the students gained a deeper appreciation for the collaborative nature of atmospheric research and hopefully got introduced to potential STEM career paths.

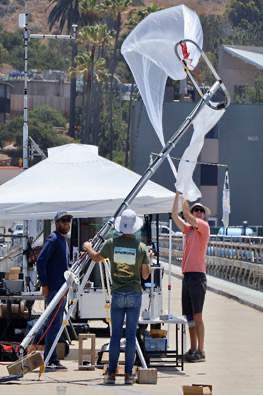
Figure 2. Ethan Morris, Nathan Kaplan, and Jake Spisak preparing for a dual radiosonde payload launch on the Windborne weather balloon.

In close collaboration with Windborne Systems and Dr. Kim’s team, CW3E executed a full schedule of radiosonde and drone launches to showcase various methods of atmospheric observation techniques (Fig. 1). The event featured four rounds of weather balloon launches: two led by CW3E, one led by Windborne, and the final coordinated launch by both teams (Fig. 2). Several of these launches included dual payloads of Windborne sensors and CW3E Vaisala radiosondes. Simultaneously, Dr. Kim’s team deployed a drone equipped with sensors to measure wind speed and direction to conduct intercomparison studies of near-surface wind measurements, demonstrating the integration of emerging technologies in meteorological research.

The elementary students participated in interactive tours highlighting the various teams’ instruments and related research, including a tour of the stationary weather station on the Scripps Pier. Student groups also enjoyed activities at the tide-pools on the beach adjacent to the Scripps campus. Many of the students were able to participate (hands-on) in the weather balloon launches, while all were able to view the data being transmitted in real-time from these launches.

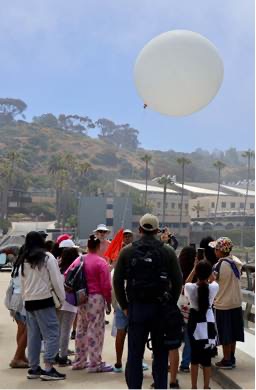
Figure 3. CW3E and Windborne staff demonstrate CW3E Vaisala radiosonde launch to students.

The elementary students participated in interactive tours highlighting the various teams’ instruments and related research, including a tour of the stationary weather station on the Scripps Pier. Student groups also enjoyed activities at the tide-pools on the beach adjacent to the Scripps campus. Many of the students were able to participate (hands-on) in the weather balloon launches, while all were able to view the data being transmitted in real-time from these launches.

In total, seven Scripps staff participated in this outreach event, including Subin Yoon, Ethan Morris, Samuel Bartlett, Suma Bhanu Battula, and Yazmina Rojas Beltran from CW3E, and Valeria Gutierrez Carrillo and Carlene Burton from Scripps (Fig. 4).

The event displayed the collaborative nature of scientific research, bringing together multiple teams from across disciplines and institutions, all the while engaging the fifth-grade students.

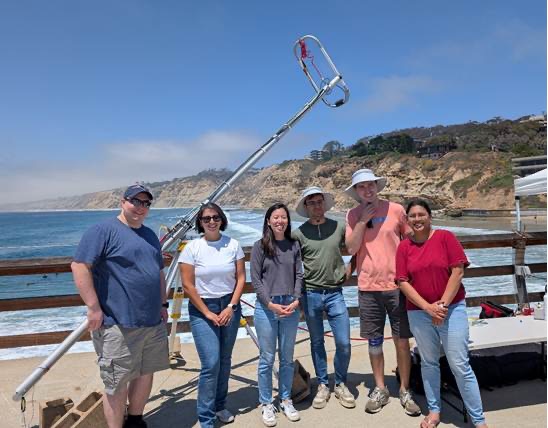
Figure 4. Sam Bartlett, Yazmina Rojas Beltran, Subin Yoon, Nathan Kaplan, Jake Spisak, and Suma Battula photographed after the last launch of the event.

CW3E Publication Notice: Synthetic ensemble forecasts: operations-based evaluation and inter-model comparison for reservoir systems across California

CW3E Publication Notice

Synthetic ensemble forecasts: operations-based evaluation and inter-model comparison for reservoir systems across California

June 18, 2025

A new article, “Synthetic ensemble forecasts: operations-based evaluation and inter-model comparison for reservoir systems across California,” by Zach Brodeur (Cornell University), Will Taylor (University of California – Davis), Jon Herman (University of California – Davis), and Scott Steinschneider (Cornell University), has been published in Water Resources Research, a journal of the American Geophysical Union.

This work represents a key milestone in the ongoing collaboration between Cornell University, the University of California – Davis, CW3E, NOAA/NWS, USACE, and regional water agencies to integrate synthetic forecasting into FIRO. It directly supports the FIRO: Resilient Water Management priority outlined in CW3E’s 2025-2029 Strategic Plan (CW3E, 2025).

Building on Brodeur et al. (2024), this study further develops the emerging field of synthetic ensemble forecasting, a powerful approach that generates realistic ensemble forecasts that mimic the skill of existing hindcasts anywhere that streamflow data are available. This strategy addresses critical data availability and length limitations associated with existing hindcasts, and it has been highlighted as an important technology for improved robustness testing of FIRO control alternatives in recent viability assessments (Ralph et al. 2023, 2025).

The study makes three core contributions:

  1. A new, computationally efficient synthetic ensemble forecasting strategy
  2. A novel reservoir operations-based validation framework to evaluate whether a synthetic forecasting strategy is fit for purpose
  3. A demonstration of the generalizability of the newly developed synthetic forecasting strategy across a range of California reservoir systems with varying hydrologic and operational characteristics

A key innovation in the study is the fitness-for-purpose validation framework, illustrated in Figure 1. In this approach, a FIRO operations model is driven with many samples of synthetic ensemble streamflow forecasts, creating an ensemble of operational outcomes (e.g., reservoir storage and release series). These outcomes are then compared – using ensemble verification techniques – to a baseline trace generated by driving the operations model with the native hindcast. This validation enables a quantitative assessment of the suitability of a synthetic forecasting approach for operations-based risk analysis, focusing on outcomes that matter most to water managers and stakeholders.

Figure 1. The operations-based validation framework forwarded in this work. From Figure 1 in Brodeur et al. (2025).

The new synthetic forecasting strategy, referred to as ‘syn-M2’ in the figures below, significantly improves streamflow forecast verification performance over the earlier method (syn-M1) presented in Brodeur et al. (2024), while significantly reducing computation time (Figure 2). This advancement enables broader application in complex, multisite FIRO scenarios envisioned for Phase III of the FIRO initiative (CW3E, 2025).

Figure 2. Forecast verification comparisons at Oroville Dam between synthetic forecasting methods 1 and 2 (syn-M1, syn-M2). a-b) Cumulative rank histograms, c-d) binned spread-error (BSE) diagrams. From Figure 3 in Brodeur et al. (2025).

Moreover, the operations-based validation framework demonstrates that the new synthetic forecasting method (syn-M2) outperforms the original approach (syn-M1) in terms of reservoir simulation outcomes (Figure 3). For instance, not only does the ensemble of release series based on the newer method better encapsulate the release series based on the hindcasts (Figure 3a,b), but probability-integral-transform (PIT) diagrams (Figure 3c) and reliability diagrams (Figure 3d) both show the new method comes closer to ideal ensemble behavior (indicated by proximity to the 1:1 line). These results highlight that the new synthetic forecasting method exhibits a high degree of reliability when translated to FIRO-based operational outcomes, underscoring its potential for systems-based risk analysis.

Figure 3. Operations-based validation performance between synthetic forecasting methods at Oroville Dam. a-b) Reservoir release series around the 1997 flood, c) probability-integral-transform (PIT) for top 1% of inflows (n ~ 100 events) and reliability statistic (πrel), d) reliability diagram for non-zero releases based on the 99th percentile release threshold (R99) and reliability component of the Brier Score (BSrel). From Figure 4 in Brodeur et al. (2025).

The study shows that forecast-informed reservoir operations based on the new synthetic forecasting method perform well across a diverse set of California reservoirs (Prado Dam, Lake Mendocino, New Hogan Lake, New Bullards Bar, Oroville Dam), highlighting the method’s generalizability. These results underscore not only the value of continued refinement of synthetic ensemble forecasting technology, but also signal that these approaches have matured to a point where they can be integrated into ongoing and future FIRO viability assessments and water control manual updates.

Brodeur, Z. P., Delaney, C. , Whitin, B., & Steinschneider, S. (2024). Synthetic forecast ensembles for evaluating Forecast Informed Reservoir Operations. Water Resources Research, 60(2), e2023WR034898. https://doi.org/10.1029/2023WR034898

Brodeur, Z. P., Taylor, W., Herman, J. D., & Steinschneider, S. (2025). Synthetic ensemble forecasts: Operations‐based evaluation and inter‐model comparison for reservoir systems across California. Water Resources Research, 61(6), e2024WR039324. https://doi.org/10.1029/2024WR039324

CW3E. (2025). 5-year Strategic Plan: 2025-2029, Center for Western Weather and Water Extremes. Center for Western Weather and Water Extremes (CW3E) – Scripps Institute of Oceanography, University of California – San Diego. https://cw3e.ucsd.edu/wp-content/uploads/CW3E_Strategic_Plan_2025.pdf

Ralph, F. M., Hutchinson, A., Anderson, M., Fairbank, T., Forbis, J., Haynes, A., Sweeten, J., Talbot, C., Tyler, J., & White, R. (2023). Prado Dam Forecast Informed Reservoir Operations: Final Viability Assessment. University of California, San Diego. https://cw3e.ucsd.edu/FIRO_docs/Prado/FIRO_Prado_FVA.pdf

Ralph, F. M., James, J., Leahigh, J., White, M., Anderson, M., Talbot, C., Forbis, J., Fromm, J., & Haynes, A. (2025). Yuba-Feather Forecast Informed Reservoir Operations: Final Viability Assessment. University of California, San Diego. https://cw3e.ucsd.edu/FIRO_docs/Yuba-Feather_FVA/Yuba-Feather_FVA.pdf

CW3E Publication Notice: Kickoff of a Joint AMS/ASCE Effort to Assess the Potential Contribution of AI in Addressing Infrastructure Resilience in a Changing Climate

CW3E Publication Notice

Kickoff of a Joint AMS/ASCE Effort to Assess the Potential Contribution of AI in Addressing Infrastructure Resilience in a Changing Climate

June 10, 2025

CW3E staff recently co-authored a journal article titled “Kickoff of a joint AMS/ASCE effort to assess the potential contribution of AI in addressing infrastructure resilience in a changing climate” in the Bulletin of the American Meteorological Society. This paper was led by Jason Giovannettone, Climate and Sustainability Director at Sisters of Mercy of the Americas, among co-authors across institutions including Anna Wilson (CW3E), Teng Wu (University at Buffalo), and ZhiQiang Chen (University of Missouri-Kansas City). This meeting summary is motivated by the desire to connect scientists and engineers from two organizations, the American Meteorological Society (AMS) and the American Society of Civil Engineers (ASCE), both working towards understanding potential uses of Artificial Intelligence (AI) in addressing climate resiliency. This work aligns with CW3E’s strategic goal to develop AI-based predictive capabilities for extreme weather associated with atmospheric rivers (ARs).

Figure 1. Illustration of the combined role of changes in the climate system and impacts from emissions and land-use change stemming from various socioeconomic processes on overall risk (i.e., vulnerability, exposure, and hazard characteristics) to climate-related impacts. Source: Figure SPM.1 from IPCC (2014).

To support building robust connections between the two organizations, AMS Water Resources Committee (WRC) and the ASCE Technical Committee on Future Weather and Climate Extremes (FWCX) virtually hosted webinars on three consecutive Thursdays in November 2024. Specifically, the two groups wanted to collaborate more openly on the use of AI in the following:

  1. Monitoring, predicting, and attributing climatic and extreme meteorological and hydrological events in terms of their intensity, duration, and location.
  2. Applications that support resilient infrastructure design to withstand extreme events under a changing climate.

The host organizations also acknowledged that such questions must be addressed with a multidisciplinary audience, and targeted an audience which spanned academic, government, private, and non-profit sectors amongst the fields of meteorology, climatology, planning, designing, decision-making, reservoir operations, research, science, and engineering. These webinars hosted talks covering topics relating to current and potential future impacts that AI might have on the improvement of extreme weather event prediction as well as contributions of AI to improvements in design and operations of water resources infrastructure under a changing climate. Speakers included academics and industry leaders, including CW3E’s Director of Research Luca Delle Monache (in Webinar 2). Webinars had up to 213 participants and are archived on the AMS website. Each session included two presenters and allowed participants time to ask questions both online and offline.

This webinar series was the first of more collaborative activities between AMS WRC and ASCE FWCX. As part of organizing the webinar series, AMS and ASCE developed a Memorandum of Understanding, which the authors hope will enable future partnership efforts. The organizations are interested in hosting more joint webinars and pursuing other collaborative mediums such as joint publication of peer-reviewed journal articles, joint sessions at conferences, and joint project coordination related to the use of AI in extreme weather and hydrologic events prediction as well as water resources infrastructure design and operation.

Giovannettone, J., Wilson, A., Wu, T., & Chen, Z. (2025). Kickoff of a Joint AMS/ASCE Effort to Assess the Potential Contribution of AI in Addressing Infrastructure Resilience in a Changing Climate. Bulletin of the American Meteorological Society, 106(6), E1045-E1051. https://doi.org/10.1175/BAMS-D-25-0077.1

CW3E Publication Notice: The Utility of a Two-dimensional Forward Model for Bending Angle Observations in Regions with Strong Horizontal Gradients

CW3E Publication Notice

The Utility of a Two-dimensional Forward Model for Bending Angle Observations in Regions with Strong Horizontal Gradients

May 7, 2025

A paper titled “The Utility of a Two-dimensional Forward Model for Bending Angle Observations in Regions with Strong Horizontal Gradients” was published recently in the American Meteorological Society’s Monthly Weather Review. The study was authored by Michael Murphy (SIO, NASA Goddard Space Flight Center, and University of Maryland Baltimore County), Jennifer Haase (SIO, CW3E), Pawel Hordyniec (Institute of Geodesy and Geoinformatics, Wrocław University of Environmental and Life Sciences), Xingren Wu (NWS/NOAA National Center for Environmental Prediction), Colin Grudzien (CW3E), and Luca Delle Monache (CW3E).

Atmospheric rivers (ARs) transport low level moisture over the global oceans and often produce high-impact precipitation over coastal mountain ranges. CW3E collects data from the AR Recon program to help improve forecasts across the Western US. This study looks at new ways to help improve forecasts across the Western US. This study looks at new ways to improve the use of new measurements of low-level moisture in numerical weather model forecasting. These measurements come from Low Earth Orbiting Satellite Radio Occultation (RO), where satellites like COSMIC-2 track how radio signals bend as they pass through the atmosphere. They sample temperature and moisture along horizontal raypaths that have high vertical resolution, but provide an integral of atmospheric properties in the horizontal. To take full advantage of these observations, the operator that simulates the observations from model fields must consider the 2-dimensional (2D) variation of the atmospheric properties. Specifically, in the Northeast Pacific, the proportion of occultation observations that are retained in the modeling systems is higher when the simulation accounts for horizontal variations across the AR (Figure 1).

This study evaluates the advantages of using a 2D observation operator for these simulations. One highlight is that for RO observations within the AR (e.g., the 250 kg m-1 s-1 limits of horizontal moisture transport), the 2D operator is shown to perform better than the standard 1D operator (Figure 2). This effect increases with increasing AR intensity. As shown, the 2D operator (blue line) performs significantly better in the height range from 2.5 to 7 km than the other methods, in terms of standard deviation of the difference with the Global Forecast System (GFS) analysis. This demonstrates the potential to improve forecasting specifically in and around the highly variable structure of ARs.

Figure 1. A comparison of the penetration depth of RO data in terms of the proportion of profiles that extend down to a given geometric height. The figure also shows how RO observations are vertically distributed, expressed as the percentage of total profiles within each 200-meter layer of the atmosphere, for different integrated water vapor transport (IVT) levels. The IVT thresholds are indicated by different line dash patterns in the legend. Figure 10 from Murphy et al. (2025).

Figure 2. Comparison inside areas of intense atmospheric rivers (IVT ≥ 500 kg m−1 s−1) of (a) the absolute value of the bias of the innovations with respect to the GFS (%). The difference in the (b) absolute value of the bias of the innovations (%) and (c) the standard deviation of the innovations (%) with the ROPP1D experiment for each of the remaining numerical experiments is also shown. The NBAM-O (red lines), NBAM-E (orange lines), ROPP1D (purple lines) and ROPP2D (blue lines) experiments are indicated. The thick dashed black line highlights the line of zero difference in panels (c) and (d). Note that ROPP2D (blue line) is the only 2D operator experiment and it has significantly lower standard deviation than the 1D operators. Figure 15 from Murphy et al. (2025).

Murphy, M. J., Haase, J. S., Hordyniec, P., Wu, X., Grudzien, C., &. Delle Monache, L. (2025). The Utility of a Two-dimensional Forward Model for Bending Angle Observations in Regions with Strong Horizontal Gradients. Monthly Weather Review (published online ahead of print 2025). https://doi.org/10.1175/MWR-D-23-0268.1

New MOU between Southern Cross University, New South Wales, Australia, and CW3E at Scripps Institution of Oceanography, UC San Diego.

New MOU between Southern Cross University, New South Wales, Australia, and CW3E at Scripps Institution of Oceanography, UC San Diego

May 5, 2025

We are thrilled to announce a new international academic partnership between Southern Cross University located in New South Wales, Australia, and Scripps Institution of Oceanography.

The new university partnership represents a formal agreement to collaborate, with CW3E research as a central focus for scientific and educational objectives. This initiative aims to enhance research, innovation, and global learning opportunities. The strategic alliance is designed to create new pathways for research, innovation, and student exchange, fostering academic connections across continents and fields of study.

With the signing of this MOU, we embark on a new chapter of international academic excellence, focusing on equipping students and researchers with the skills and perspectives necessary for a better understanding of Earth’s weather extremes.

Dr. Leinen, Dr. Roche, and Dr. Ralph

CW3E Publication Notice: Forward Modeling of Bending Angles With a Two-Dimensional Operator for GNSS Airborne Radio Occultations in Atmospheric Rivers

CW3E Publication Notice

Forward Modeling of Bending Angles With a Two-Dimensional Operator for GNSS Airborne Radio Occultations in Atmospheric Rivers

April 16, 2025

A paper titled “Forward Modeling of Bending Angles With a Two-Dimensional Operator for GNSS Airborne Radio Occultations in Atmospheric Rivers” was recently published in the AGU’s Journal of Advances in Modeling Earth Systems. The study was led by Pawel Hordyniec (Institute of Geodesy and Geoinformatics, Wrocław University of Environmental and Life Sciences) and SIO Professor/CW3E research collaborator Jennifer Haase, with contributions from Michael Murphy (SIO, NASA Goddard, and UMBC), Bing Cao (SIO), Anna Wilson (CW3E), and Ivette Baños (NCAR).

Airborne Radio Occultation (ARO) has been a key component of Atmospheric River Reconnaissance (AR Recon) data collection since receivers were first added to the NOAA G-IV aircraft in 2018. ARO data complement the vertical profile data collected by the foundational AR Recon dropsonde data. ARO indirectly makes observations of the moisture and temperature in the atmosphere by measuring delays in GNSS (GPS) signal propagation. Because it is an indirect measurement of the atmospheric properties, it is necessary to have a means for simulating the observations in order to assimilate them in to a numerical weather prediction (NWP) model and improve forecasts.

This paper describes the observation operator that has been developed to assimilate the ARO observations into any weather model that has been interfaced to the new Joint Effort for Data assimilation Integration (JEDI) system. Because of the modular design of JEDI, the data can now be assimilated into the Model Prediction Across Scales developed by the National Center for Atmospheric Research and the Finite Volume 3 (FV3) model used at NASA and NCEP, among others. The observations measure the time of propagation of a near-horizontal ray path from a setting GNSS satellite to the aircraft and samples the larger region surrounding the flight path, and thus complements the reconnaissance dropsondes directly beneath the aircraft. The operator is developed to take into account the highly complicated two-dimensional structure of the AR traversed by the long horizontal ray path, so the data assimilation can reproduce high resolution features in combination with other datasets. An upcoming paper will describe the improved forecast of an AR in the pacific northwest using the operator with the MPAS model. The figure below illustrates the large errors that would be encountered at 5-6 km altitude in the core of the AR if the two-dimensional nature of the AR was not considered in simulating the observations.

Figure 1. (a) Each profile shows the difference between simulated 1D and 2D bending angles. When the atmosphere has large variations along the GPS signal raypath, the points in the profile will deviate greatly from a straight line, as they do specifically for the red points in the profile 025.21.52.R02 and 025.22.29.G19 that were measured along transect A2 near the core of the AR. Profiles are plotted sequentially along the horizontal axis where each grid box represents 10% bending angle difference. The labels A1, A2, A3, and A4 indicate in which part of the flight path the profiles are located in panel (c). Individual tangent points in the profile are color-coded by the integrated vapor transport beneath that point, and the size of each dot is scaled to corresponding IWV values as indicated in the legend. (b) Refractivity anomaly profiles (observation minus climatology) calculated from the dropsondes in transects A2 and A3. Dashed line indicates the location where the aircraft turned on the cold side of the AR core from transect A2 to A3. Blue shading indicates schematically the levels in the profiles with large dropsonde dew point depression (dry air), and red shading indicates levels with near saturation conditions in the dropsonde data. Profiles are offset by 10% for visibility. (c) Location of occultation profiles along transects A1 (outside the AR), A2 and A3 (inside the AR) and A4 (outside the AR). Figure 14 from Hordyniec et al. (2025).

Hordyniec, P., Haase, J. S., Murphy, M. J., Jr., Cao, B., Wilson, A. M., & Banos, I. H. (2025). Forward modeling of bending angles with a two-dimensional operator for GNSS airborne radio occultations in atmospheric rivers. Journal of Advances in Modeling Earth Systems, 17, e2024MS004324. https://doi.org/10.1029/2024MS004324

CW3E Publication Notice: Atmospheric Rivers in Antarctica

CW3E Publication Notice

Atmospheric Rivers in Antarctica

April 15, 2025

A review paper titled “Atmospheric Rivers in Antarctica” was recently published in Nature Reviews Earth & Environment. The study was co-led by Jonathan D. Wille (ETH), Vincent Favier (CNRS), and Irina V. Gorodetskaya (CIIMAR), with contributions from CW3E scientists Xun (Jerry) Zou and Zhenhai Zhang. This international collaboration provides a comprehensive overview of current research on Antarctic atmospheric rivers (ARs). Moreover, this study further expands CW3E’s research on ARs to Antarctica, focusing on how ARs influence extreme weather events and climate feedback processes at high latitudes, including AR impacts on future sea level rise. Antarctic ARs, a form of extreme weather, transport moisture and heat from lower latitudes to the Antarctic continent. While present-day AR events generally contribute positively to the Antarctic ice-sheet mass balance by producing heavy snowfall, they can also trigger sea ice and coastal ice sheet melt and destabilize ice shelves (Figure 1).

Figure 1. (a) Atmospheric river (AR) frequency (h per year, 1980–2020; teal shading) derived from the algorithm and MERRA-2 (Modern-Era Retrospective Analysis for Research and Applications, version 2) reanalysis. Interannual variability is shown in white contours (h per year). Coastal (based on ice sheet and shelves) AR frequency is shown by longitude and grouped by season. (b) Relative change in AR frequency (%) by individual glacier basin from 1980 to 2020 is shown with shading, also based on the MERRA-2 reanalysis. Hatching indicates a linear fit of AR frequency (horizontal) or AR precipitation (vertical) per basin from 1980 to 2020 that has a P value <0.05. AR precipitation trend values are not shown. Despite being rare events, positive trends in AR frequency are responsible for increased snowfall in West Antarctica and Queen Maud Land during the 1980–2020 period. Figure 2 from Wille et al. (2025).

In this review, we investigate the life cycle, atmospheric dynamics (Figure 2), and impacts of Antarctic ARs to better understand their overall influence on the ice-sheet mass balance. Antarctic ARs are typically linked to high-amplitude pressure couplets and often form within Rossby waves generated by tropical convection. Although ARs reaching Antarctica are relatively infrequent — occurring on average about three days per year at any given location — they are responsible for 50–70% of extreme snowfall events in East Antarctica since the 1980s. Despite their role in delivering heavy snowfall, ARs can also drive widespread surface melting, contributing to the collapse of ice shelves, such as Larsen A in 1995 and Larsen B in 2002. As climate change amplifies atmospheric water vapor, ARs are expected to intensify, raising critical questions about how these changes will reshape the delicate balance between snowfall and melt, alter ice-sheet stability, and affect future sea-level rise. Addressing these uncertainties will be key for understanding Antarctica’s evolving role in the global climate system.

Figure 2. (a) Multilevel atmospheric river (AR) dynamics, from the surface, through to the lower troposphere and mid-troposphere. Mid-latitude sources of moisture are transported towards the polar latitudes by an AR (grey arrow), resulting in latent heat release of AR moisture. When the latent heat release occurs, it amplifies the polar jet stream (white arrow) and cyclogenesis via potential vorticity (PV) anomalies. (b) Mountainous meso-scale dynamics typically observed in coastal regions such as the Antarctic Peninsula, focusing on thermodynamic processes. Mixed-phase clouds along the windward coastline heat the surface through downwelling longwave radiation (red arrows). When the AR airstream crosses mountainous terrain, it descends and warms adiabatically creating a foehn wind on the leeward side. (c) Cyclone (synoptic-scale) dynamics demonstrating the pathway of the AR airstream as it lifted isentropically in the warm conveyer belt (orange arrows) over the warm front and eventually reaches the anticyclone (high-pressure area), causing the cyclone to intensify. ARs, through the poleward transport of moisture and heat, substantially alter the dynamics and thermodynamics of Antarctic weather patterns when reaching the cold, and sometimes mountainous terrain, along the Antarctic coastline. Figure 1 from Wille et al. (2025).

Although progress has been made in understanding Antarctic ARs, key gaps remain. Ongoing research aims to identify the various tropical forcing patterns necessary for the initial tropical moisture export and Rossby wave amplification that directs moisture transportation. Once moisture reaches the Antarctic Ice Sheet, its influence on mesoscale cyclonic activity remains uncertain. High-resolution, kilometer-scale models are critical for resolving how moisture transport within warm conveyor belts affects cyclone intensity and AR impacts. Additionally, uncertainties in polar AR detection techniques are crucial for better understanding AR impacts. Detecting AR signals in ice core records prior to the reanalysis period (1979 onward) could allow for climate reconstructions of Antarctic ARs over a longer timeframe. The critical question ahead is how the balance between the positive and negative impacts of ARs on ice-sheet mass balance will shift with climate change, both in the near and long term. Addressing this in climate models is essential for understanding how rare but impactful events affect AIS stability and for refining projections of future sea-level rise.

Wille, J. D., Favier, V., Gorodetskaya, I. V., Agosta, C., Baiman, R., Barrett, J. E., Barthelemy, L., Boza, B., Bozkurt, D., Casado, M., Chyhareva, A., Clem, K. R., Codron, F., Datta, R. T., Durán-Alarcón, C., Francis, D., Hoffman, A., Kolbe, M., Krakovska, S., Linscott, G., Maclennan, M. L., Mattingly, K. S., Mu, Y., Pohl, B., Leroy-Dos Santos, C., Shields, C., Toker, E., Winters, A. C., Yin, Z., Zou, X., Zhang, C., & Zhang, Z. (2025). Atmospheric rivers in Antarctica. Nature Reviews Earth & Environment, 6, 178-192. https://doi.org/10.1038/s43017-024-00638-7

CW3E Publication Notice: Role of evolving sea surface temperature modes of variability in improving seasonal precipitation forecasts

CW3E Publication Notice

Role of evolving sea surface temperature modes of variability in improving seasonal precipitation forecasts

April 8, 2025

Scientists from the CW3E Subseasonal & Seasonal (S&S) Team recently published an article titled “Role of evolving sea surface temperature modes of variability in improving seasonal precipitation forecasts” in Nature Communications Earth & Environment. This study was led by Agniv Sengupta (CW3E) and co-authored by Duane E. Waliser (NASA Jet Propulsion Laboratory), Mike DeFlorio (CW3E), Bin Guan (UCLA), Luca Delle Monache, and F. M. Ralph (CW3E). This work aligns with CW3E’s goal to develop and leverage emerging technologies to improve the S&S precipitation prediction skill in the western United States. The work was supported by the California Department of Water Resources’ AR Program and National Aeronautics and Space Administration (NASA Grant 80NSSC22K0926).

The value of improving longer-lead precipitation forecasting in the water-stressed, semi-arid western United States cannot be overstated, especially considering the severity and frequency of droughts that have plagued the region for much of the 21st century. Multi-year droughts have been widespread in the state during the past decade, namely from 2012 to 2016 and from 2019 to 2022, which were relieved by the unprecedented storms of winter 2022–2023. Seasonal prediction skill of current operational forecast systems, however, remain insufficient for decision-making purposes across a variety of applications.

To address this capability gap, this study develops a Multi-Lead Multi-Source (MLMS) seasonal forecasting system that leverages the long-term memory of leading global and basin-scale modes of sea surface temperature (SST) variability (Figure 1). This approach focuses on characterizing and capitalizing on the spatiotemporal evolution of SST predictors from multiple antecedent seasons (Figure 1, panel a) instead of the customary use of predictive information from just the current season. This gives the ‘Multi-Lead’ or ‘ML’ part of the MLMS acronym. Another distinctive methodological feature is the incorporation of sources of predictability spanning multiple timescales from interannual to decadal-multidecadal (Figure 1, panel b), providing the ‘Multi-Source’ or ‘MS’ part of the MLMS acronym.

Figure 1. Schematic of the seasonal precipitation forecast methodology based on evolving SST modes of variability. Antecedent SST fields, Ψ (x, y), from multiple past seasons (t0, t0-1, t0-2, …, t0-n), illustrated in panel a, are projected onto predictor variables, shown in panel b, extracted from an extended-EOF analysis of observed SST anomalies. The derived modes of variability comprise natural variability ranging from interannual to decadal-multidecadal timescales as well as the secular trend. A statistical model is trained by leveraging the lagged relationships between these predictor modes and the predictand, which is precipitation anomaly, Pr (x, y), over the western U.S. in the following winter season (t0+1), shown in panel c. Figure 1 from Sengupta et al. (2025).

The results indicate that the seasonal forecast skill improves with the inclusion of more temporal lags in the predictor set. This finding validates our hypothesis concerning the importance of adequately capturing the spatiotemporal evolution of predictor variables from multiple past seasons, rather than relying solely on the most recent season’s data. Additionally, hindcast skill assessment of the MLMS forecast system’s performance demonstrates skill over core winter precipitation regions relative to dynamical and statistical baselines. Specifically, the model hindcasts are competitive with or superior to the North American Multi-Model Ensemble (NMME) dynamical models, particularly in Northern California, Pacific Northwest, and the Upper Colorado River basin (Figure 2).

Figure 2. Hindcast skill of MLMS-SST model compared with the NMME dynamical models and their multi-model ensemble mean over constituent HUC basins in the western U.S. The dynamical models assessed here include the NCEP-CFSv2, NASA GEOS-S2S, CMC CanCM3, CanCM4i, GEM5-NEMO, GFDL FLOR-B01 and GFDL-SPEAR, with hindcasts initialized in October for the November through March winter season. These dynamical models are shown in blue with their multimodel ensemble in black, and the proposed MLMS-SST model in red. The comparative assessment is performed for the common overlapping period of available hindcasts—winters 1982-83 through 2010–11 (with the exception of GFDL-SPEAR, available only from winter 1991-92). The correlations reported in each case are the area-averaged values computed over continental grid points. Figure 6 from Sengupta et al. (2025).

Our study offers a promising new approach for the potential improvement of seasonal precipitation forecasting, which has been defined as a top priority in the Weather Research and Forecasting Innovation Act passed by the 115th U.S. Congress as well as recognized internationally as a research priority by the World Meteorological Organization. The proposed methodology develops an experimental forecasting tool with the potential to support water and agricultural managers, as well as emergency response planners in California and the Colorado River Basin—an important source of imported water supplies—in making informed resource positioning and policy decisions, particularly at the onset of the winter season.

Sengupta, A., Waliser, D. E., DeFlorio, M. J., Guan, B., Delle Monache, L., & Ralph, F. M. (2025). Role of evolving sea surface temperature modes of variability in improving seasonal precipitation forecasts. Communications Earth & Environment, 6, 256. https://doi.org/10.1038/s43247-025-02235-y

CW3E AR Update: 28 March 2025 Outlook

CW3E AR Update: 28 March 2025 Outlook

March 28, 2025

Click here for a pdf of this information.

Forecast Update on Potential Atmospheric River Event Next Week

  • CW3E’s previous outlook (posted on Wed 26 Mar) highlighted the strong signal for a high-impact atmospheric river (AR) in California next week in NCEP model guidance, as well as the substantial model-to-model differences between NCEP and ECMWF.
  • While today’s 00Z model runs continued to show uncertainty in the forecast, the most recent 12Z NCEP guidance has shifted towards the ECMWF, which has been favoring a much weaker event for the past several days.
  • Although a high-impact AR now appears unlikely, an unsettled weather pattern will bring precipitation to much of the western US through the middle of next week.
  • A mid-level trough over the Northeast Pacific is forecast to produce 2–5 inches of precipitation in the Klamath Mountains, Shasta County, and Northern Sierra Nevada between Sun 30 Mar and Wed 2 Apr.
  • The NWS Weather Prediction Center (WPC) has issued a marginal risk excessive rainfall outlook (ERO) for the Klamath Mountains and Northern California Coast Ranges Mon 31 Mar into early Tue 1 Apr.

Click images to see loops of GFS IVT and IWV forecasts

Valid 1200 UTC 28 March 2025 – 0000 UTC 5 April 2025

Summary provided by C. Castellano; 28 March 2025

To sign up for email alerts when CW3E post new AR updates click here.

*Outlook products are considered experimental

For any unfamiliar terms, please refer to the American Meteorological Society Glossary.