CW3E Publication Notice
Dropsonde Observations of the Stable Marine Boundary Layer Beneath Atmospheric Rivers
December 2, 2024
A new article titled “Dropsonde Observations of the Stable Marine Boundary Layer Beneath Atmospheric Rivers,” led by CW3E Director F. Martin Ralph and coauthored by Matthew Simpson (CW3E), Sam Iacobellis (CW3E), Jay Cordeira (CW3E), Forest Cannon (Tomorrow.io), Alison Cobb (ECMWF), Allison Michaelis (Northern Illinois University) and Luca Delle Monache (CW3E) was published in the American Meteorological Society’s Monthly Weather Review. This study investigates the vertical structure of the stable marine boundary layer (SMBL) in atmospheric river (AR) environments and key modulating processes using data from more than 1000 dropsondes collected during the AR Reconnaissance program. By analyzing an extensive database of dropsonde observations over the Northeast Pacific, we aim to document the occurrence of AR-SMBL conditions in mid-latitude ARs and explore their origins and the decoupling process between the lower AR atmosphere and the underlying ocean surface. This work is well aligned with CW3E’s goals to advance scientific understanding of ARs and to improve extreme precipitation forecasting for Western North America.
Water vapor transport associated with ARs is focused in the lower troposphere where the combination of strong low-level winds and increased moisture produces strong horizontal fluxes. As a result, the behavior of the SMBL is potentially important in modulating AR strength (Ralph et al. 2017). In addition, accurately representing SMBL dynamics beneath ARs by numerical weather prediction (NWP) models can be critical for data assimilation. For example, Lavers et al. (2018) found the greatest initial condition errors in European Centre for Medium-Range Weather Forecasts (ECMWF) forecasts of ARs are near the top of the MBL.
We examined the hypothesis that, as relatively warm air parcels are advected poleward towards and within an AR over progressively cooler ocean waters, sensible heat is transferred from the air mass defining the AR into the ocean surface, thereby cooling the lowest levels of the atmosphere. This atmospheric cooling subsequently increases static stability and vertical wind shear within the MBL, effectively decoupling the lower layer of the AR from the ocean surface.
Simulated backward air parcel trajectories originating from dropsonde locations within the AR core were used to calculate the 24-hour change in SST experienced by an air parcel (DSST24) beneath each AR. The DSST24 varies from –13°C to +2°C and is directly related to the strength of the AR and its orientation relative to the SST gradient. The DSST24, therefore, distinguishes weak and strong decoupling regimes (WDR, SDR). In SDR cases, relative to WDR cases, the SMBL is characterized by stronger static stability, low-level jet, vertical wind shear, horizontal water vapor transport, and moderately shallower SMBL depth (Figure 1).
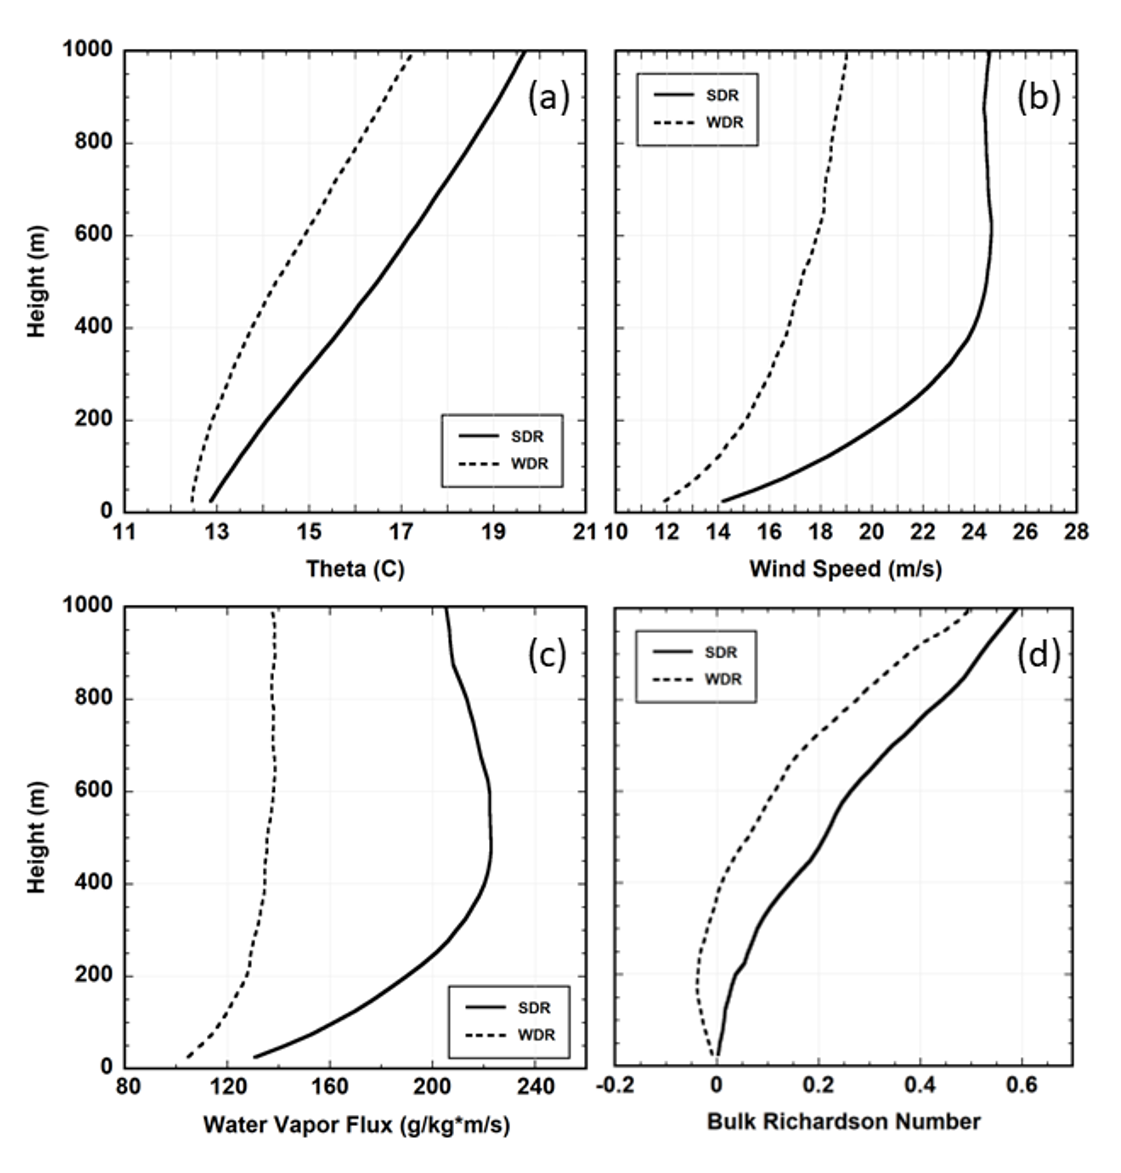
Figure 1. Composite profiles within the AR core for strong (SDR, solid line) and weak decoupling regime (WDR, dashed line) cases for (a) potential temperature, (b) wind speed (m s–1), (c) water vapor flux (g kg-1 * m s–1), (d) Bulk Richardson number (Rib).
SDR cases were associated with a greater sensible heat loss to the ocean relative to the WDR cases (Figure 2), leading to a cooling of the lower atmosphere and the increase in static stability observed in composite profiles. Sensible heat flux and IVT values are highly correlated in SDR cases while the WDR sensible heat flux exhibits an irregular structure relative to IVT contours.
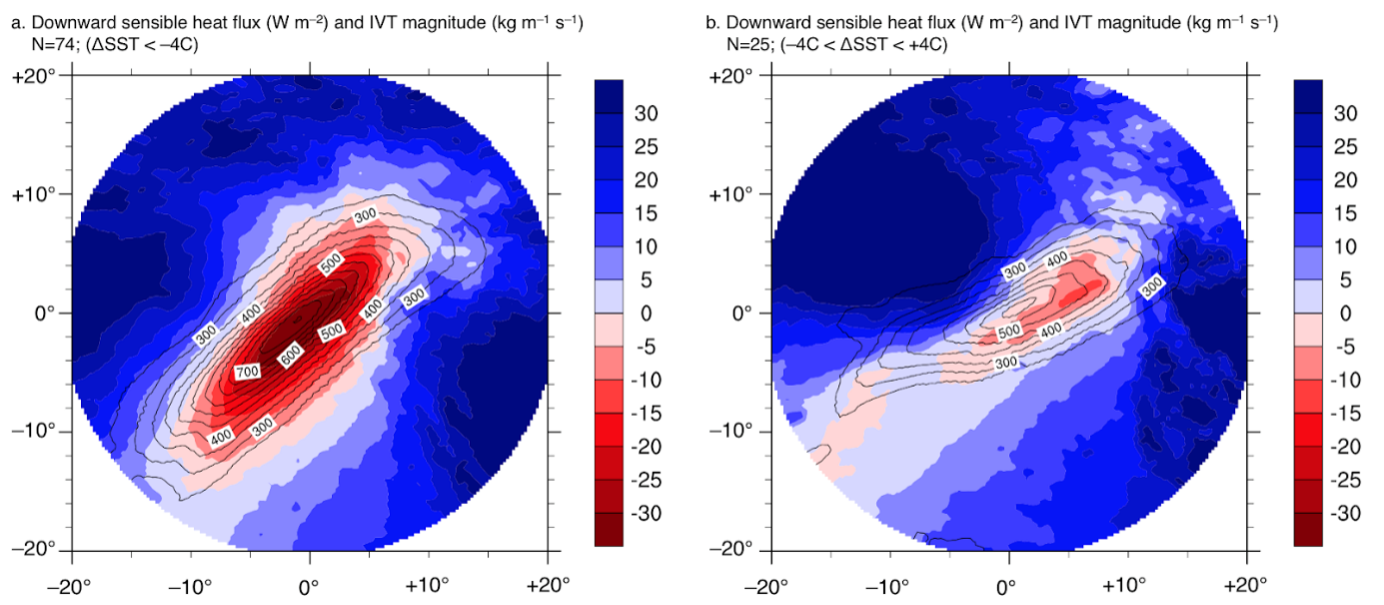
Figure 2. ERA5-derived spatially centered and rotated composite analyses of sensible heat flux (W m–2; shaded according to scale) and IVT magnitude (contoured every 100 kg m–1 s–1 starting at 200 kg m–1 s–1) for the subset of IOPs containing a change in SST (a) less than –4°C (N=74) and (b) between –4°C and +4°C (N=25).
The study highlights the complex structure of the SMBL beneath ARs and documents the increase in air-sea decoupling due to advection of the warm air mass in ARs over cooler SSTs. This observation-based paper will act as a foundation for future work to improve NWP model representation of AR-SMBL dynamics though enhanced boundary layer parameterizations.
Lavers, D. A., Rodwell, M. J., Richardson, D. S., Ralph, F. M., Doyle, J. D., Reynolds, C. A., Tallapragada, V., & Pappenberger, F. (2018). The gauging and modeling of rivers in the sky. Geophysical Research Letters, 45(15), 7828-7834. https://doi.org/10.1029/2018GL079019
Ralph, F. M., Iacobellis, S. F., Neiman, P. J., Cordeira, J. M., Spackman, J. R., Waliser, D. E., Wick, G. A., White, A. B., & Fairall, C. (2017). Dropsonde Observations of Total Integrated Water Vapor Transport within North Pacific Atmospheric Rivers. Journal of Hydrometeorology, 18(9), 2577-2596. https://doi.org/10.1175/JHM-D-17-0036.1
Ralph, F. M., Simpson, M., Iacobellis, S., Cordeira, J. M., Cannon, F., Cobb, A., Michaelis, A. C., & Delle Monache, L. (2024). Dropsonde Observations of the Stable Marine Boundary Layer Beneath Atmospheric Rivers. Monthly Weather Review (published online ahead of print 2024). https://doi.org/10.1175/MWR-D-23-0207.1