CW3E Hosts 11th Annual Winter Outlook Workshop Sponsored by California DWR

CW3E Hosts 11th Annual Winter Outlook Workshop Sponsored by California DWR

November 15, 2019

The 11th Annual Winter Outlook Workshop (WOW), sponsored by the California Department of Water Resources (DWR), took place at Scripps Institution of Oceanography from November 6th-8th, 2019.

The purpose of the WOW meeting, both historically and continuing this year, is to facilitate interaction between the research community and water resource managers on improving subseasonal-to-seasonal (S2S) forecasts of precipitation, atmospheric rivers (ARs), ridging, and other relevant hydroclimate variables for the Western U.S. region.

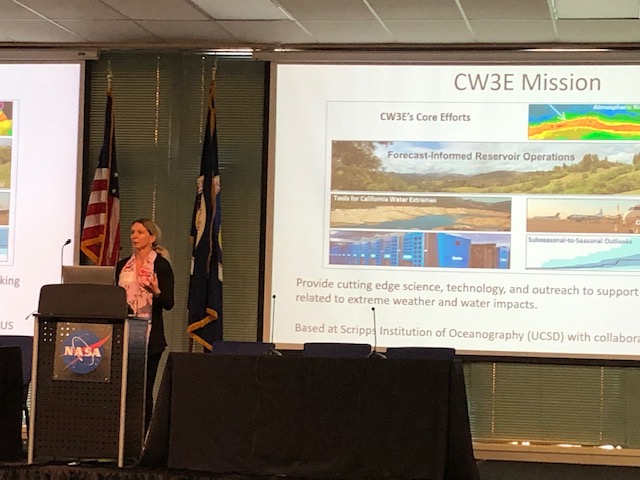
The 11th Annual WOW meeting began with opening remarks from CW3E Director Dr. Marty Ralph, which was followed by a presentation from Jeanine Jones (DWR Interstate Resources Manager). Her presentation provided an overview of the stakeholder/end user need for better S2S forecasts of precipitation, ARs, and ridging over the western United States. Her talk emphasized that research efforts to better understand S2S predictability of these phenomena is a necessary, but not sufficient, component of DWR-funded S2S work. The main emphasis from a water manager’s perspective is to obtain a useful S2S forecast tool or operational S2S product that can aid in decision support.

Dr. Mike DeFlorio, the lead researcher on S2S at CW3E, spoke in the next presentation about the joint CW3E/JPL efforts over the last year to: a) conduct fundamental research to improve understanding of S2S predictability of precipitation, ARs, and ridging, and b) to produce (or refine existing) experimental S2S forecast products that can aid in decision support for western water applications. His work highlighted both his own research/experimental product development, and the research/product development led by other CW3E/JPL S2S team members. Dr. DeFlorio also highlighted CW3E/JPL’s involvement in the S2S Prediction Project’s Real-time Pilot Initiative, which is a joint Research-to-Operations (R2O) initiative by the World Weather Research Programme (WWRP) and World Climate Research Programme (WCRP) to promote the uptake of S2S forecasts to support users and decision-makers. CW3E/JPL is the only team participating in this global initiative with a water management-related end user representative (California DWR).

The next talk was given by Dr. Sasha Gershunov (CW3E/Scripps), who presented CW3E’s experimental seasonal forecast for precipitation over the western U.S. during the January-February-March period. This work is based on research described in Gershunov and Cayan (2003) and leverages canonical correlation analysis of sea surface temperature (SST) and precipitation over the Pacific/western U.S. region. In addition to presenting this experimental seasonal forecast, Dr. Gershunov also focused on the research that was a necessary condition for providing a potentially useful forecast [Gershunov and Cayan 2003]. Accordingly, he presented a hindcast skill assessment of the statistical model that was used to make the experimental seasonal prediction for this winter.

The first day of the workshop concluded with a talk by Dr. Michael Anderson, the state climatologist at California DWR. His presentation focused on examples of ways that DWR can potentially utilize subseasonal (weeks 3-5 lead time) to seasonal (monthly lead time) forecasts of precipitation, ARs, and ridging over the Western U.S. region.

The second day of the workshop began with a presentation from Dr. David DeWitt, the Director of NOAA’s Climate Prediction Center (CPC). His talk emphasized the various S2S efforts ongoing at CPC, and in particular focused on the importance of the passage of the Weather Act in 2017 (and its reauthorization in 2019), which specifically includes S2S forecasts as a target area for improvement. Dr. Matt Switanek then gave a presentation on the efforts of he and his team at NOAA ESRL to improve statistical S2S forecasts of precipitation over the western U.S. The morning of Day 2 continued with a talk by Dr. Peter Gibson (NASA JPL/CalTech) on experimental subseasonal ridging outlooks that he and Dr. Duane Waliser (NASA JPL/CalTech) have led the development of. These experimental outlooks are supported by several research efforts that Dr. Gibson has led, which all seek to better understand the types of ridges that impact the western U.S., along with providing a subseasonal skill assessment of several dynamical hindcast systems in predicting these ridge types. The last talk of the morning of Day 2 was given by Dr. Rong Fu (UCLA), who presented an experimental seasonal prediction of precipitation over the western U.S. using a similar CCA-based methodology of that employed by the Scripps seasonal forecasting team.

The afternoon of day 2 concluded with several talks by: CW3E Deputy Director Dr. Luca Delle Monache on opportunities for applying machine learning techniques to improve S2S prediction; a joint talk by Dr. Duane Waliser (NASA JPL/CalTech) / Dr. Andy Robertson (IRI) / Dr. Xubin Zeng (University of Arizona) on upcoming work to improve S2S prediction of snowpack over the western U.S.; and a discussion led by Jeanine Jones on potential ways to increase the scope of ocean observations to improve S2S prediction. CW3E Field Research Manager Dr. Anna Wilson, Dr. Bruce Cornuelle (Scripps), Dr. Luca Centurioni (Scripps), and CW3E Deputy Director Dr. Luca Delle Monache also participated in this discussion as panel members.

The final day of the 11th Annual WOW meeting began with a talk by Scripps postdoctoral research Dr. Dillon Amaya, who presented an overview of “Blob 2.0”, a near-record pattern of warm SST anomalies over the North Pacific that emerged during Summer 2019. His talk focused on the extent to which Blob-like warm anomalies could be a source of S2S predictability for drought over the western U.S. region. Dr. Jon Rutz (NWS Western Region) then gave a presentation which provided an overview of research-to-operations in NWS. The final talk of the workshop was given by Jeanine Jones (DWR), which focused on the Colorado River basin and highlighted ways in which improved S2S forecasts of precipitation would benefit stakeholders and end users in this region. The workshop concluded with a roundtable discussion involving all workshop attendees. Each WOW participant provided their general thoughts on the workshop, and identified various pathways going forward to better facilitate efficient S2S R2O efforts for California DWR.

CW3E at Northern California Post-Wildfire Processes Meeting

CW3E at Northern California Post-Wildfire Processes Meeting

November 12, 2019

On November 6, representatives from the US Geological Survey, Pacific Gas & Electric, Caltrans, the National Weather Service, NASA, Infraterra, CalOES, Sonoma Water, California Dept. of Water Resources, and CW3E met at Moffett Field to share each organization’s current activities and coordinate on future efforts with respect to post wildfire processes (e.g., debris flow and flash flood hazards on recent burn areas, water quality issues, and reservoir sedimentation concerns). CW3E affiliate Nina Oakley presented on current CW3E efforts to improve understanding and monitoring of atmospheric rivers as wells as ongoing research on predictability and drivers of short-duration precipitation extremes in California.

The meeting helped to facilitate partnerships between agencies and illuminate opportunities to leverage technologies and observations across groups. A pilot project on the Kincade Fire (Sonoma County) was discussed. This effort would experiment with state-federal-private partnerships in response to a recently burned area, with a goal of producing high-quality mapping, modeling, and monitoring that could support increased awareness of hazards and mitigation of impacts for that area.

CW3E’s various monitoring activities, including Atmospheric River Reconnaissance, AQPI, and observations in the Russian River Basin associated with Forecast Informed Reservoir Operations, as well as the Center’s specialized knowledge of northern California precipitation extremes, could support the pilot project.

CW3E Post-Event Summary: Upper Colorado River Basin October Snowfall

CW3E Post-Event Summary: Upper Colorado River Basin October Snowfall

November 5, 2019

Click here for a pdf of this information.

Analysis of the Meteorological Conditions that led to a Snowy October in the Upper Colorado River Basin

  • Numerous systems over a 2 week span at the end of October resulted in heavy snowfall over the Upper Colorado River Basin
  • Moisture associated with the snowfall was supplied via an inland penetrating AR over the Pacific Northwest that resulted in flooding and road closures in mid to late October in Washington and Oregon
  • Tower, a SNOTEL site #825 east of Steamboat Springs in the Yampa River watershed, received ~12% of it’s annual maximum SWE in a short time-span
  • Impacts were also experienced east of the Continental Divide, where Denver recorded its 12th snowiest and 4th coldest October since 1872

Link to PNW summary here.


NCEP GFS Analysis Integrated Vapor Transport (IVT)

Valid 0000 UTC 18 October – 1800 UTC 25 October 2019

  • A loop of NCEP GFS Analysis derived IVT illustrates the numerous pulses of inland penetrating moisture transport into the intermountain west and over locations such as Steamboat Springs, CO (Red Dot on Map)
  • This period of landfalling ARs over the PNW and heavy snow in the upper Colorado River Basin exemplifies the upstream connection between landfalling ARs on the U.S. West Coast and winter weather over the inland Rockies


NCEP GFS Analysis Integrated Vapor Transport (IVT)

Valid 0000 UTC 26 October – 1800 UTC 31 October 2019


Summary provided by C. Hecht, C. Castellano, J. Kalansky, F. M. Ralph; 1 PM PT 5 November 2019

CW3E Personnel Greet Delegation Visiting from China

CW3E Personnel Greet Delegation Visiting from China

November 12, 2019

In mid-November, Douglas Alden (Lead Engineer) and Tashiana Osborne (CW3E graduate student) spoke with 40 members of a delegation visiting Scripps from China. The group consisted of personnel from the Department of Natural Resources of Zhejiang Province and nearby research institutes. The visitors were part of a UC San Diego program coordinated by the Global Leadership Institute within the School for Global Policy and Strategy (GPS).

Osborne shared with the group through a presentation highlighting key CW3E research involving atmospheric rivers and Forecast Informed Reservoir Operations (FIRO). Afterward, Alden guided the delegation through an informative tour of the Scripps Pier and meteorological instruments available for making observations. Presentations and conversations were translated in real-time by an interpreter. Delegates had opportunities to share comments and ask questions about research and related efforts within Scripps and CW3E.


Alden, Osborne, and the Zhejiang delegation touring the Scripps Pier. An additional invited guest, Nathan James (senior software engineer visiting from NASA Goddard), joined for the tour. (PC: Dept. of Natural Resources of Zhejiang Province, UC San Diego).

CW3E Publication Notice: A decade of terrestrial water storage changes across the contiguous United States from GPS and GRACE

CW3E Publication Notice

A decade of terrestrial water storage changes across the contiguous United States from GPS and GRACE

November 7, 2019

Susheel Adusumilli, CW3E collaborator Adrian Borsa, Francesca Silverii (IGPP/SIO/UCSD), and CW3E collaborator Hilary McMillian (SDSU), along with CW3E graduate student, Meredith Fish, recently published an article in Geophysical Research Letters titled, “A decade of terrestrial water storage changes across the contiguous United States from GPS and GRACE.”

In the article, the authors used a novel combination of GPS and GRACE observations to provide a higher spatiotemporal resolution dataset of terrestrial water storage than current estimates over the years 2002-2017. This new dataset allows for the investigation of seasonal, interannual and sub-seasonal terrestrial water storage anomalies across the contiguous United States.

Two of the key points for this article were:

  1. The ratio of interannual to seasonal water storage change varies widely across the USA, highlighting the local vulnerability to water stress.
  2. Atmospheric river (AR) events drive rapid water storage increases across the western US, with the top 5% of ARs contributing 73% of the AR total.

Figure 1: (Figure #4 from paper) shows the changes in terrestrial water storage anomaly over the western USA at inland and coastal regions. The circles represent atmospheric rivers, with centers indicating timing and sizes indicating magnitude.

Adusumilli, S., A. A. Borsa, M. A. Fish, H. K. McMillian, and F. Silverii, 2019: A decade of terr46strial water storage changes across the contiguous United States from GPS and GRACE. Geophysical Research Letters, 0, doi: 10.1029/2019GRL085370..

CW3E Post-Event Summary: 27-30 October 2019

CW3E Post-Event Summary: 27-30 October 2019

November 5, 2019

Click here for a pdf of this information.

Heavy snowfall puts an exclamation mark on an unusually cold and snowy October in central Colorado

  • An unsettled weather pattern produced 6–12 inches of snow throughout much of Colorado during 27–30 October
  • Denver recorded its 12th snowiest and 4th coldest October since 1872


Click either image to see a loop of GFS IWV or 250-hPa Wind analyses

Valid 0000 UTC 27 October – 1200 UTC 30 October 2019


Summary provided by C. Castellano, C. Hecht, J. Kalansky, F. M. Ralph; 1 PM PT 5 November 2019

CW3E Publication Notice: SKRIPS v1.0: A Regional Coupled Ocean–Atmosphere Modeling Framework (MITgcm–WRF) Using ESMF/NUOPC, Description and Preliminary Results for the Red Sea

CW3E Publication Notice

SKRIPS v1.0: A Regional Coupled Ocean–Atmosphere Modeling Framework (MITgcm–WRF) Using ESMF/NUOPC, Description and Preliminary Results for the Red Sea

October 15, 2019

CW3E postdoc Rui Sun, along with co-authors Aneesh Subramanian, Bruce Cornuelle, Art Miller, Matt Mazloff, and Ibrahim Hoteit of KAUST (King Abdullah University of Science and Technology), published a paper in Geoscientific Model Development entitled “SKRIPS v1.0: A regional coupled ocean–atmosphere modeling framework (MITgcm–WRF) using ESMF/NUOPC, description and preliminary results for the Red Sea”

In this study, a new regional coupled ocean–atmosphere model is developed and its implementation is presented. The coupled model is based on two open-source community model components: (1) MITgcm ocean model and (2) Weather Research and Forecasting (WRF) atmosphere model. The coupling between these components is performed using ESMF (Earth System Modeling Framework) and implemented according to National United Operational Prediction Capability (NUOPC) protocols. The coupled model is named the Scripps–KAUST Regional Integrated Prediction System (SKRIPS). In the paper, the SKRIPS is demonstrated with a real-world example by simulating a 30-day period including a series of extreme heat events occurring on the eastern shore of the Red Sea region in June 2012. The results obtained by using the coupled model, along with those in forced stand-alone oceanic or atmospheric simulations, are compared with observational data and reanalysis products. It is shown that the coupled model is capable of performing coupled ocean–atmosphere simulation. In addition, a scalability test is performed to investigate the parallelization of the coupled model. The results indicate that the coupled model code scales well and the ESMF/NUOPC coupler accounts for less than 5% of the total computational resources in the Red Sea test case. The coupled model and documentation are available at UCSD library (https://library.ucsd.edu/dc/collection/bb1847661c), and the source code is maintained at Github (https://github.com/iurnus/scripps_kaust_model).

Figure 1: The schematic description of the coupled ocean–atmosphere model. The yellow block is the ESMF/NUOPC coupler; the red blocks are the implemented MITgcm–ESMF and WRF–ESMF interfaces; the white blocks are the oceanic and atmospheric components. From WRF to MITgcm, the coupler collects the atmospheric surface variables and updates the surface forcing to drive MITgcm. From MITgcm to WRF, the coupler collects oceanic surface variables and updates them in WRF as the bottom boundary condition.

Figure 2: The parallel efficiency test of the coupled model in the Red Sea region, employing up to 512 CPU cores. The simulation using 32 CPU cores is regarded as the baseline case when computing the speed-up. Tests are performed on the Shaheen-II cluster at KAUST.

Sun, R., A.C. Subramanian, A.J. Miller, M.R. Mazloff, I. Hoteit, and B.D. Cornuelle (2019): SKRIPS v1.0: a regional coupled ocean–atmosphere modeling framework (MITgcm–WRF) using ESMF/NUOPC, description and preliminary results for the Red Sea. Geosci. Model Dev., 12, 4221–4244, https://doi.org/10.5194/gmd-12-4221-2019.

CW3E Publication Notice: Experimental Subseasonal-to-Seasonal (S2S) Forecasting of Atmospheric Rivers Over the Western United States

CW3E Publication Notice

Experimental Subseasonal-to-Seasonal (S2S) Forecasting of Atmospheric Rivers Over the Western United States

October 31, 2019

CW3E scientist Mike DeFlorio, along with co-authors from CW3E (F. Martin Ralph, Luca Delle Monache, Zhenhai Zhang), NASA Jet Propulsion Laboratory/California Institute of Technology (Duane Waliser, Alexander Goodman, Peter Gibson, Shakeel Asharaf), University of California Los Angeles (Bin Guan), University of Colorado (Aneesh Subramanian), ECMWF (Frederic Vitart), ECCC (Hai Lin), and NCEP (Arun Kumar), recently published an article in the S2S Special Issue of the Journal of Geophysical Research – Atmospheres titled “Experimental Subseasonal-to-Seasonal (S2S) Forecasting of Atmospheric Rivers Over the Western United States”.

The purpose of this work is to provide a multi-model hindcast skill assessment of atmospheric river (AR) activity over the western United States at S2S lead times ranging from 1-week to 1-month. In addition, forecasts of “opportunity” and forecasts of “avoidance” where S2S skill is higher or lower than average conditions, respectively, are identified by conditioning forecasts of AR activity on phases of strong El Niño-Southern Oscillation (ENSO) and Madden-Julian Oscillation (MJO) events. It is found that the ECMWF and ECCC hindcast systems are generally more skillful than NCEP hindcast system at predicting AR activity across all lead times, and that hindcasts initialized during MJO Phase 4 [8] are identified as forecasts of avoidance [opportunity] for AR activity at S2S lead times over Central California, with less overall sensitivity of prediction skill to initial ENSO phase.

Average winter-time Brier Skill Score values for “no” and “high” AR activity categories (0 and 3-7 AR days/week, respectively) are shown in Figures 1 and 2, respectively. The ECMWF and ECCC S2S hindcast systems are generally more skillful than NCEP hindcast system at predicting AR activity across all lead times, which can be seen by the higher values (deeper color saturation) across much of the domain in the ECMW and ECCC hindcast systems.

Figure 1: AR1wk NDJFM Brier Skill Score values in each hindcast system (columns) at each lead time (rows) for the ”0 AR days/week” activity level. Values are only plotted if they are > 0 (i.e. skillful with respect to ERA-I reference climatology) and if they are significant at the 95% level using a 100-sample bootstrapping procedure with replacement. The color bar range for Week 1 (top row) is 0 to 0.5, while the color bar range for Weeks 2-4 is 0 to 0.25.

Figure 2: AR1wk NDJFM Brier Skill Score values in each hindcast system (columns) at each lead time (rows) for the ”3-7 AR days/week” activity level. Values are only plotted if they are > 0 (i.e. skillful with respect to ERA-I reference climatology) and if they are significant at the 95% level using a 100-sample bootstrapping procedure with replacement. The color bar range for Week 1 (top row) is 0 to 0.5, while the color bar range for Weeks 2-4 is 0 to 0.25.

An example of a forecast of opportunity is shown in Figure 3. ECMWF hindcasts initialized during MJO Phase 8 are identified as a forecast of opportunity for AR activity at week-2 lead time over Central California. In this case, a 15-20% average reduction in false alarms for AR activity is seen.

Figure 3: Schematic of Relative Operating Characteristic (ROC) statistics of AR activity (hit, miss, false alarm, correct rejection) used this study; b) ROC statistics for Central California region for all NDJFM days (black) and MJO Phase 8 initial condition composite (red) as a function of week-long lead window (symbols) in the ECMWF hindcast system.

This work represents the first multi-model hindcast skill assessment of AR activity out to 1-month lead time (building on the work of Nardi et al. 2018 and DeFlorio et al. 2019a). Experimental near real-time forecasts of AR activity are also introduced and are presently being evaluated between CW3E, NASA JPL, NCEP, and stakeholders at California DWR.

DeFlorio, M. J., D. E. Waliser, F. M. Ralph, B. Guan, A. Goodman, P. B. Gibson, S. Asharaf, L. Delle Monache, Z. Zhang, A. C. Subramanian, F. Vitart, H. Lin, and A. Kumar (2019b), Experimental subseasonal-to-seasonal (S2S) forecasting of atmospheric rivers over the western United States. Journal of Geophysical Research – Atmospheres, 124. doi:10.1029/2019JD031200.

DeFlorio, M. J., D. E. Waliser, B. Guan, F. M. Ralph, and F. Vitart (2019a), Global evaluation of atmospheric river subseasonal prediction skill. Climate Dynamics, 52. 309. doi:10.1007/s00382-018-4309-x..

Nardi, K., E. Barnes, and F. M. Ralph (2018), Assessment of Numerical Weather Prediction Model Re-Forecasts of the Occurrence, Intensity, and Location of Atmospheric Rivers along the West Coast of North America. Monthly Weather Review, 146, 3343–3362, doi:10.1175/MWR-D-18-0060.1.

CW3E Post-Event Summary: 16-22 October 2019

CW3E Post-Event Summary: 16-22 October 2019

October 23, 2019

Click here for a pdf of this information.

Unsettled weather pattern produces an extended period of heavy precipitation over the Pacific Northwest

  • Excessive precipitation in western Washington and northwestern Oregon during 16-22 October was associated with a series of storms and landfalling ARs
  • NWS Stage IV data suggests that more than 10 inches of precipitation fell over much of the Olympic Mountains and North Cascades
  • The last episode of heavy precipitation on 21–22 Oct triggered flooding along the Snoqualmie and Snohomish Rivers


Summary provided by C. Castellano, C. Hecht, B. Kawzenuk, J. Kalansky, F. M. Ralph; 4 PM PT 23 October 2019

Distribution of Landfalling Atmospheric Rivers over the U.S. West Coast During Water Year 2019: End of Water Year Summary

Distribution of Landfalling Atmospheric Rivers over the U.S. West Coast During Water Year 2019: End of Water Year Summary

October 23, 2019

For a pdf of this information click here.
 

*Arrows on this map are placed where each atmospheric river was strongest over the coastline.


Link to a post-event summary of the 25 to 27 February 2019 AR here
 

GOES 17 Longwave IR

Valid 0000 UTC 25 February – 1200 UTC 27 February 2019

Analysis by Chad Hecht & F. Martin Ralph. This analysis is considered experimental. For questions regarding the data or methodology please contact Chad Hecht

CW3E Lead Engineer Receives Service Award

CW3E Lead Engineer Receives Service Award

October 7, 2019

On 3 October 2019, CW3E Lead Engineer Douglas Alden received an award for 30 years of service to Scripps Institution of Oceanography, University of California San Diego. Douglas has spent his career designing systems and deploying instrumentation that measure crucial environmental parameters from the bottom of the ocean all the way into the stratosphere. CW3E is grateful to have him now officially and permanently on our team.

Douglas Alden (middle) with Chancellor Pradeep Khosla and Campus Chief Human Resources Director Nancy Resnick.

CW3E Participates in 3rd ARTMIP Workshop

CW3E Participates in 3rd ARTMIP Workshop

October 21, 2019

The 3rd Atmospheric River Tracking Method Intercomparison Project (ARTMIP) Workshop was recently held at Lawrence Berkeley National Laboratory (LBNL) in Berkeley, California.

ARTMIP, started in 2017, is a collaborative effort to understand and quantify the uncertainty in atmospheric river (AR) climatology, precipitation, and impacts that arise because of different AR detection/tracking methodologies, and investigate how these AR-related metrics may change in the future. The climatological characteristics of ARs, such as AR frequency, duration, intensity, and seasonality, are all strongly dependent on the method used to identify ARs. Meanwhile, the uncertainty in precipitation attributable to ARs has significant implications for our understanding of how ARs contribute to regional hydroclimate now and in the future. The ARTMIP project also aims to provide guidance regarding the advantages and disadvantages of these different AR detection/tracking methods, and which of these methods are best suited to answer certain scientific questions.

The goals of the 3rd ARTMIP workshop were:

  • Presentation of results from recent and ongoing ARTMIP research: Tier 1* and beyond (with a focus on Tier 2*)
  • Working discussion of current and future ARTMIP experiments and papers
  • Solicitation of expert identification of atmospheric rivers and other weather phenomena for machine learning

(*ARTMIP Tier 1: Participants run their algorithms on a common dataset and adhere to a common format. Act as a baseline for all Tier 2 subtopics. Tier 2: Designed to test sensitivities and dig into topical science questions.)

Several members of CW3E are participating in ARTMIP and attended the 3 rd ARTMIP Workshop in Berkeley, including Allison Michaelis, Christopher Castellano, Cody Poulsen, Michael
DeFlorio, and Zhenhai Zhang. Allison presented her high-resolution simulations using the Model for Prediction Across Scales (MPAS) for use in climate change studies. Allison’s simulations provide an additional dataset to ARTMIP and could be used to examine AR variability based on ENSO, investigate the impacts of increased model resolution (15-km) on the simulation of ARs, and explore the consistency of the climate change signals across modeling frameworks. Zhenhai shared his work on the relationship between ARs and extratropical cyclones in the workshop when the relevant questions were raised. Following his previous work, Zhenhai will investigate the interaction between ARs and cyclones through their life cycles using the AR tracking methods from ARTMIP, as well as explore the uncertainties due to different AR tracking methods.

The main outcome of the workshop will be to produce a workshop report and summary paper describing how detection method uncertainty affects our understanding of ARs – particularly with respect to AR impacts, variability, and trends. The report includes four sections: (1) Introduction to ARTMIP, lead by Christine Shields from NCAR; (2) Ongoing ARTMIP Activities, lead by Jonathan Rutz from NWS; (3) AR Tracking Uncertainty, lead by Ashley Payne from University of Michigan; and (4) ARTMIP Going Forward, lead by Travis O’Brien from LBNL.

For more information on ARTMIP, visit the ARTMIP website.

CW3E AR Update: 17 October Outlook

CW3E AR Update: 17 October Outlook

October 17, 2019

Click here for a pdf of this information.

Pacific Northwest Forecast to Receive Extended Duration of AR Conditions Next Week

  • A series of systems is forecast to bring several days of atmospheric river conditions to the Pacific Northwest
  • While uncertainty is currently high, southern Washington and Northern Oregon could experience AR condition durations >50-hours
  • Maximum IVT magnitudes over Coastal Pacific Northwest could exceed 750 units
  • Due to the long duration and potential for strong IVT magnitude, the NOAA WPC is currently forecasting as much as 15 inches of precipitation over the higher elevations of the Pacific Northwest

Click IVT or IWV image to see loop of 0-180 hour GFS forecasts

Valid 1200 UTC 17 October – 0000 UTC 25 October 2019


Summary provided by C. Hecht, B.Kawzenuk, J. Kalansky, F. M. Ralph; 3 PM PT 17 October 2019

CW3E Welcomes Ava Cooper

CW3E Welcomes Ava Cooper

October 1, 2019

Ava Cooper joined CW3E as a Field Researcher in September 2019. In 2017, Ava earned her BS in Climate Science from Oregon State University where she conducted snow surveys in the Mackenzie River basin. Ava completed her Masters in Hydrology at the University of Nevada, Reno in August 2019 as part of Adrian Harpold’s Nevada Mountain Ecohydrology Lab. She conducted her research in the beautiful Sagehen Creek watershed, north of Lake Tahoe, where she focused on snowmelt-driven differences in tree water use in the Sierra Nevada. During this time, Ava deployed sensors to measure sap flow, snow, and surface meteorology in Sagehen Creek watershed. Her thesis work was comprised of an empirical analysis of tree water use using the sap flow data as well as a model intercomparison project on land surface model skill in predicting key characteristics of seasonal transpiration. The research showed that earlier soil moisture limitations on tree water use, driven by earlier snow disappearance, shifted peak tree water use earlier in the growing season and earlier snow disappearance led to longer durations of soil moisture limitations on tree water use. The model intercomparison found that more complex representations of transpiration were necessary to simulate the timing of seasonal peak tree water use.

As part of the field research team at CW3E, Ava will support observational efforts in the Forecast Informed Reservoir Operations (FIRO) Program. Ava is excited to support snow-related research efforts and continue studying snow hydrology, meteorology, and climate science in the Sierra Nevada, California.

CW3E Post Event Summary: 22-26 September 2019

CW3E Post Event Summary: 22-26 September 2019

September 27, 2019

Click here for a pdf of this information.

Active synoptic pattern brings heavy rainfall and severe weather to central and southeastern Arizona

  • Portions of central and southeastern AZ received > 2 inches of rainfall during the 7-day period ending 12 UTC (5 AM PST) 27 September
  • The highest rainfall amounts (> 3 inches) occurred over the elevated terrain in Maricopa, Gila, Yavapai, Pima, Santa Cruz, and Cochise Counties
  • Roosevelt Dam (Gila County) recorded a 7-day total of 7.62 inches, with more than 6 inches falling during the 12-hour period ending 00 UTC 24 September (5 PM PST 23 September)
  • Flash flooding and severe thunderstorms were reported during the morning and afternoon of 23 September
  • Strong synoptic-dynamic forcing and moisture from the remnants of Tropical Storm Mario both played important roles in this event


Summary provided by C. Castellano, B. Kawzenuk, J. Kalansky, F. M. Ralph; 4 PM PT 27 September 2019