CW3E Publication Notice
Synthetic forecast ensembles for evaluating Forecast Informed Reservoir Operations
March 11, 2024
A new article titled “Synthetic forecast ensembles for evaluating Forecast Informed Reservoir Operations” by Zach Brodeur (Cornell University), Chris Delaney (Sonoma Water), Brett Whitin (NOAA/NWS), and Scott Steinschneider (Cornell University) was recently published in the American Geophysical Union’s Water Resources Research. The work supports an ongoing, combined effort between Cornell University, CW3E, NOAA/NWS, USACE, and local water agencies to integrate synthetic forecasts into the development of robust and resilient Forecast Informed Reservoir Operations (FIRO). Prior CW3E-led FIRO viability assessments have identified the development of synthetic forecasts as a key effort to enable the thorough design and testing of FIRO policies, ensuring they are safe and effective across the widest possible range of events.
In the featured work, the authors develop a statistical methodology to generate synthetic ensemble forecasts that emulate the skill and behavior of ensemble forecasts from the NOAA/NWS Hydrologic Ensemble Forecasting System (HEFS). The synthetic forecast approach models the ensemble forecast uncertainty as a function of streamflow observations, enabling the generation of new sets of plausible ensemble forecast sequences for any series of streamflow observations in the historical record (see Figure 1). Since HEFS hindcasts are limited to the period from the early 1980s to present (because of limitations to the satellite record), this capability has the potential to expand the availability of forecast data to the 1950s or earlier in many locations. Moreover, the technique enables generation of plausible ensemble forecasts for any streamflow sequence (e.g. stochastic streamflow models, scaled design events, climate change simulations, etc.), allowing performance assessments of FIRO strategies under a wide range of potential scenarios. The methodology is demonstrated at Lake Mendocino, CA, the pilot site for the FIRO viability assessment process.
Figure 1: Adapted from Figure S3.1 in Brodeur et al. (2024) for inflows at Lake Mendocino, CA. a) HEFS forecast issued 5 days prior to the February 18, 1986 flood, b-d) 3x synthetic HEFS (sHEFS) ensembles for the same event and lead time.
The synthetic forecasting technique presented in this work overcomes earlier limitations in synthetic forecast methodologies that were too simplified to capture the complexities of forecast uncertainty across multiple lead times, sites, and ensemble members at a daily resolution. The evaluation of the synthetic forecast approach consists of two primary efforts: 1) ensemble forecast verification techniques to ensure parity between the synthetic forecasts (syn-HEFS) and actual forecasts (HEFS); and 2) operational validation of the synthetic forecasts using the Ensemble Forecast Operations (EFO) model of Delaney et al. (2020).
The operational validation results for the hindcast period (1986-present) are highlighted below in Figure 2, with particular emphasis on the February 18, 1986 flood. The synthetic HEFS forecasts emulate operational behavior of the single hindcast sequence of the actual HEFS, while also revealing operational vulnerabilities (i.e. potential emergency spillway usage) to alternative ensemble forecasting sequences during extreme events.
Figure 2: Adapted from Figure 9 in Brodeur et al. (2024). a) Lake Mendocino storage time series for HEFS, perfect forecast operations (PFO), and 100x samples of synthetic forecasts; b) as in (a), but zoomed in to the February 18, 1986 event; c) as in (b) but for the reservoir release time series.
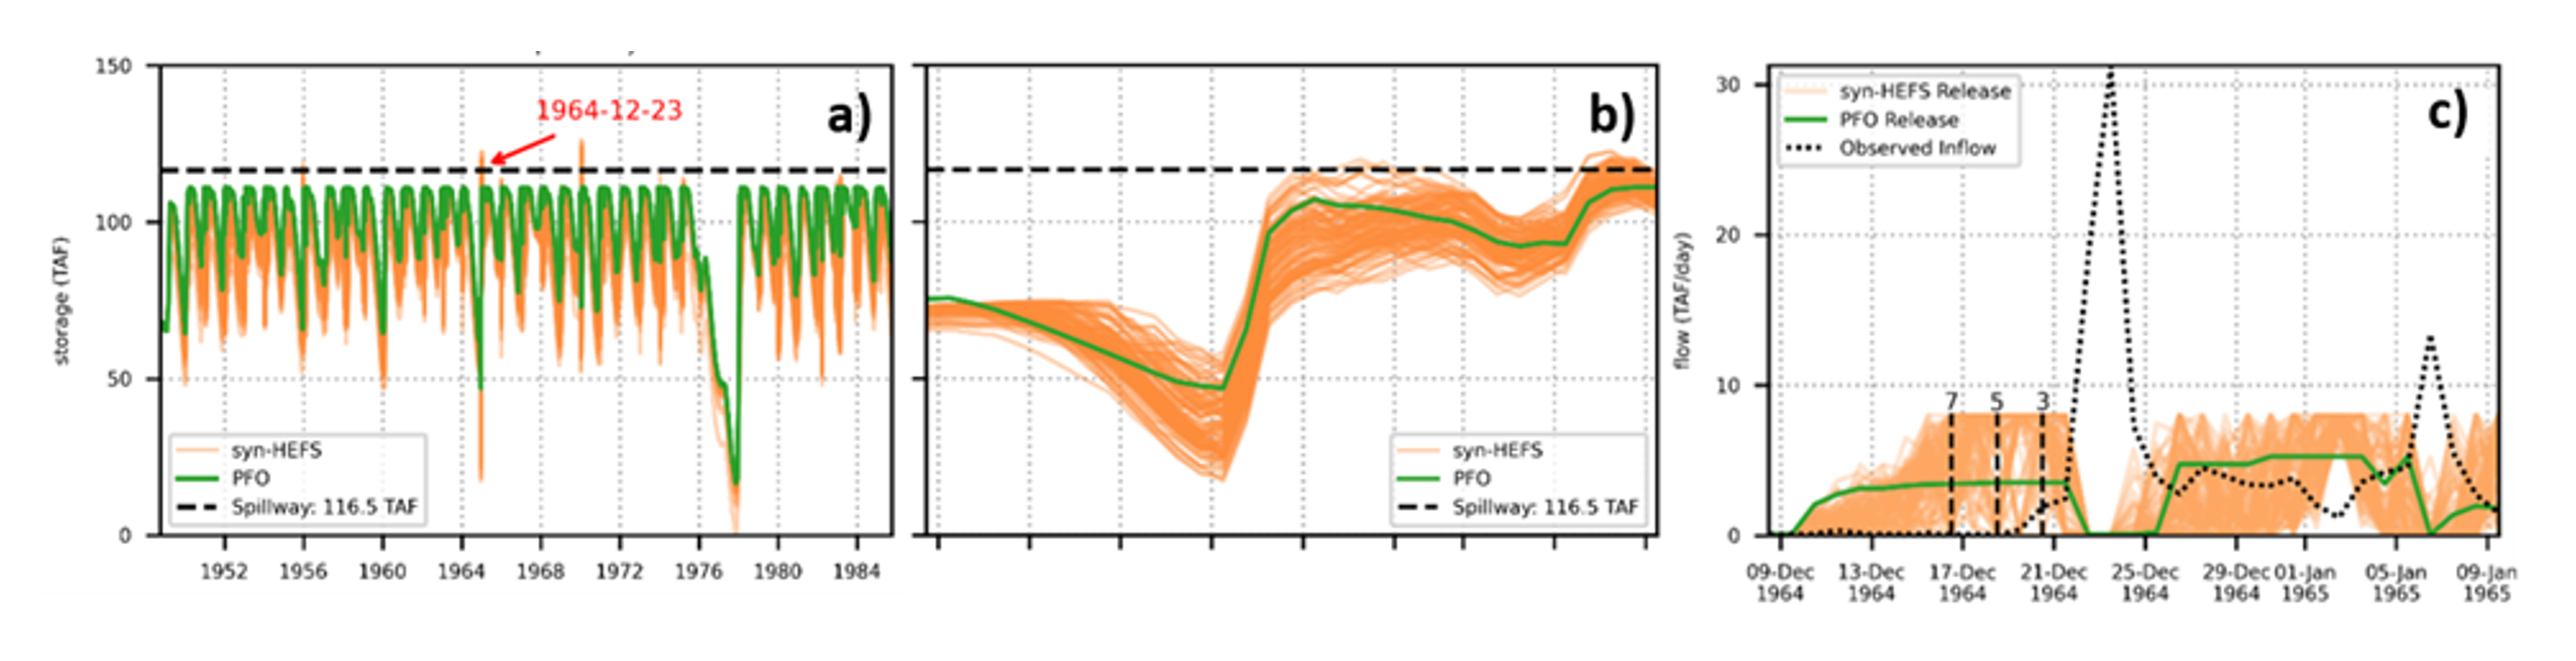
Figure 3 demonstrates the capability to extend synthetic HEFS forecasts to the pre-hindcast period (prior to 1985) and assess operational policy performance outside the available hindcast record. This demonstration shows that the synthetic forecast approach is an effective risk analysis tool and underscores their potential for out-of-sample FIRO policy evaluation.
Figure 3: Adapted from Figure 10 in Brodeur et al. (2024). As in Figure 2, but for the pre-hindcast period (1948-1985) for (a) and zoomed in to the December 23, 1964 event for (b-c). Importantly, there are no available HEFS forecasts to compare in this period.
Overall, the study showcases an extremely important ‘first-of-its-kind’ effort towards the development of a synthetic ensemble forecasting methodology that operates at the requisite resolution needed for operationally relevant FIRO risk analysis. The synthetic forecast work is a continuing collaboration between Cornell University and CW3E and opens the door to a wide variety of potential future studies and exciting potential to integrate with ongoing FIRO activities, including forthcoming viability assessments.
Brodeur, Z. P., Delaney, C. , Whitin, B., & Steinschneider, S. (2024). Synthetic forecast ensembles for evaluating Forecast Informed Reservoir Operations. Water Resources Research, 60(2) e2023WR034898. https://doi.org/10.1029/2023WR034898
Delaney, C. J., Hartman, R. K., Mendoza, J., Dettinger, M., Delle Monache, L., Jasperse, J., et al. (2020). Forecast Informed Reservoir Operations using ensemble streamflow predictions for a multipurpose reservoir in Northern California. Water Resources Research, 56(9). https://doi.org/10.1029/2019WR026604