CW3E AR Update: 18 October 2017 Outlook

CW3E AR Update: 18 October 2017 Outlook

October 18, 2017

Click here for a pdf of this information.

Multiple ARs forecast to Impact U.S. West Coast

  • A potentially extreme AR is forecast to make landfall over the Pacific Northwest today
  • NWS precipitation forecasts show accumulations of ~10 inches for the Olympic Mountains in northwest Washington
  • A second AR is forecast to make landfall on Saturday, though forecast uncertainty is currently high
  • Total 5-day precipitation accumulations could be as high as 15.5 inches
  • Current soil conditions are dry which could lead to less runoff and lower flooding potential

Click IVT or IWV image to see loop of 0-141 hour GFS forecast

Valid 0600 UTC 18 October – 0300 UTC 24 October 2017

For more information on the satellite imagery and the configuration click here


Summary provided by C. Hecht, B. Kawzenuk, and F.M. Ralph; 1 PM PT Wednesday 18 October 2017

*Outlook products are considered experimental

CW3E, UCAR, and NCAR Meet to Discuss West-WRF Regional Model Development

CW3E, UCAR, and NCAR Meet to Discuss West-WRF Regional Model Development

October 9, 2017

On 4-5 October 2017, CW3E had the privilege of hosting visitors from NCAR and UCAR to discuss the development and implementation of West-WRF, the regional forecast model that CW3E is developing focusing on extreme precipitation. The team from UCAR and NCAR included Bill Kuo, the director of UCAR Community Programs, who also helped lead the development of WRF. Chris Davis, NCAR associate director and leader of the Mesoscale and Microscale Meteorology (MMM) Laboratory also attended, along with, David Gill, Jake Liu, and Wei Wang, WRF experts in computation, data assimilation, and modeling, respectively.

The first day of the two day visit began with CW3E director, Marty Ralph, briefing the NCAR/UCAR visitors on CW3E, and how West-WRF supports the mission and goals of the center. After this introduction, CW3E researchers and staff had the opportunity to learn about best practices with respect to WRF computation, modeling, and data assimilation, as well as the new MPAS modeling system. The entire CW3E group had lunch with the NCAR/UCAR visitors and had a chance to hear all the CW3E updates including on AR reconnaissance, publications, and instrument deployments.

After lunch, the CW3E West-WRF team shared the current applications and status of the West-WRF development with the UCAR/NCAR team. The afternoon ended with Bill Kuo giving the CASPO seminar on assessment of the impacts of assimilation of COSMIC radio occultation measurements in typhoon forecasts. The second day of the visit, allowed for detailed discussions on many of the technical aspects of West-WRF development and applications. The UCAR/NCAR team provided recommendations to the CW3E researches and staff on ways to improve the implantation of West-WRF as well as design experiments. In addition the groups discussed ways for the CW3E team to provide feedback in the WRF development at NCAR/UCAR through sharing new code for verification metrics and scientific and technical advancements made through recent experiments. The meeting was a very productive initial collaboration between CW3E and UCAR/NCAR and we are looking forward to many more. The engagement of UCAR and NCAR in supporting one of its member institutions technical development efforts is greatly appreciated.

CW3E Graduate Student Accepted into Science Policy Fellows Program

CW3E Graduate Student Accepted into Science Policy Fellows Program

October 3, 2017

Third-year graduate student, Meredith Fish, has been accepted into the Science Policy Fellows Program at the School of Global Policy and Strategy (GPS). The fellowship, which is open to Ph.D. candidates at Scripps Institution of Oceanography, Jacobs School of Engineering and School of Medicine, works with GPS faculty to discover the policy relevance and potential implications of their dissertation. Created with the goal of bridging physical and social sciences across the UC San Diego campus, the students gain an understanding of the benefits of using a multidisciplinary approach to help solve some of our global issues.

Meredith will be working with GPS faculty members, Kate Ricke and Jennifer Burney, on the policy implications of successive atmospheric rivers (ARs). ARs are a large contributor to California’s water supply, providing approximately 50% of it’s water year precipitation, but can also have negative impacts, such as widespread flooding and debris flows. Families of events, which are defined as ARs that successively occur within 120 hours of each other, can have enhanced impacts as pre-conditioning from the first AR can elevate the chances of high streamflow and saturated soils, which leads to shorter time frames to safely release stored water downstream. She will work with her GPS mentors on the issues of aging infrastructure, snowpack becoming a less reliable water storage system, and the potentials of implementing a flexible rule curve for dam operators.

The fellowship will conclude with a presentation of the fellow’s research findings in the spring quarter. The fellow will also have the opportunity to attend policy-related seminars, workshops and courses.

CW3E graduate student, Meredith Fish (center), with her GPS Faculty Mentors Kate Ricke (left), and Jennifer Burney (right).

CW3E Releases New Interactive Geospatial Observation and Forecast Maps

CW3E Releases New Interactive Geospatial Observation and Forecast Maps

Spetember 18, 2017

CW3E has released a new interactive mapping tool that takes advantage of “web mapping services”, GIS-based coding/thinking, and interactive technologies in order to provide dynamic weather analysis graphics in support of the CW3E mission. These interactive maps allow the user to display and interact with numerous variables from a synoptic to a watershed scale with the goal of providing insight into potential impacts of landfalling atmospheric rivers over California.

This interactive tool was developed as a means to geospatially visualize meteorological and hydrologic observations on a new platform and from a new perspective. This first set of maps/webpages illustrate the utility of the tool in displaying atmospheric river related forecast products and CW3E will continue to build upon the tool. As we continue to experiment in improving and expanding the tool, we encourage any feedback or suggestions. Please contact the website creator or the CW3E Webmaster with any questions or feedback you may have.

The development of the tool and maps/webpage is supported by the California Department of Water Resources. The page was created and developed by CW3E collaborator Dr. Jason Cordeira and CW3E Director Dr. F. Martin Ralph with input from CW3E researchers Brian Kawzenuk, Chad Hecht, and Dr. Julie Kalansky.

Click here to view the new interactive geospatial observation and forecast maps.

CW3E Publication Notice: Dropsonde Observations of Total Integrated Water Vapor Transport within North Pacific Atmospheric Rivers

CW3E Publication Notice

Dropsonde Observations of Total Integrated Water Vapor Transport within North Pacific Atmospheric Rivers

Spetember 14, 2017

F. Martin Ralph, director of CW3E, along with collaborators, recently published a paper in the American Meteorological Society’s Journal of Hydrometeorology: Ralph, F. M., S. Iacobellis, P. Neiman, J. Cordeira, J. Spackman, D. Waliser, G. Wick, A. White, and C. Fairall, 2017: Dropsonde Observations of Total Integrated Water Vapor Transport within North Pacific Atmospheric Rivers. J. Hydrometeor., 18, 2577-2596, https://doi.org/10.1175/JHM-D-17-0036.1

This study uses vertical profiles of water vapor, wind, and pressure obtained from 304 aircraft dropsondes across 21 ARs, in the midlatitudes as well as the subtropics, which were deployed during various experiments since the winter of 1998, including CALJET (Ralph et al. 2004), Ghostnets (Ralph et al. 2011), WISPAR (Neiman et al. 2014), CalWater-2014, CalWater-2015 (Ralph et al. 2016), and AR Recon-2016. Dropsondes provide the best measurements to date of horizontal water vapor transport in atmospheric rivers (ARs) and can document AR structure. Different methods of defining AR edges, using either integrated vapor transport (IVT) or integrated water vapor (IWV), were compared.

The study found that total water vapor transport (TIVT) in an AR averaged nearly 5×10⁸ kg s-1, which is 2.6 times larger than the average discharge of liquid water from the Amazon River. The mean AR width was 890 ± 270 km. Subtropical ARs contained larger IWV but weaker winds than midlatitude ARs, although average TIVTs were nearly the same. Mean TIVTs calculated with an IVT-threshold versus an IWV- threshold produced results that differed by only 4% on average, although they did vary more between midlatitudes and subtropical regions. In general, important AR characteristics such as width and TIVT are less dependent on latitude when the IVT-threshold is used, and the IWV threshold often was not crossed on the warm side of subtropical ARs, so IVT represents a more robust threshold across a wider range of conditions than IWV.

Results were summarized in a schematic to illustrate the AR structure in 3 dimensions (see below). This schematic was used in the AR definition that was recently published in the American Meteorological Society’s Glossary of Meteorology.

Figure 1: Schematic summary of the structure and strength of an atmospheric river based on dropsonde measurements analyzed in this study, and on corresponding reanalyses that provide the plan-view context. (a) Plan view including parent low pressure system, and associated cold, warm, stationary and warm-occluded surface fronts. IVT is shown by color fill (magnitude, kg m-1 s-1) and direction in the core (white arrow). Vertically integrated water vapor (IWV, cm) is contoured. A representative length scale is shown. The position of the cross-section shown in panel (b) is denoted by the dashed line A-A’. (b) Vertical cross-section perspective, including the core of the water vapor transport in the atmospheric river (orange contours and color fill) and the pre-cold-frontal low-level jet (LLJ), in the context of the jet-front system and tropopause. Water vapor mixing ratio (green dotted lines, g kg-1) and cross-section-normal isotachs (blue contours, m s-1) are shown. Magnitudes of variables represent an average mid-latitude atmospheric river with lateral boundaries defined using the IVT threshold of 250 kg m-1 s-1. Depth corresponds to the altitude below which 75% of IVT occurs. Adapted primarily from Ralph et al. 2004 and Cordeira et al. 2013.

CW3E Publication Notice: The Chiricahua Gap and the Role of Easterly Water Vapor Transport in Southeastern Arizona Monsoon Precipitation

CW3E Publication Notice

The Chiricahua Gap and the Role of Easterly Water Vapor Transport in Southeastern Arizona Monsoon Precipitation

Spetember 13, 2017

Click here for personal use pdf file

This study is a collaborative effort between CW3E and University of Arizona that identifies a terrain feature along the Arizona-New Mexico border just north of Mexico that is potentially important to the weather and climate of the southeast Arizona summer monsoon. The terrain feature is a “gap” that is approximately 250 km across and 1 km deep and represents the lowest terrain elevation along the 3000-km length the Continental Divide from 16-45°N. The name “Chiricahua Gap” is introduced to identify this key terrain feature, which reflects the name of a nearby mountain range in southeast Arizona and the region’s Native American history. The importance of the Chiricahua Gap is that it represents the primary pathway in which low altitude atmospheric water vapor is transported across the Continental Divide.

Motivated by identification of the Chiricahua Gap, upper-air observations from a wind profiling radar in Tucson, model reanalyses (Climate Forecast System Reanalysis), and gridded daily precipitation data (NCEP Stage-IV) are used to construct a case study and 15-year climatology to link summer monsoon rainfall events in southeast Arizona to low-altitude water vapor transport within the Chiricahua Gap. The results show that 76% of the wettest summer monsoon days in southeast Arizona during 2002-2016 occurred in conditions of low-altitude easterly water vapor transport in the Chiricahua Gap on the previous day. This result highlights how low-altitude water vapor associated with the wettest summer monsoon days in southeast Arizona originates from the east side of the Continental Divide, which differs from previous studies published since the 1970s. Much of the recent scientific literature points to southwesterly surges of low-altitude water vapor from over the Gulf of California as the primary driver of rainfall over southern Arizona during the summer monsoon. The current study by F. M. Ralph and T. J. Galarneau shows that the source region of low-altitude water vapor in southeast Arizona during the summer monsoon is potentially more complex, and is significantly influenced by source regions east of the Divide.

The paper is an example of CW3E expanding its research to examine the dynamics of the North American monsoon. Because monsoon is an important source or water for the US southwest and can cause flooding events, particularly flash floods, better understanding and improving forecasts of the North American monsoon is and important component of CW3E achieving its goal of revolutionizing the physical understanding, observations, weather predictions, of extreme events in Western North America and their impacts on floods, droughts, hydropower, ecosystems and the economy.

Figure 1: Terrain height (shaded in m) over Arizona, New Mexico, western Texas, and northern Mexico. Key terrain features are labeled in black. The location of Tucson, Arizona, is labeled by the black-filled circle. Low-altitude easterly water vapor transport through the Chiricahua Gap is shown by the blue arrows. This figure is modified from Fig. 1b in Ralph and Galarneau (2017).

CW3E Publication Notice: Characterizing the Influence of Atmospheric River Orientation and Intensity on Precipitation Distribution over North-Coastal California

CW3E Publication Notice

Characterizing the Influence of Atmospheric River Orientation and Intensity on Precipitation Distributions over North-Coastal California

Spetember 12, 2017

Chad Hecht, a CW3E staff researcher, and Jason Cordeira, a CW3E affiliate and professor at Plymouth State University, recently published an article in AGU Geophysical Research Letters: Hecht, C. W., and J. M. Cordeira, 2017: Characterizing the Influence of Atmospheric River Orientation and Intensity on Precipitation Distribution over North-Coastal California. Geophys. Res. Lett., 44, doi:10.1002/2017GL074179. click here for personal use pdf file.

The key result of the study found that south-southwesterly oriented atmospheric rivers (ARs) produce significantly more Russian River watershed areal-average precipitation compared to westerly ARs (median areal-precipitation of 13 mm vs. .5 mm). This difference in precipitation accumulations is attributed to both the orientation of water vapor flux relative to the watershed topography and large-scale forcing that results in ascent.

The study uses clustering to objectively identify different orientations and intensities of ARs that make landfall over the California Russian River watershed (Fig. 1). Daily averaged IVT was calculated using 11-years of National Centers for Environmental Prediction (NCEP)–Climate Forecast System Reanalysis (CFSR) data spanning from 1 January 2004 to 31 December 2014. The paper analyzed the synoptic-scale flow configurations and resulting precipitation accumulations and distributions of westerly and south-southwesterly oriented ARs (Orange and Blue clusters in Fig. 1b).

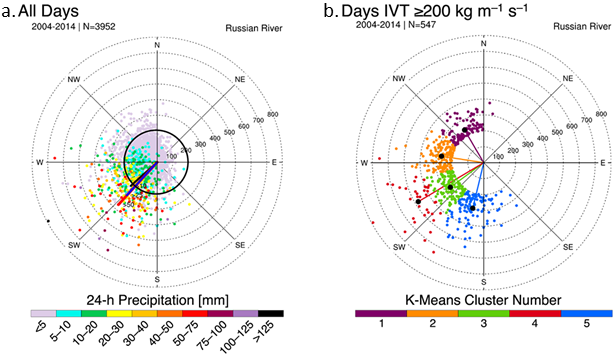
Figure 1. (a) Domain averaged daily IVT direction (angular coordinate) and magnitude (kg m/s ; radial coordinate) for all days from 1 January 2004 to 31 December 2014 that data were available. Markers are color-coded based on 24-h accumulated precipitation (mm). The colored lines illustrate the average IVT for days with precipitation >10 (black), >25 (blue) and >50 mm (red). The 200 kg/m/s threshold that was applied in this study is shown by the black circle. (b) As in (a) except for days with daily average IVT ≥200 kg/m/s and color-coded based on K-means cluster.

Composite analyses illustrate the vastly different synoptic-scale characteristics associated with westerly and south/southwesterly ARs (Cluster 2 and Cluster 3). These different synoptic-scale flow configurations result in differences in synoptic scale forcing co-located over the composite AR and the Russian River watershed (Fig. 2).

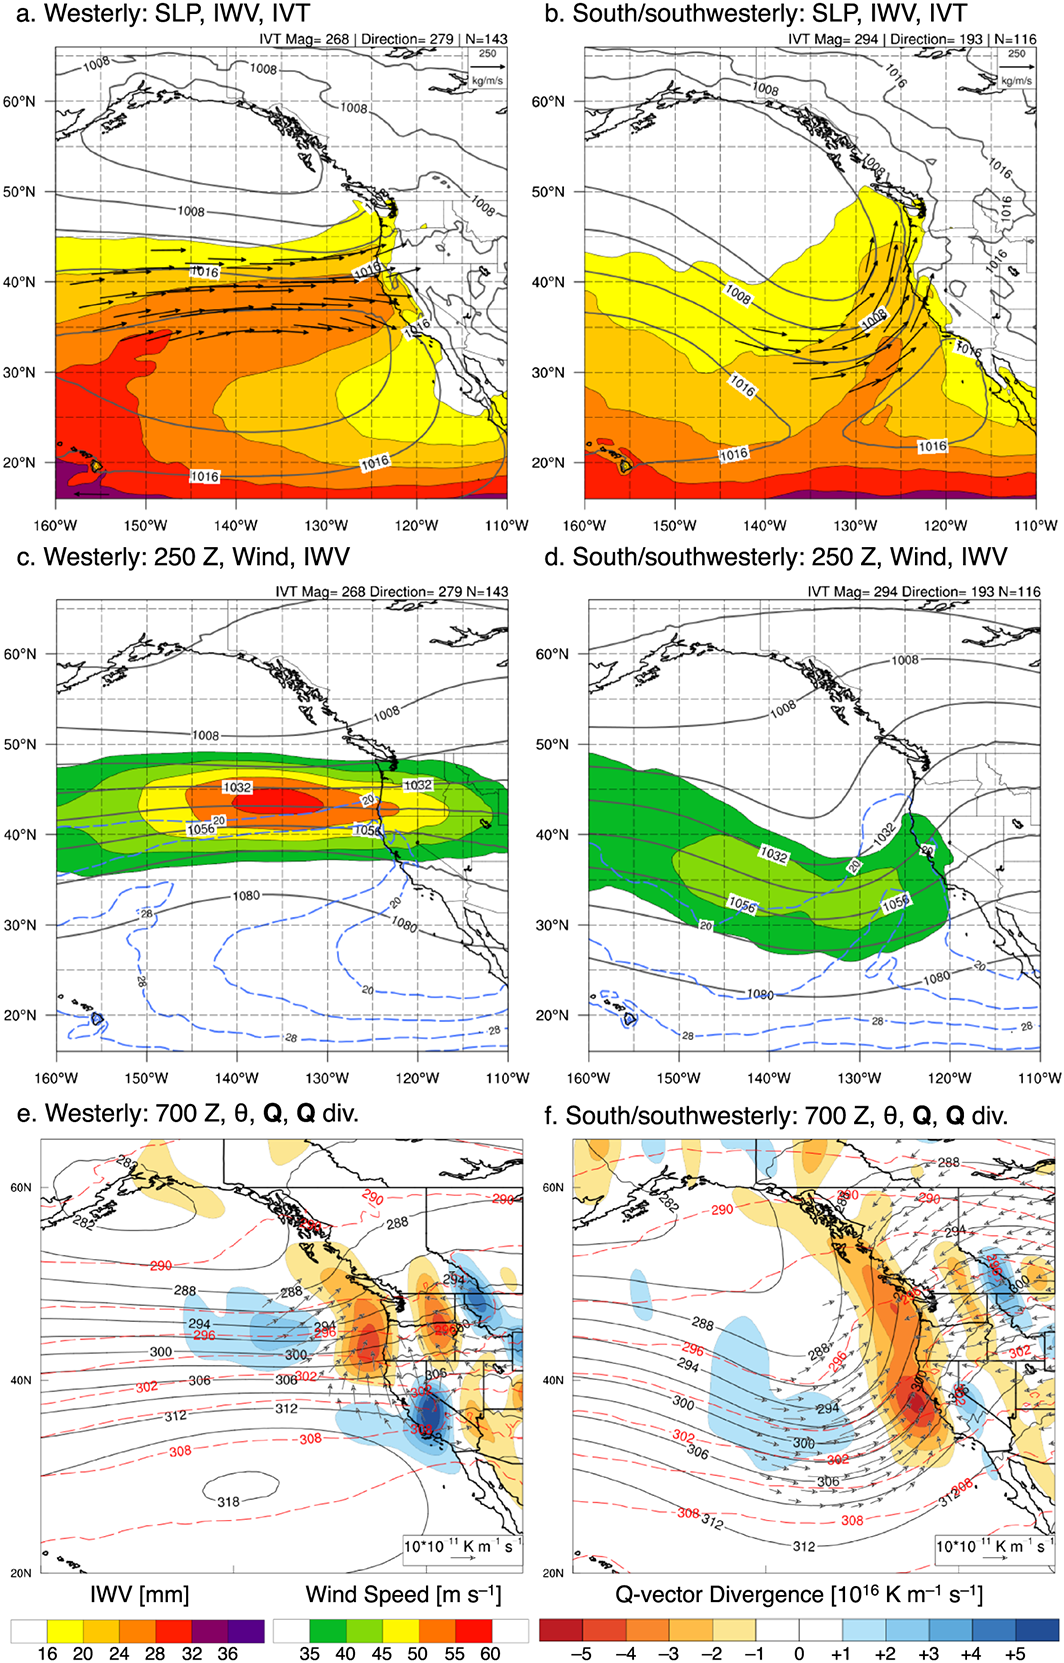
Figure 2. (a, b) Composite mean IVT (kg/m/s ; plotted according to the reference vector in the upper right), SLP (hPa; contoured), and IWV (mm; color-coded according to scale), (c, d) composite mean 250-hPa geopotential height (dam; contoured), wind speed (m s–1 ; colorcoded according to scale), and IWV (mm; dashed blue contour), and (e, f) composite mean 700-hPa geopotential height (dam; solid contours), Q-vectors (1011 K/m/s ; plotted according to the reference vector in the bottom right), Q-vector divergence (1016 K/m/s ; color-coded according to scale) and potential temperature (K; dashed red contours) at t–12 h during (a,c,e) westerly and (b,d,f) south–southwesterly ARs.

The large difference in Russian River watershed area-averaged precipitation between westerly and south-southwesterly ARs (Fig. 3a) is not likely explained by statistically similar cluster IVT magnitudes (i.e., AR intensity; Fig. 3b) and IWV values (Fig. 3e) but likely a combination of a more favorable southwesterly IVT direction (i.e., AR orientation) relative to the orientation of the local topography and favorable synoptic-scale forcing for ascent (Fig. 2) illustrated by Q-vector convergence (Fig. 3d). While both AR types exhibit significantly statistically similar mean IVT, south-southwesterly ARs are associated with statistically significantly higher mean low-level IVT (1000–850 hPa; Fig. 3c).

Results from this study suggest that extreme precipitation produced by ARs is the result of both upslope moisture flux and quasi-geostrophic forcing for ascent.

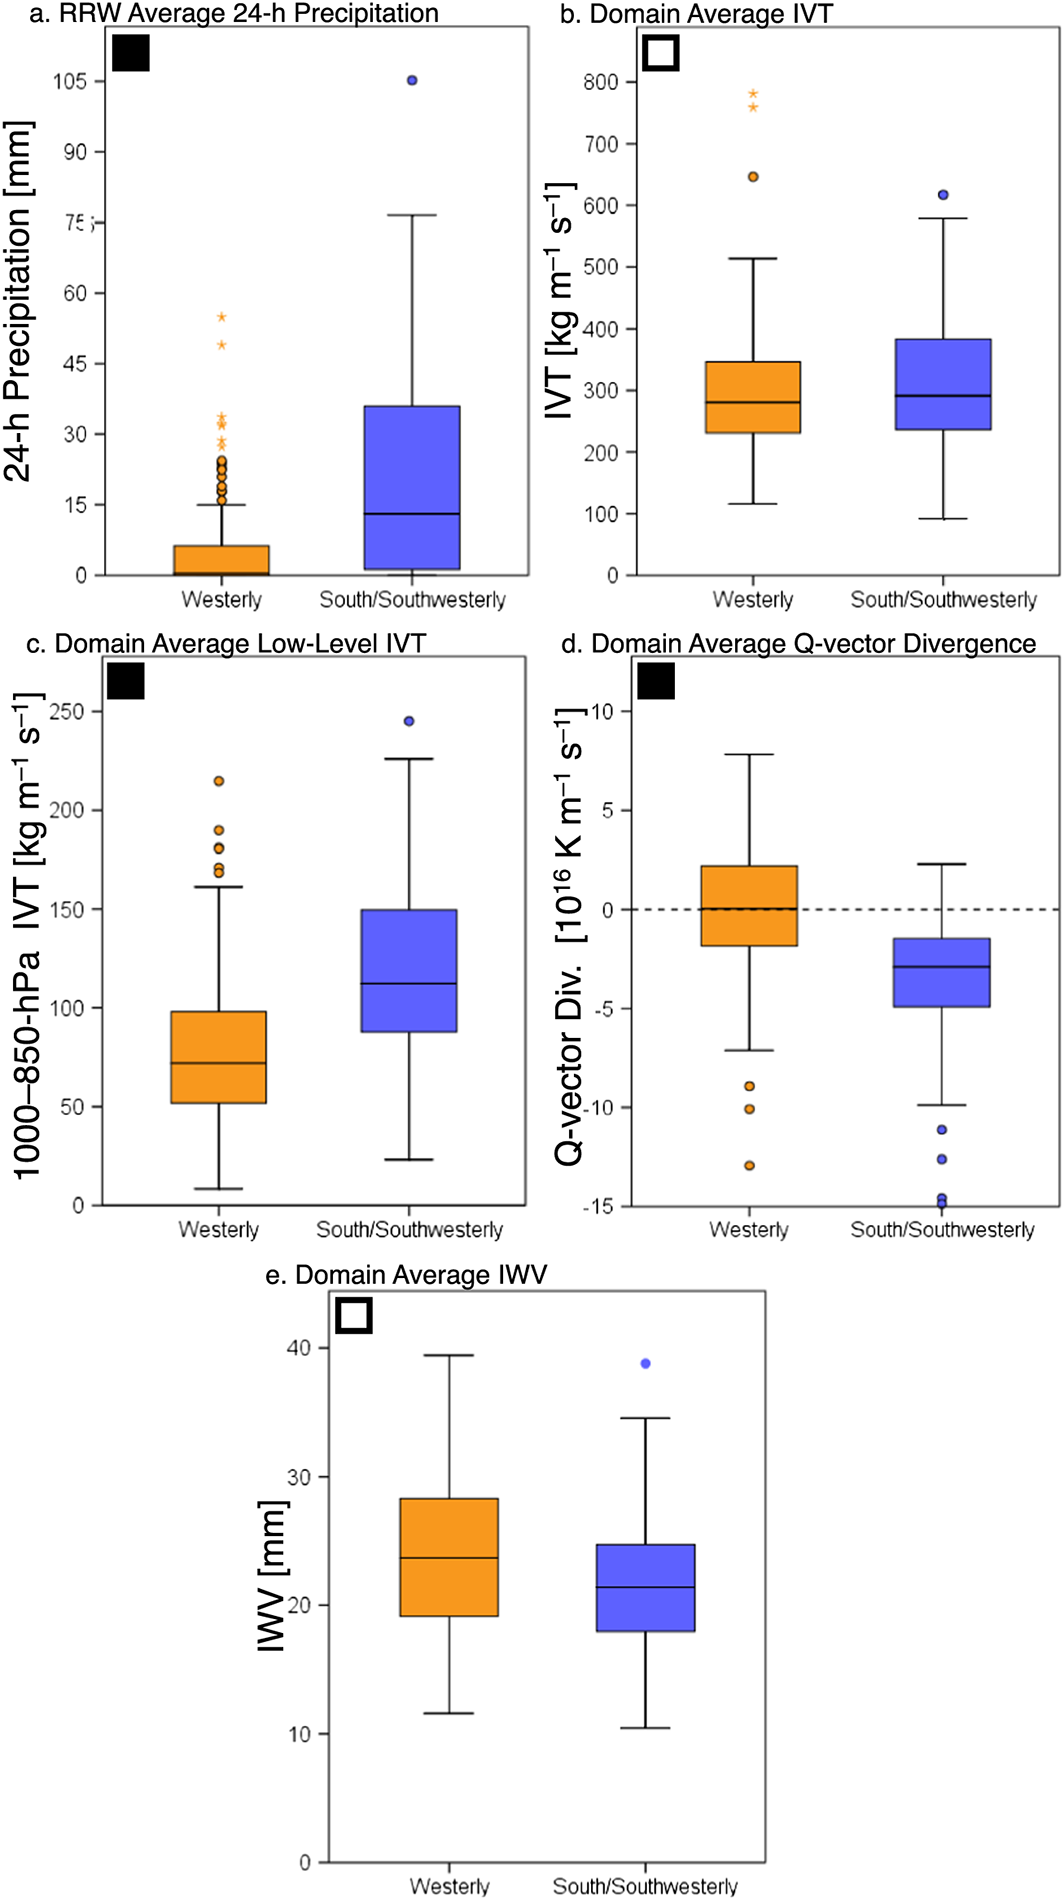
Figure 3. Box and whisker plots of Russian River Watershed (a) area-average 24-h precipitation (mm), (b) domain average IVT (kg/m/s ), (c) domain average lower tropospheric (1000–850 hPa) IVT (kg/m/s ), (d) domain average Q-vector divergence (1016 K/m/s ), and (e) domain average IWV (mm) for westerly (orange) and south–southwesterly (blue) ARs. The boxes represent the interquartile range of the data and the whiskers represent upper and lower quartile of the data. The horizontal line within the boxes is the median value. The colored dots represent outliers and the asterisks represent extreme outliers. The box in the upper-left corner of each panel indicates the result of the independent samples t-test with 95% confidence (white indicates significantly statistically similar means and black indicates significantly statistically different).

Support for this project was provided by the State of California-Department of Water Resources and the U.S. Army Corps of Engineers, both as part of broader projects led by CW3E. A majority of this work was conducted while Chad was a graduate student at Plymouth State University. Dr. Cordeira and his graduate students at Plymouth State University actively collaborate with CW3E on topics related to atmospheric rivers, such as analyzing, understanding, and forecasting their impacts along the U.S. West Coast.

CW3E Accepted as a National Oceanic and Atmospheric Administration Weather Ready Nation Ambassador

CW3E Accepted as a National Oceanic and Atmospheric Administration Weather-Ready Nation Ambassador

September 7, 2017

CW3E recently became a NOAA Weather-Ready Nation (WRN) Ambassador. The Weather-Ready Nation Ambassador Initiative is a collaborative entity that brings numerous organizations, businesses, and people together in order to strengthen national resilience against extreme weather and water events.

CW3E is being recognized as a WRN Ambassador because it promotes the Weather-Ready Nation messages and themes to their stakeholders and engages with NOAA personnel on potential collaboration opportunities. CW3E is doing this through scientific research to improve forecasts of extreme precipitation and flooding on the west coast, as well as communicating about extreme events through the hydrometeorological outlooks and post-event summaries on the CW3E website and Twitter. CW3E in collaboration with NOAA, will assist in improving the nation’s readiness, responsiveness, and overall resilience against extreme weather.

Becoming a WRN Ambassador advances CW3E one step further in executing our mission to provide 21st Century water cycle science, technology and outreach to support effective policies and practices that address the impacts of extreme weather and water events on the environment, people and the economy of Western North America.

Visit NOAA’s WRN website to learn more about the initiative, its goals, and its participants.

CW3E Field Team Beats the Heat, Installs Meteorology and Hydrology Instruments in Russian River Watershed

CW3E Field Team Beats the Heat, Installs Meteorology and Hydrology Instruments in Russian River Watershed

September 6, 2017

A group of CW3E graduate students, postdocs, and staff worked to install soil moisture, meteorology, and streamflow instruments in the Lake Mendocino watershed August 28 – September 1. Taking extra precautions and shifting work schedules due to California’s triple-digit heat wave, the team installed three soil moisture and surface meteorology arrays and a stream gauge on ranchlands representative of the hilly topography draining into Lake Mendocino. CW3E thanks the landowners who have volunteered to have instruments installed on their properties, as well as Steve Turnbull of the U.S. Army Corps of Engineers for participating in the installations. Two more soil moisture and meteorology arrays and three more stream gauges are planned to be installed in the watershed prior to the 2017-18 AR season for a total of six soil moisture and meteorology arrays and six stream gauges. The data from these sites will be used to better understand AR meteorological and hydrologic impacts in this region and improve streamflow forecasts on the Russian River.

The field team after completion of the Potter Valley North site: Lindsey Jasperse, Steve Turnbull, Will Chapman, Maryam Asgari-Lamjiri, Douglas Alden, Anna Wilson and Xin Zhang. Not pictured: Julie Kalansky and Brian Henn