R-Cat 2 Strength AR

Recent AR Reaches R-Cat 2 Strength

February 9, 2017

Sign up to receive an automated “R-Cat Extreme Precipitation Alert” email from CW3E showing he most extreme precipitation events over the previous 3 days (only on the rare days when there is extreme precipitation). The attached map shows the locations of 30 such reports from the storm that hit the West from 5-8 February 2017.

The maximum three-day precipitation during the most recent Atmospheric River event was 373.9 mm (14.72 inches) at a location called Four Trees on the western slopes of the Sierra Nevada Mountains, about 950 meters (3,100 feet) above sea level, in Plumas National Forest.

That made this an “R-Cat 2” precipitation event on CW3E’s scale. “R-Cat” stands for “Rainfall Category,” a simple scaling system invented by CW3E’s Marty Ralph and Mike Dettinger (see brief journal article here or here.

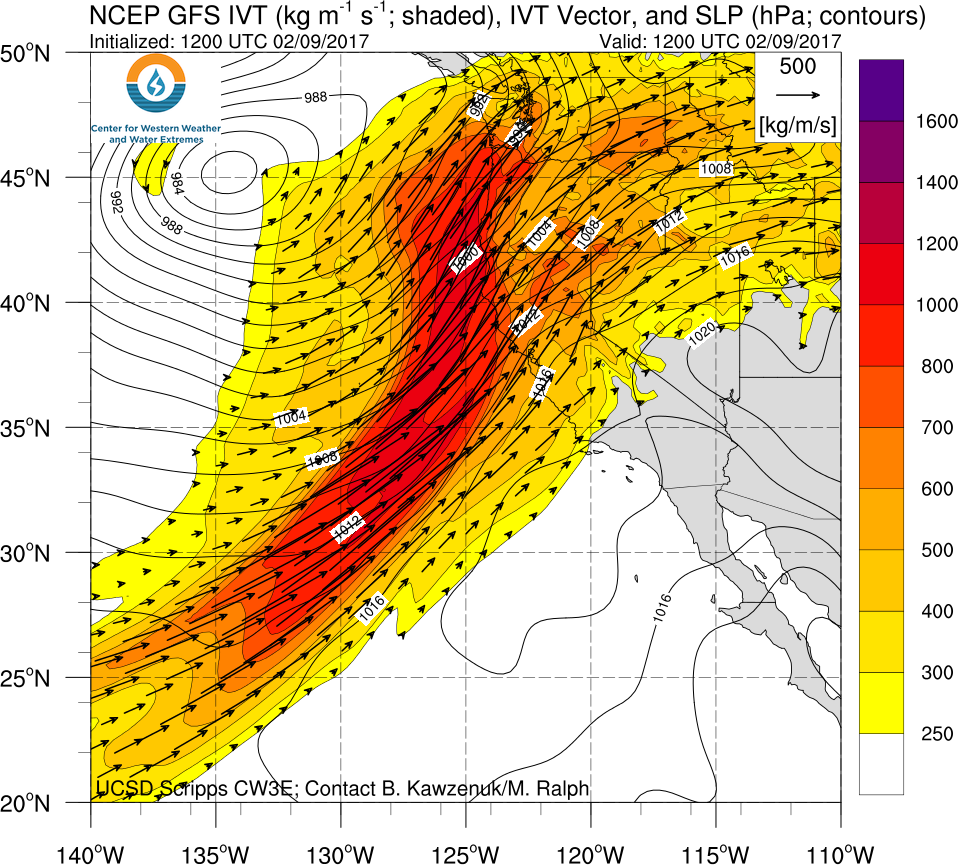
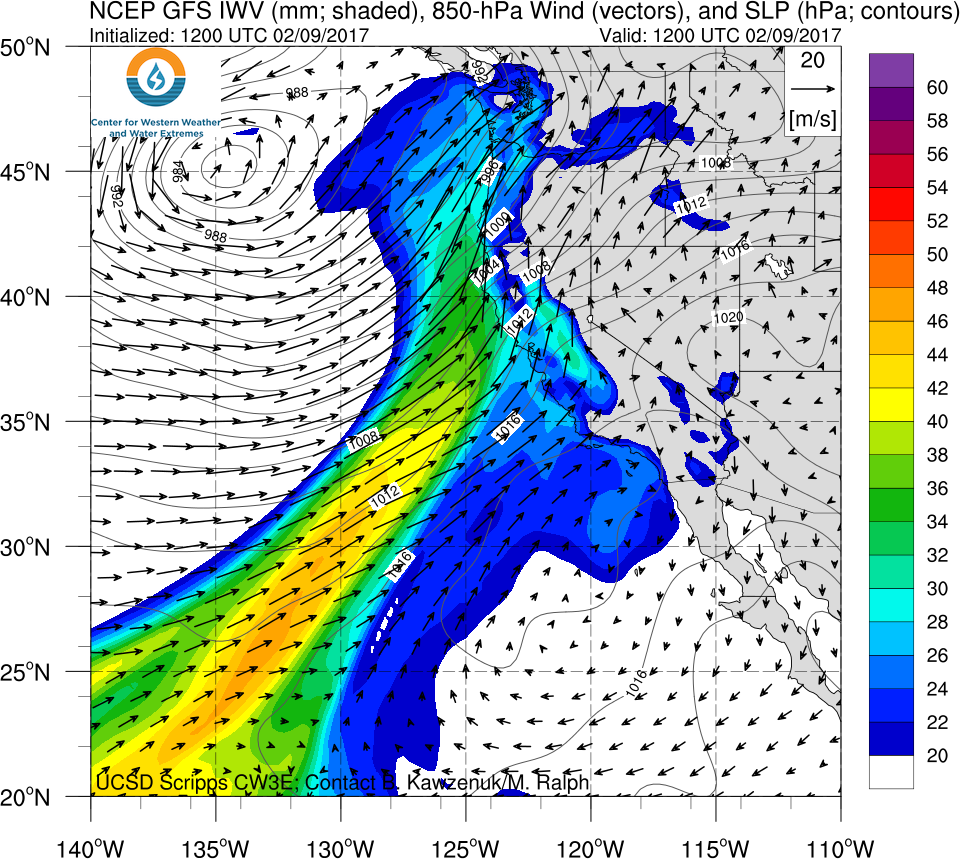
The landfall of a strong atmospheric river (AR) followed by a second AR in California over the last few days produced extreme precipitation over much of Central and Northern California. The second AR is currently over central and northern CA and is expected to produce more heavy precipitation over the next 24 hours (see CW3E AR Update: 9 Feb Outlook). This event was identified and reported in real-time by a new tool developed by David Pierce and Marty Ralph at CW3E that automatically monitors rain gauges across the Western U.S. and sends an email alert when extreme precipitation events occur to anyone signed up for the service. The service is free and is intended to provide information to interested individuals in a timely manner.

To subscribe to this automated CW3E R-Cat Extreme Precipitation Alert via email: just email a message with subject “subscribe” to rcatalert@cirrus.ucsd.edu.

The alerts use a simple new method to identify extreme events, which was published after analysis of decades of daily rainfall showed that 3-day precipitation totals were the most logical choice to characterize events that can have the broadest and largest impacts, especially in the Western U.S. The categorization method is based on 3-day observed precipitation totals (rain and/or the liquid equivalent of snow that fell), where “R-Cat” is short for “Rainfall Category:”

R-Cat 1: 200-299 mm (roughly 8-12 inches) / 3 days

R-Cat 2: 300-399 mm (roughly 12-16 inches) / 3 days

R-Cat 3: 400-499 mm (roughly 16-20 inches) / 3 days

R-Cat 4: more than 500 mm (more than roughly 20 inches) / 3 days

Historically these R-Cat events have occurred nationally with the following average annual frequencies (based on a network of several thousand rain gages that each had to have at least 30 years of daily observations; note that the R-Cat Alert tool does not require sites to have had 30 years of data, so more sites are likely to be found meeting the R-Cat criteria than in the earlier detailed analysis):

R-Cat 1: 48 episodes involving a total of 173 rain gauge sites that exceed the R-CAT1 threshold per year

R-Cat 2: 9 episodes involving 23 rain gauge sites that exceeded the R-CAT2 threshold

R-Cat 3: 2 episodes involving 4 rain gauge sites that exceeded the R-CAT3 threshold

R-Cat 4: 1 episode Involving 2 rain gauge sites that exceeded the R-CAT4 threshold

For comparison, the number of R-Cat 3 or 4 events annually roughly matches the average number of major hurricanes that occur annually in the Atlantic (Cat 3, 4, 5 combined) and the number of the most extreme tornadoes that occur (EF-4 and 5 combined).

Notably, in light of the events of last weekend, it is useful to note that, in the Western US between 1948 and 2010, 44 of the 48 occasions when RCAT3 or RCAT4 conditions were reached coincided with the arrival of an atmospheric-river storm.

Odds of Reaching 100% Water Year Precipitation – Feb Update

Odds of Reaching 100% of Normal Precipitation for Water Year 2017 (February Update)

February 9, 2017

Contribution from Dr. M.D. Dettinger, USGS

The odds shown here are the odds of precipitation in the rest of the water year (after January 2017) totaling a large enough amount to bring the water-year total to equal or exceed the percentage of normal listed. “All Yrs” odds based on monthly divisional precipitation totals from water year 1896-2015. Numbers in parenthesis are the corresponding odds if precipitation through January had been precisely normal (1981-2010 baseline).

Click here for a pdf file of this information.


How these probabilities were estimated:

At the end of a given month, if we know how much precipitation has fallen to date (in the water year), the amount of precipitation that will be required to close out the water year (on Sept 30) with a water-year total equal to the long-term normal is just that normal amount minus the amount received to date. Thus the odds of reaching normal by the end of the water year are just the odds of precipitation during the remaining of the year equaling or exceeding that remaining amount.

To arrive at the probabilities shown, the precipitation totals for the remaining months of the water year were tabulated in the long-term historical record and the number of years in which that precipitation total equaled or exceeded the amount still needed to reach normal were counted. The fraction of years that at least reached that threshold is the probability estimate. This simple calculation was performed for a full range of possible starting months (from November thru September) and for a wide range of initial (year-to-date) precipitation conditions. The calculation was also made for the probabilities of reaching 75% of normal by end of water year, 125%, and 150%, to ensure that the resulting tables of probabilities cover almost the full range of situations that will come up in the future.

[One key simplifying assumption goes into estimating the probabilities this way: The assumption that the amount of precipitation that will fall in the remainder of a water year does not depend on the amount that has already fallen in that water year to date. This assumption was tested for each month of the year by correlating historical year-to-date amounts with the remainder-of-the-year amounts, and the resulting correlations were never statistically significantly different from zero, except possibly when the beginning month is March, for which there is a small positive correlation between Oct-Mar and Apr-Sept precipitation historically.]

Contact: Michael Dettinger (USGS)

CW3E AR Update: 8 February 2017 Outlook

CW3E AR Update: 8 February 2017 Outlook

February 8, 2017

Click here for a pdf of this information.

Update on AR Currently Impacting CA, OR, and WA

  • Precipitation continues to fall over portions of Northern California, Washington, and Oregon
  • 6–10 inches of precipitation has fallen over some locations over the last 72-hrs
  • AR conditions continue to persist over Northern CA, OR, and WA as the second AR made landfall this morning
  • Another 5–8 inches are forecast for the higher elevations of Northern CA, OR, and WA as flooding remains a concern


Click IVT or IWV image to see loop of 0-128 hour GFS forecast

Valid 1200 UTC 8 Feb – 0000 UTC 12 Feb 2017

The southwesterly oriented AR is forecast to bring IVT magnitudes as high as 1000 kg m–1 s–1 and IWV values as high as 28 mm to the West


Summary provided by C. Hecht and F.M. Ralph; 5 PM PT Wed 08 Feb. 2017

CW3E AR Update: 7 February 2017 Outlook

CW3E AR Update: 7 February 2017 Outlook

February 7, 2017

Click here for a pdf of this information.

Two ARs to Impact the West CoastUpdate on ARs Currently Impacting and Forecast to Impact West Coast

  • As much as 6.5 inches of precipitation has fallen over the high elevations of CA over the previous 48 hours
  • Several rivers and streams are currently experiencing flooding in the San Francisco Bay Area
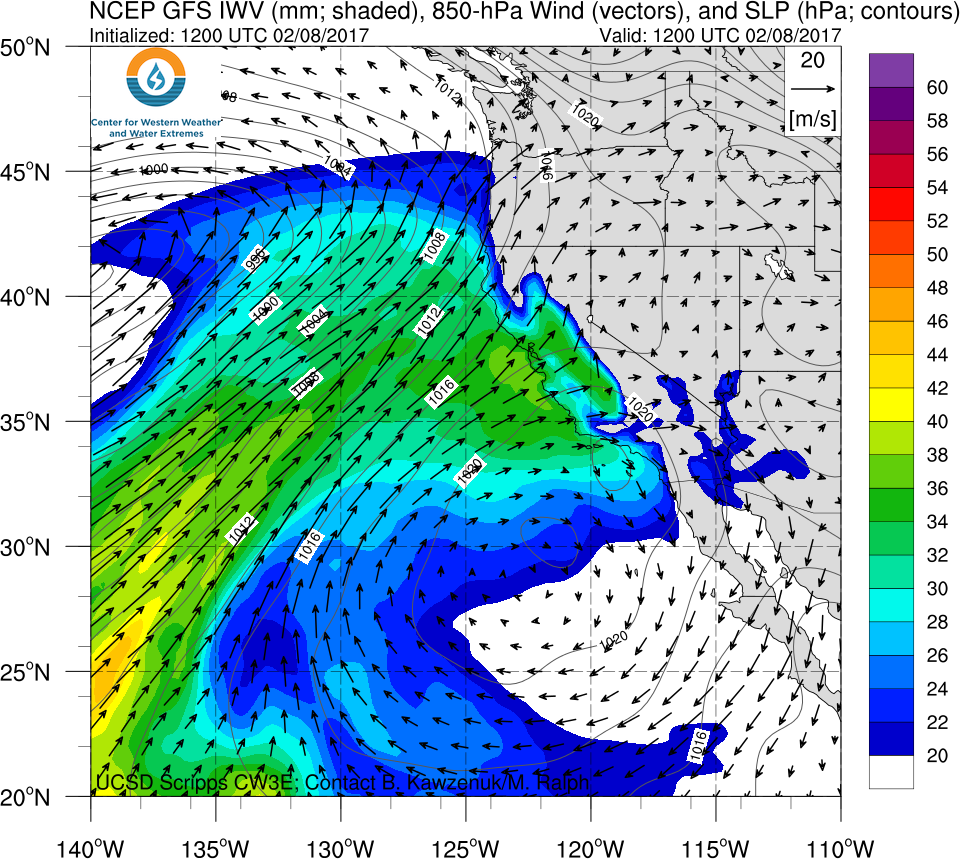
  • The second AR is forecast to make landfall at ~4 AM on Wednesday 8 February
  • An additional 5–10 inches of precipitation could fall over already wet soils, raising concern for additional flooding


Click IVT or IWV image to see loop of 0-127 hour GFS forecast

Valid 1200 UTC 7 Feb – 1800 UTC 11 Feb 2017

The next AR is currently forecast to make landfall at ~4 AM on 8 February 2017 with maximum IVT ~1000 and IWV ~34 mm


Summary provided by C. Hecht and F.M. Ralph; 2 PM PT Mon 07 Feb. 2017

CW3E AR Update: 6 February 2017 Outlook

CW3E AR Update: 6 February 2017 Outlook

February 6, 2017

Click here for a pdf of this information.

Two ARs to Impact the West Coast

  • Two moderate to strong ARs are forecasted to make landfall in Northern CA and the Pacific Northwest
  • Due to the timing of both ARs, AR conditions could last over 90 hours in some locations
  • Weather Prediction Center forecast shows 1-5 Day precipitation amounts up to 17.5 inches over higher elevations in Sierras
  • 15 river gauges are currently forecast to rise above flood stage by the California Nevada River Forecast Center

Click IVT or IWV image to see loop of 0-126 hour GFS forecast

Valid 1200 UTC 6 Feb – 1800 UTC 11 Feb 2017


Summary provided by C. Hecht and F.M. Ralph; 3 PM PT Mon 06 Feb. 2017

CW3E AR Update: 1 February 2017 Outlook

CW3E AR Update: 1 February 2017 Outlook

February 1, 2017

Click here for a pdf of this information.

Precipitation forecast for Northern CA Pacific Northwest

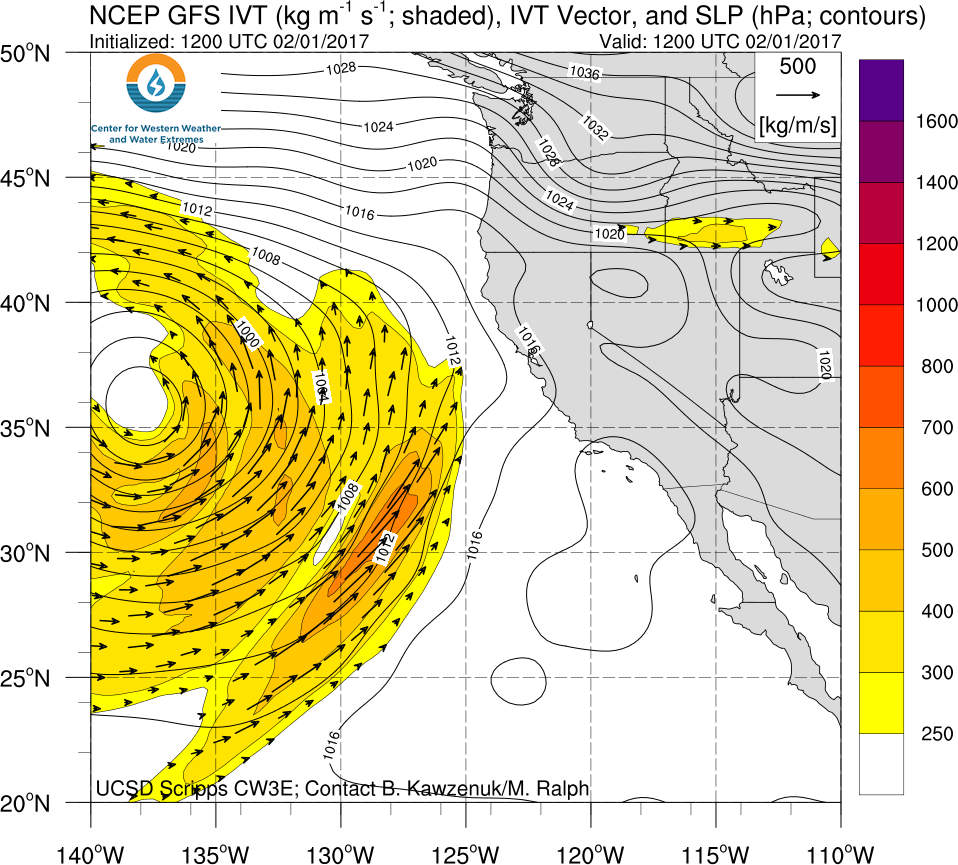
  • A low pressure system is forecast to propagate toward Northern CA and Oregon
  • Up to 6 inches of precipitation are forecast to fall over higher elevations, while low elevations of N. CA could see as much as 2.5 inches
  • This event is not representative of an AR structure (long and narrow plumes IVT and IWV), though the IVT and IWV thresholds associated with an AR will be met at certain locations
  • Extended forecasts indicate the potential for an AR to make landfall in the next 5–7 days

Click IVT or IWV image to see loop of 0-126 hour GFS forecast

Valid 1200 UTC 6 Feb – 1800 UTC 11 Feb 2017


Summary provided by C. Hecht and F.M. Ralph; 12 PM PT Wed 01 Feb. 2017

CW3E AR Update: 19 January 2017 Outlook

CW3E AR Update: 19 January 2017 Outlook

January 19, 2017

Click here for a pdf of this information.

Update on 3 ARs Forecast to Impact the West Coast Over Next Several Days

  • AR 1 made landfall over the Pacific Northwest and propagated southward impacting the entire U.S. West Coast
  • 1–6 inches of precipitation have fallen over the last 48-h over portions of California
  • AR 2 and 3 are forecast to make landfall over Southern and Central CA, respectively, over the next 5 days
  • Forecast certainty is high for AR2 but still low for AR 3
  • NOAA Weather Prediction Center precipitation forecasts for the next 5 days in Southern CA are as high as 10 inches over the high elevations and 1–5 inches in the valleys


Summary provided by C. Hecht, and F.M. Ralph; 3 PM PT Thurs. 19 Jan. 2017

CW3E AR Update: 17 January 2017 Outlook

CW3E AR Update: 17 January 2017 Outlook

January 17, 2017

Click here for a pdf of this information.

Multiple ARs Forecast to Make Landfall Over Next Week

  • Three ARs are currently forecast to make landfall over the U.S. West Coast at different times over the next 5 days
  • The first AR is forecast to make landfall over the Pacific Northwest today and is associated with strong AR conditions (IVT 750–1000 kg/m/s)
  • The second AR is forecast to make landfall over Southern CA from 20 – 22 Jan and is associated with strong AR conditions (IVT 750–1000 kg/m/s)
  • The third AR is forecast to make landfall over Central CA and could potentially be associated with strong AR conditions (IVT 750–1000 kg/m/s)
  • Forecast uncertainty is currently high with both AR 2 and 3
  • Weather Prediction Center precipitation forecasts currently range from 3–9 inches with AR 1, 2–4 inches with AR 2, and 2–5 inches with AR 3


Summary provided by C. Hecht, and F.M. Ralph; 3 PM PT Mon 17 Jan. 2017

CW3E AR Update: 11 January 2017 Outlook

CW3E AR Update: 11 January 2017 Outlook

January 11, 2017

Click here for a pdf of this information.


A look back at how the forecasts changed ahead of and during the active AR landfall period from 8-11 January (dProg/dT) and for next possible AR landfall next week

Forecasts initialized 0600 UTC 4 Jan – 0600 UTC 11 Jan


Summary provided by B. Kawzenuk, C. Hecht, and F.M. Ralph; 3 PM PT Wed 11 Jan. 2017