CW3E in the News

CW3E in the News

January 10, 2017

Due to several recent landfalling Atmospheric Rivers (ARs), the media has been contacting CW3E for their expert commentary. We share some recent examples below.

Director of CW3E, Marty Ralph, recently joined Here & Now’s Meghna Chakrabarti on National Public Radio to discuss ARs and their impact on California’s water supply. He described how ARs form and generate precipitation and how their annual variability largely impact the annual precipitation in California. The interview can be heard here.

Dr. Ralph also discussed the importance of ARs with Alex Cohen on Take Two, this interview can he heard here

Given the importance of water supply to California, Forecast Informed Reservoir Operations (FIRO) has also gained media attention. The most recent volume of the Flood Risk Management Newsletter highlights the potential of FIRO to improve resiliency to droughts and floods by improving water supply and decreasing flood risk. The newsletter can be found here.

The impacts of the most recent AR caused widespread damages and hazardous conditions from the extreme precipitation (see CW3E AR Update: 9 January 2017 Outlook and Summary). Prior to the event as forecast confidence grew several CW3E forecast tools were featured in various news outlets. One example can be seen here, as the Capital Weather Gang highlighted the Time Integrated Water Vapor Transport maps produced by CW3E. After the event Marty Ralph describes the large variability in California’s annual precipitation and the importance of flood management strategies. Article found here.

Click here for more CW3E news.

Where was the most extreme precipitation yesterday in the West?

Where was the most extreme precipitation yesterday in the West?

January 10, 2017

Sign up to receive an automated “R-Cat Extreme Precipitation Alert” email from CW3E showing the most extreme precipitation events over the previous 3 days (only on the rare days when there is extreme precipitation). The attached map shows the locations of 52 such reports from the storm that hit the West from 7-10 January 2017.

The maximum three-day precipitation during the weekend event was 521 mm (20.51 inches) at a location called Strawberry Valley on the western slopes of the Sierra Nevada Mountains, about 1,161 meters (3,807 feet) above sea level, near Interstate 80.

That made this an “R-Cat 4” extreme precipitation event on the CW3E’s scale. This is the top magnitude possible and is very rare. “R-Cat” stands for “Rainfall Category,” a simple scaling system invented by CW3E’s Marty Ralph and Mike Dettinger (see brief journal article here or here).

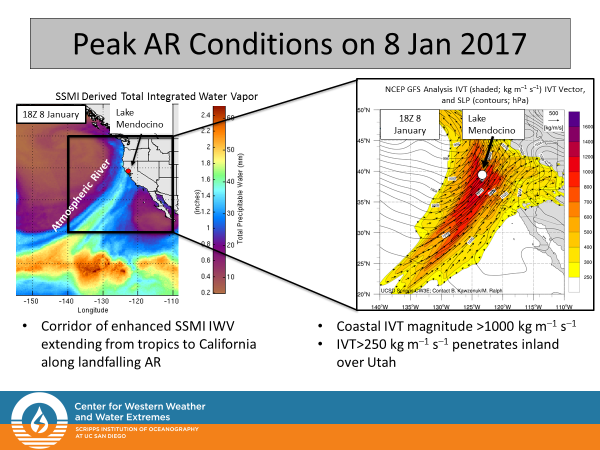
The landfall of a very strong long-duration atmospheric river (AR) (see second figure) followed by a second AR in California over the last few days produced extreme precipitation over much of Central and Northern California. This event was identified and reported in real-time by a new tool developed by David Pierce and Marty Ralph at CW3E that automatically monitors rain gauges across the Western U.S. and sends an email alert when extreme precipitation events occur to anyone signed up for the service. The service is free and is intended to provide information to interested individuals in a timely manner.

To subscribe to this automated CW3E R-Cat Extreme Precipitation Alert via email: just email a message with subject “subscribe” to rcatalert@cirrus.ucsd.edu.
The alerts use a simple new method to identify extreme events, which was published after analysis of decades of daily rainfall showed that 3-day precipitation totals were the most logical choice to characterize events that can have the broadest and largest impacts, especially in the Western U.S. The categorization method is based on 3-day observed precipitation totals (rain and/or the liquid equivalent of snow that fell), where “R-Cat” is short for “Rainfall Category:”

R-Cat 1: 200-299 mm (roughly 8-12 inches) / 3 days

R-Cat 2: 300-399 mm (roughly 12-16 inches) / 3 days

R-Cat 3: 400-499 mm (roughly 16-20 inches) / 3 days

R-Cat 4: more than 500 mm (more than roughly 20 inches) / 3 days

Historically these R-Cat events have occurred nationally with the following average annual frequencies (based on a network of several thousand rain gages that each had to have at least 30 years of daily observations; note that the R-Cat Alert tool does not require sites to have had 30 years of data, so more sites are likely to be found meeting the R-Cat criteria than in the earlier detailed analysis):

R-Cat 1: 48 episodes involving a total of 173 rain gauge sites that exceed the R-CAT1 threshold per year

R-Cat 2: 9 episodes involving 23 rain gauge sites that exceeded the R-CAT2 threshold

R-Cat 3: 2 episodes involving 4 rain gauge sites that exceeded the R-CAT3 threshold

R-Cat 4: 1 episode Involving 2 rain gauge sites that exceeded the R-CAT4 threshold

For comparison, the number of R-Cat 3 or 4 events annually roughly matches the average number of major hurricanes that occur annually in the Atlantic (Cat 3, 4, 5 combined) and the number of the most extreme tornadoes that occur (EF-4 and 5 combined).

Notably, in light of the events of last weekend, it is useful to note that, in the Western US between 1948 and 2010, 44 of the 48 occasions when RCAT3 or RCAT4 conditions were reached coincided with the arrival of an atmospheric-river storm.

CW3E AR Update: 9 January 2017 Outlook and Summary

CW3E AR Update: 9 January 2017 Outlook

January 9, 2017

Click here for a pdf of this information.


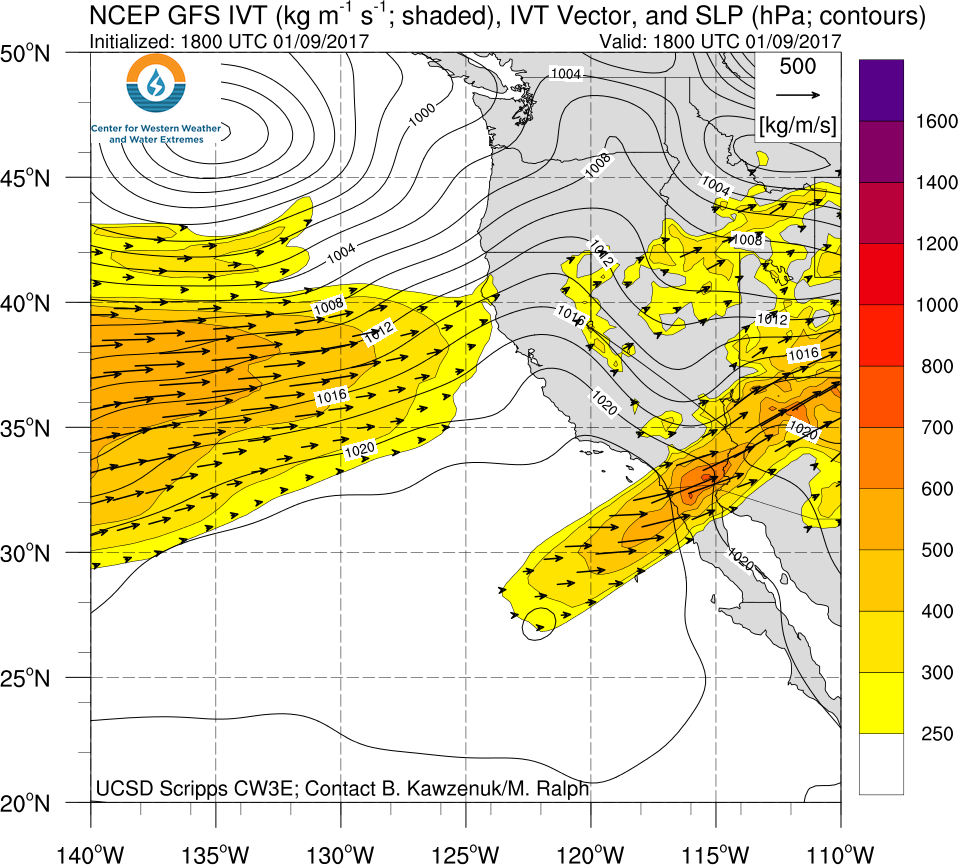
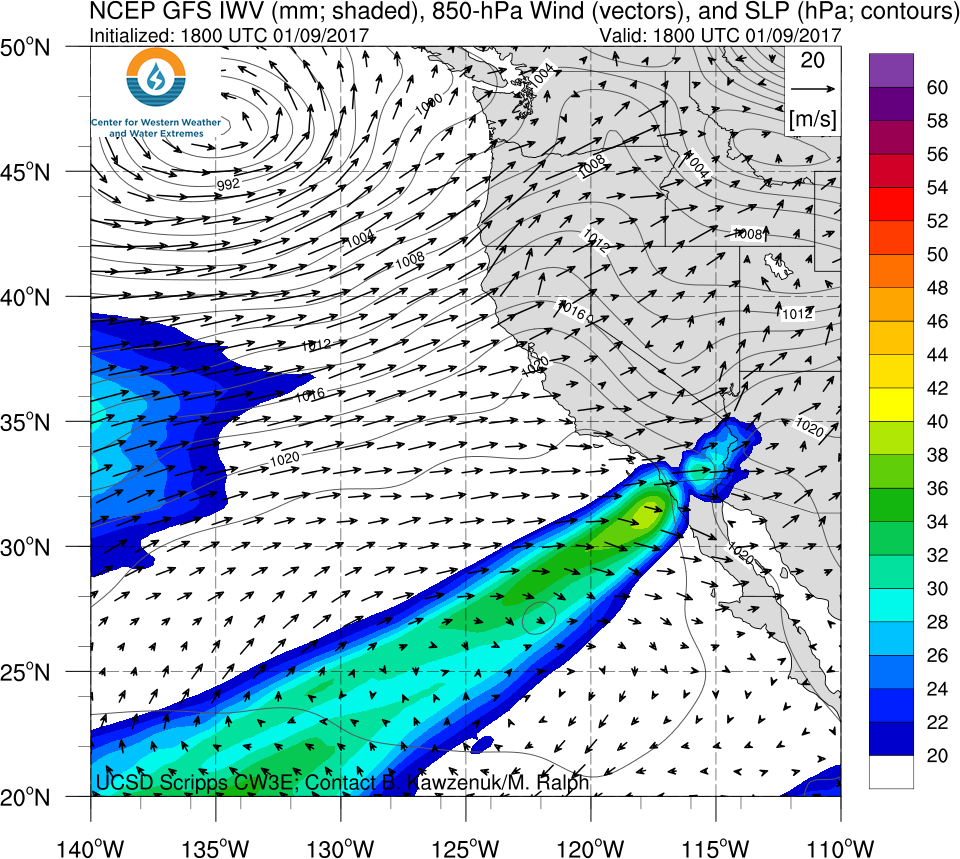
Strong AR forecast to impact California this weekend

  • Another AR is forecast to make landfall over Central California tonight and last until Wednesday evening
  • As much as 10 more inches of rain could fall over already saturated soil
  • Lower freezing levels may cause most of the higher elevations to receive snow instead of rain
  • Several river gauges are forecast to rise back above flood stage with little time to recover back to normal after this past weekends AR

Click IVT or IWV image to see loop of 0-72 hour GFS forecast

Valid 1800 UTC 9 Jan – 1800 UTC 12 Jan 2017


Summary provided by C. Hecht, B. Kawzenuk, and F.M. Ralph; 3 PM PT Mon 9 Jan. 2017

Odds of Reaching 100% Water Year Precipitation – Jan Update

Odds of Reaching 100% of Normal Precipitation for Water Year 2017 (January Update)

January 9, 2017

Contribution from Dr. M.D. Dettinger, USGS

The odds shown here are the odds of precipitation in the rest of the water year (after December 2016) totaling a large enough amount to bring the water-year total to equal or exceed the percentage of normal listed. “All Yrs” odds based on monthly divisional precipitation totals from water year 1896-2015. Numbers in parenthesis are the corresponding odds if precipitation through October had been precisely normal (1981-2010 baseline).

Click here for a pdf file of this information.


How these probabilities were estimated:

At the end of a given month, if we know how much precipitation has fallen to date (in the water year), the amount of precipitation that will be required to close out the water year (on Sept 30) with a water-year total equal to the long-term normal is just that normal amount minus the amount received to date. Thus the odds of reaching normal by the end of the water year are just the odds of precipitation during the remaining of the year equaling or exceeding that remaining amount.

To arrive at the probabilities shown, the precipitation totals for the remaining months of the water year were tabulated in the long-term historical record and the number of years in which that precipitation total equaled or exceeded the amount still needed to reach normal were counted. The fraction of years that at least reached that threshold is the probability estimate. This simple calculation was performed for a full range of possible starting months (from November thru September) and for a wide range of initial (year-to-date) precipitation conditions. The calculation was also made for the probabilities of reaching 75% of normal by end of water year, 125%, and 150%, to ensure that the resulting tables of probabilities cover almost the full range of situations that will come up in the future.

[One key simplifying assumption goes into estimating the probabilities this way: The assumption that the amount of precipitation that will fall in the remainder of a water year does not depend on the amount that has already fallen in that water year to date. This assumption was tested for each month of the year by correlating historical year-to-date amounts with the remainder-of-the-year amounts, and the resulting correlations were never statistically significantly different from zero, except possibly when the beginning month is March, for which there is a small positive correlation between Oct-Mar and Apr-Sept precipitation historically.]

Contact: Michael Dettinger (USGS)

CW3E AR Update: 6 January 2017 Outlook

CW3E AR Update: 6 January 2017 Outlook

January 6, 2017

Click here for a pdf of this information.
 

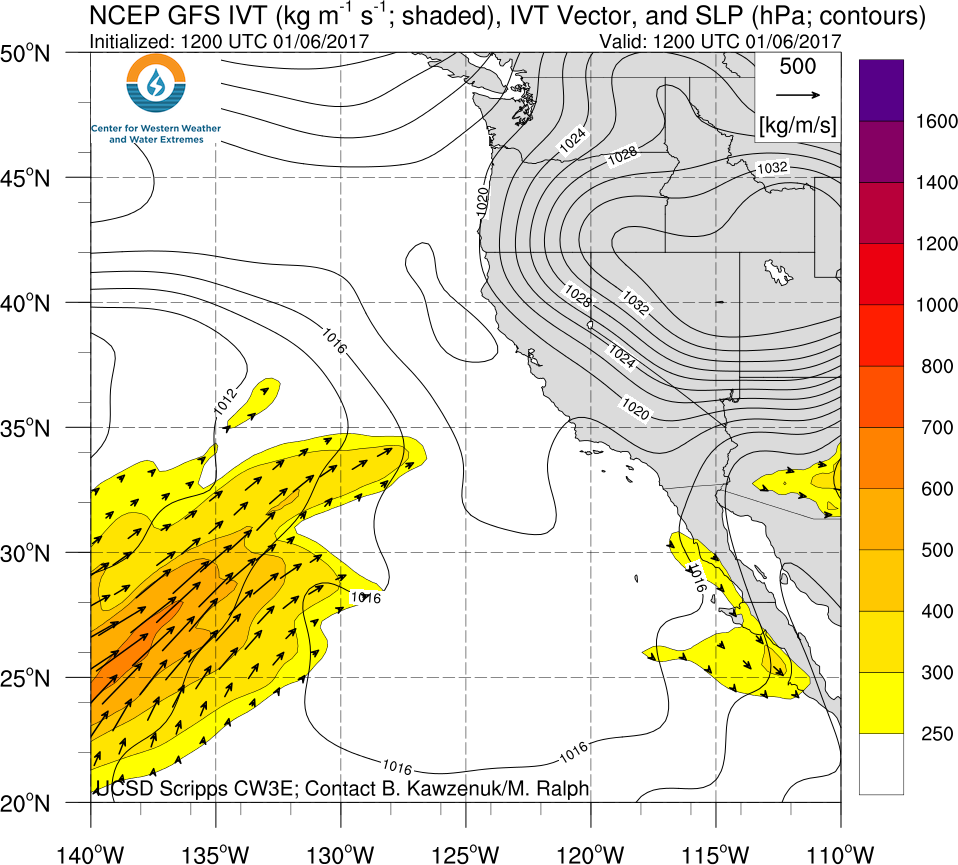
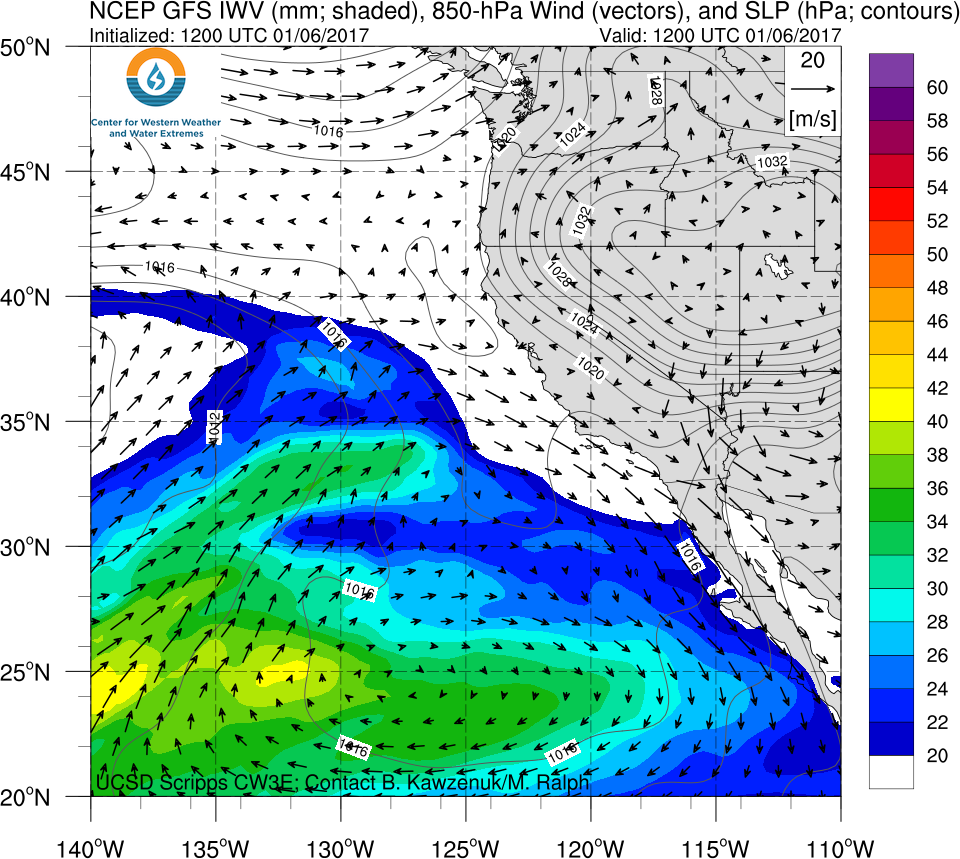
Update on Strong AR over the weekend

  • Forecast confidence of AR conditions have improved since yesterday’s update
  • Moderate AR conditions could last over 24-hrs over some locations in Central CA
  • 1–3 Day Precipitation forecasts by the Weather Predication Center are as high as 15.5 inches over high elevations of Sierras
  • 19 river gauges are currently forecast to rise above flood stage by the California Nevada River Forecast Center
  • Extended forecasts show another AR making landfall next week, though the forecasts are more uncertain

Click IVT or IWV image to see loop of 0-132 hour GFS forecast

Valid 1200 UTC 6 Jan – 0000 UTC 12 Jan 2017


Summary provided by C. Hecht, B. Kawzenuk, and F.M. Ralph; 5 PM PT Fri 6 Jan. 2017

Products presented in this outlook are meant for informational purposes and are not intended to support decision making operations

CW3E Welcomes Dr. Minghua Zheng

CW3E welcomes Dr. Minghua Zheng

January 16 2017

Dr. Minghua Zheng started at CW3E in January 2017 as a Postdoctoral Scholar. Minghua received her Ph.D. in Atmospheric Sciences from the State University of New York at Stony Brook under the advisement of Dr. Edmund Chang. Her dissertation focused on understanding the growth of forecast errors and uncertainties in ensemble forecasting of U.S. East Coast winter storms. Specifically, her research used ensemble sensitivity analysis, a data mining method, the Ensemble Transform Kalman Filter (ETKF), and other statistical tools to investigate the predictability of winter storms and to improve forecast skill. In addition, she investigated the role of large-scale processes, such as Rossby wave packet behavior, on the predictability of winter storms. In her new position, she will work on real-time data assimilation in CW3E’s “West-WRF” model using the Data Assimilation Research Testbed (DART) and four-dimensional variational (4DVAR) system. The assimilation will be used to estimate the model biases, improve initial conditions, and identify the sources of forecast errors and uncertainties associated with Atmospheric River events.

CW3E AR Update: 5-10 January 2017 Outlook

CW3E AR Update: 5-10 January 2017 Outlook

January 5, 2017

Click here for a pdf of this information.

Strong AR forecast to impact California this weekend

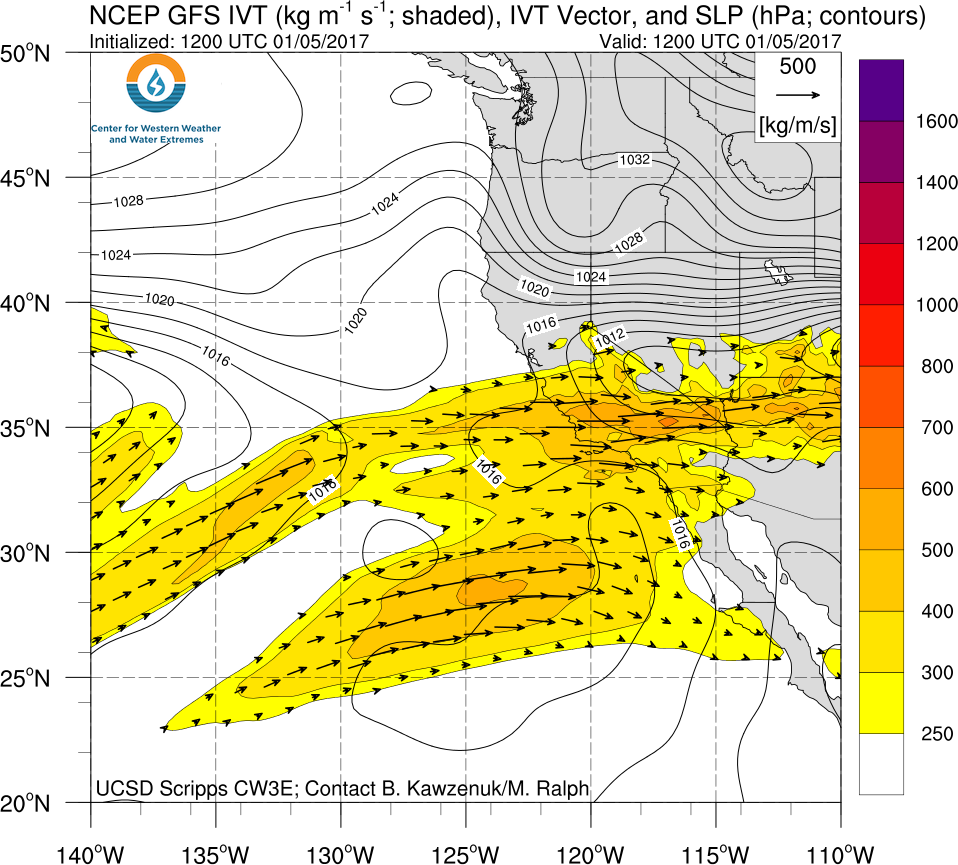
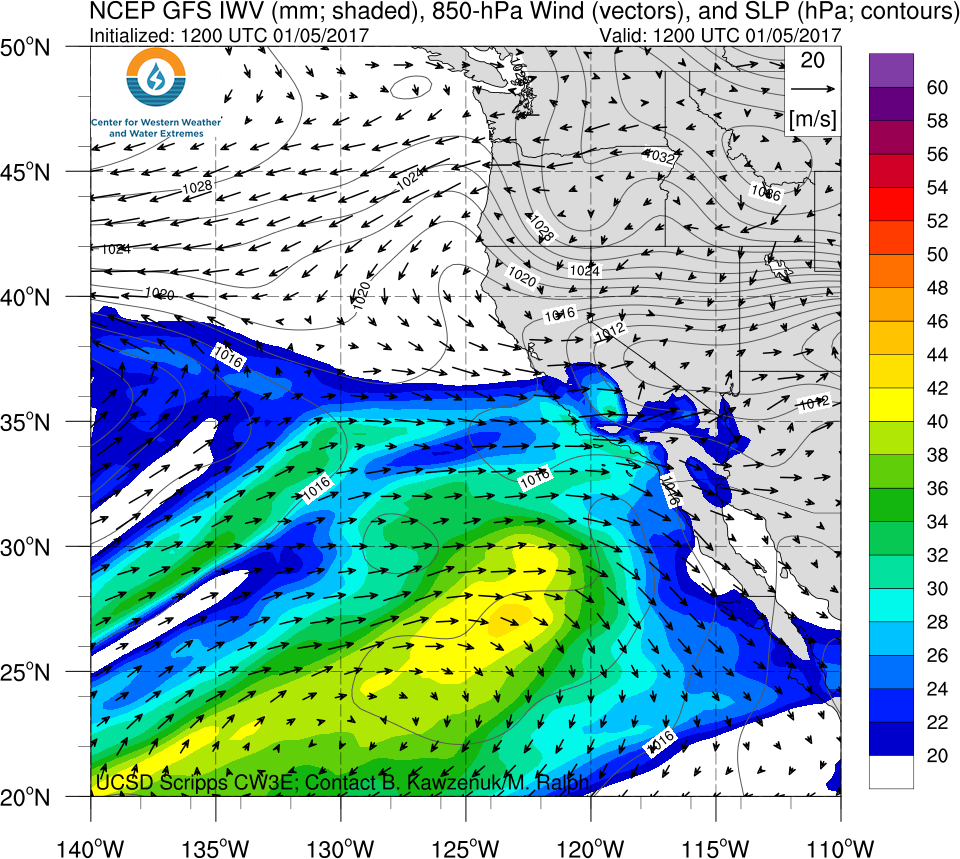
  • Forecasts continue to suggest the landfall of a strong AR over the weekend
  • Updated forecasts indicate that AR duration may decrease, which suggests lower precipitation amounts in some locations
  • Several more river gauges are expected to rise above flood stage
  • Extended forecasts predict another AR early next week potentially bringing more precipitation

Click IVT or IWV image to see loop of 0-144 hour GFS forecast

Valid 1200 UTC 5 Jan – 1200 UTC 11 Jan 2017


Summary provided by C. Hecht, B. Kawzenuk, and F.M. Ralph; 3 PM PT Wed 5 Jan. 2017

CW3E AR Update: 4-10 January 2017 Outlook

CW3E AR Update: 4-10 January 2017 Outlook

January 4, 2017

Click here for a pdf of this information.
 

Strong AR forecast to impact California this weekend

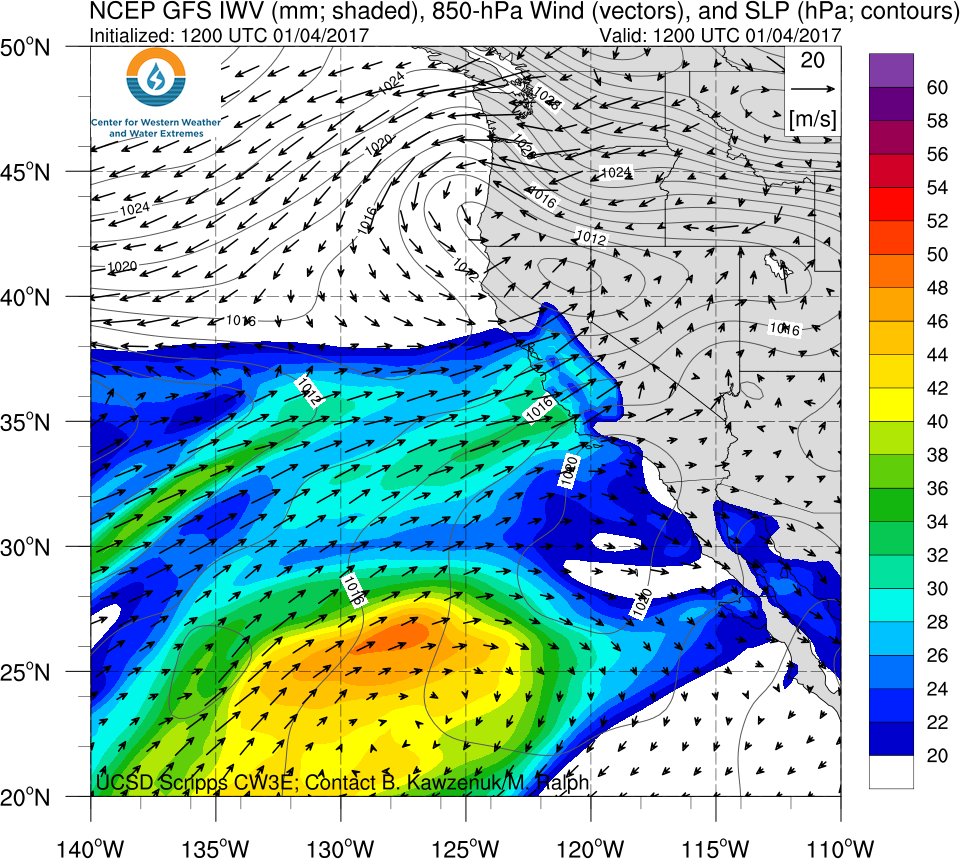
  • A strong AR with IVT as high as 1000 kg m-1 s-1 is forecast make landfall over the West Coast this Weekend
  • Precipitation from an AR currently impacting CA combined with the precipitation from AR this weekend are producing 7-day precipitation forecasts as high as 20 inches in the higher elevations of the Sierra Nevada Mts.
  • The hydrologic impacts associated with an event of this magnitude could be numerous and several rivers are already forecast to rise above flood stage in portions of northern/central California and western Nevada

Click IVT or IWV image to see loop of 0-138 hour GFS forecast

Valid 1200 UTC 4 Jan – 0600 UTC 10 Jan 2017


Summary provided by C. Hecht, B. Kawzenuk, and F.M. Ralph; 3 PM PT Wed 4 Jan. 2017

CW3E AR Update: 23-25 December 2016 Outlook

CW3E AR Update: 23-25 December 2016 Outlook

December 22, 2016

Click here for a pdf of this information.

  • Precipitation accumulations of 1–2 inches from a separate system have primed conditions in southern CA and may combine with precipitation from the expected event to cause the San Diego River to briefly rise above monitor stage
  • Freezing levels are forecast to be 4,000–5,000 over southern CA, which could lead to freezing precipitation over higher elevations

System to Bring Precipitation to CA

  • A system is expected to bring precipitation accumulations of 1–3 inches to most of California
  • While this event is forecast to have characteristics of an AR (IVT >250 kg/m/s), it does not have the spatial structure of an AR (long and narrow)

Click IVT or IWV image to see loop of 0-60 hour GFS forecast (Valid 1200 UTC 22 Dec – 0000 UTC 25 Dec)


Summary provided by C. Hecht, B. Kawzenuk, and F.M. Ralph; 1 PM PT Thurs 22 Dec. 2016