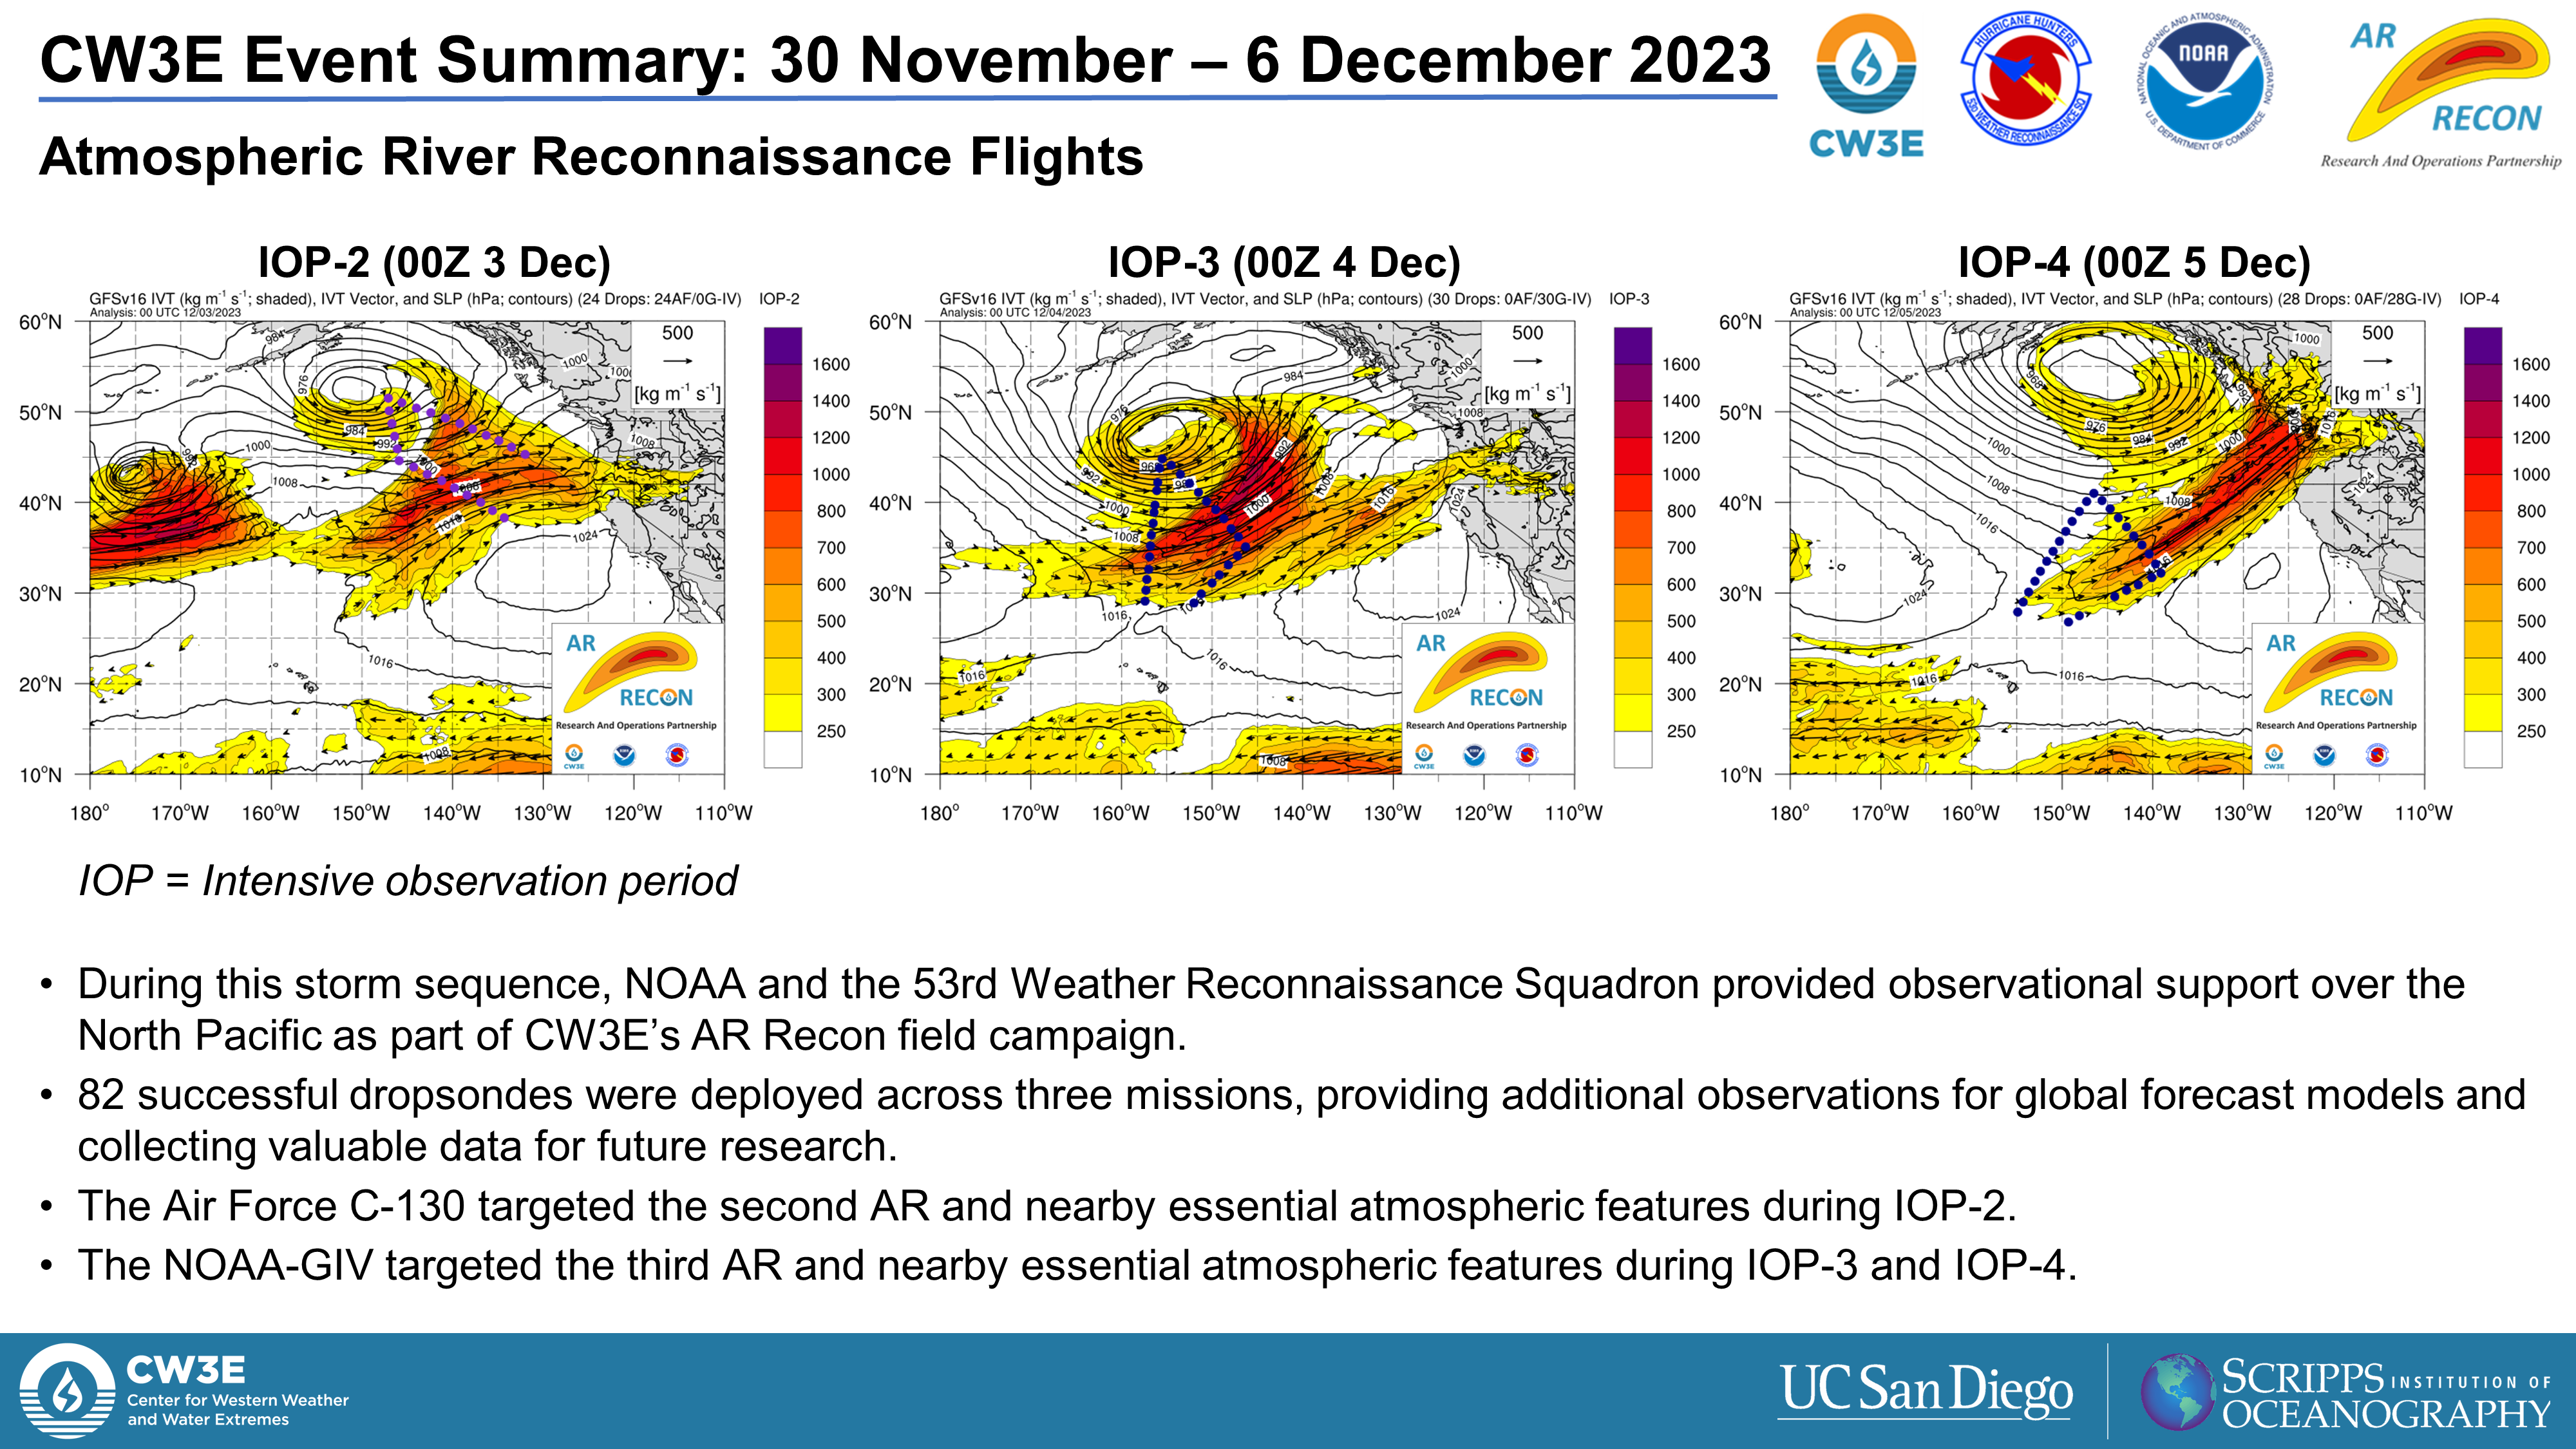
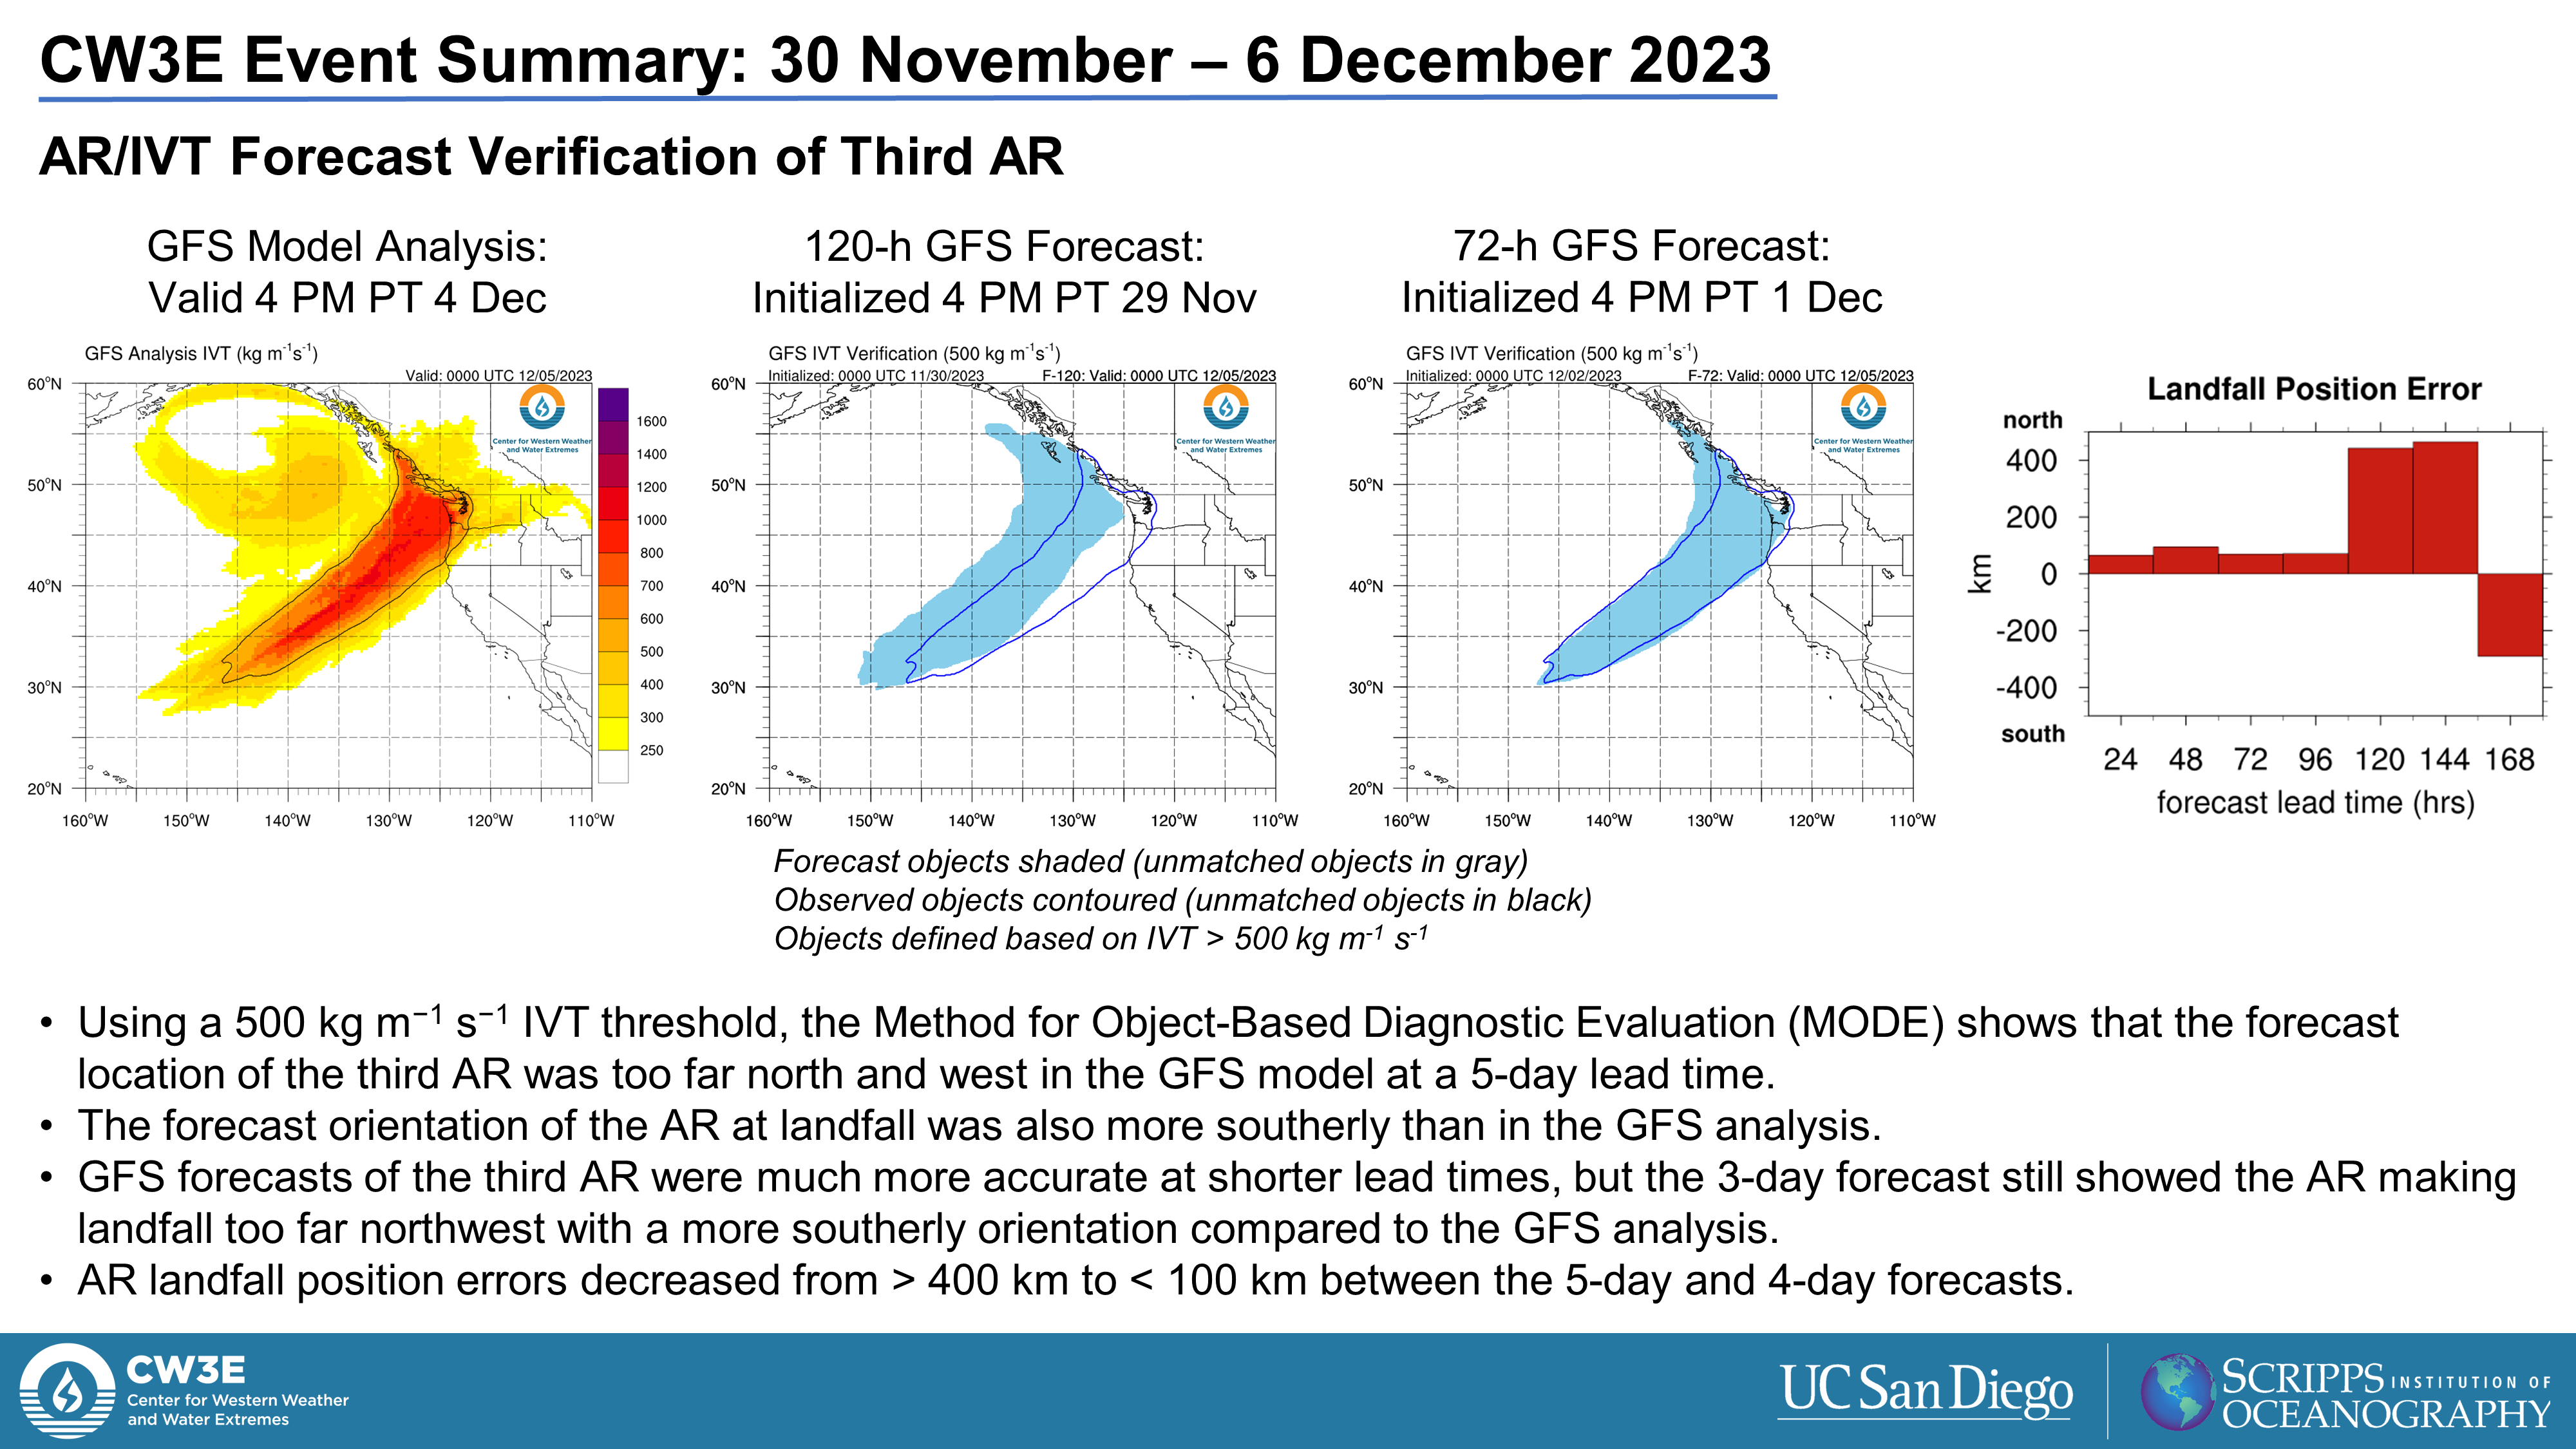
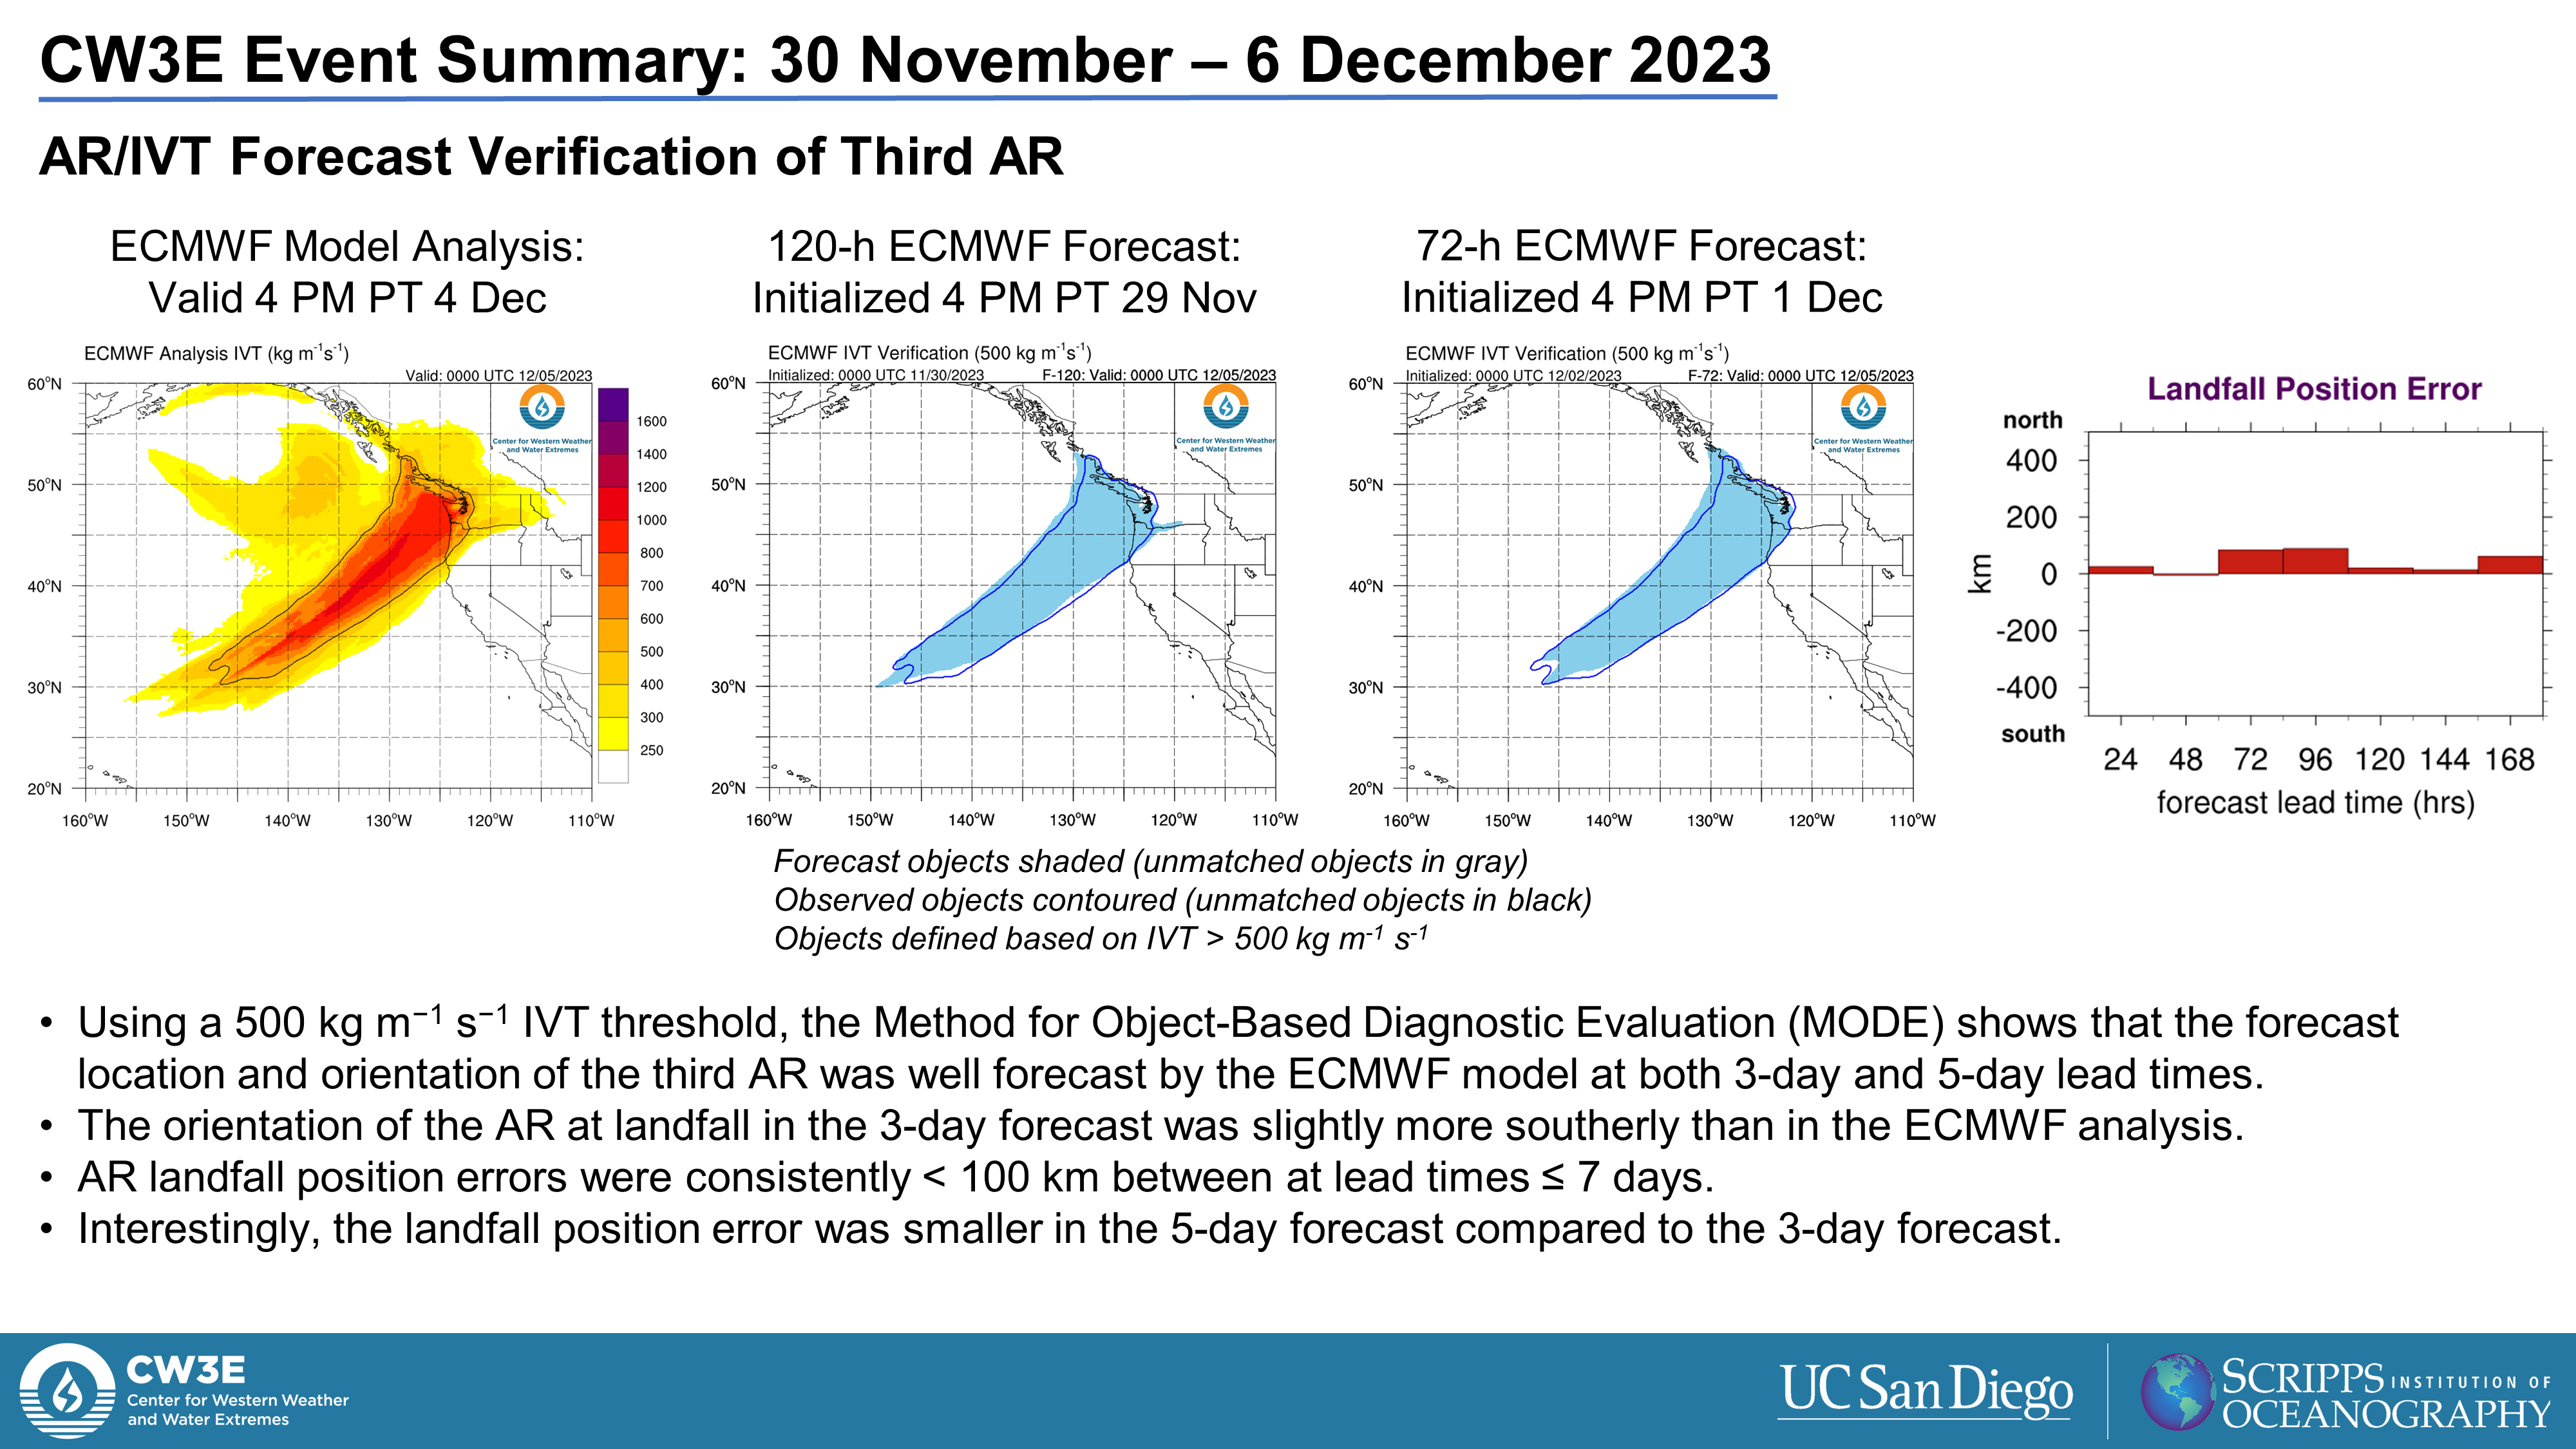
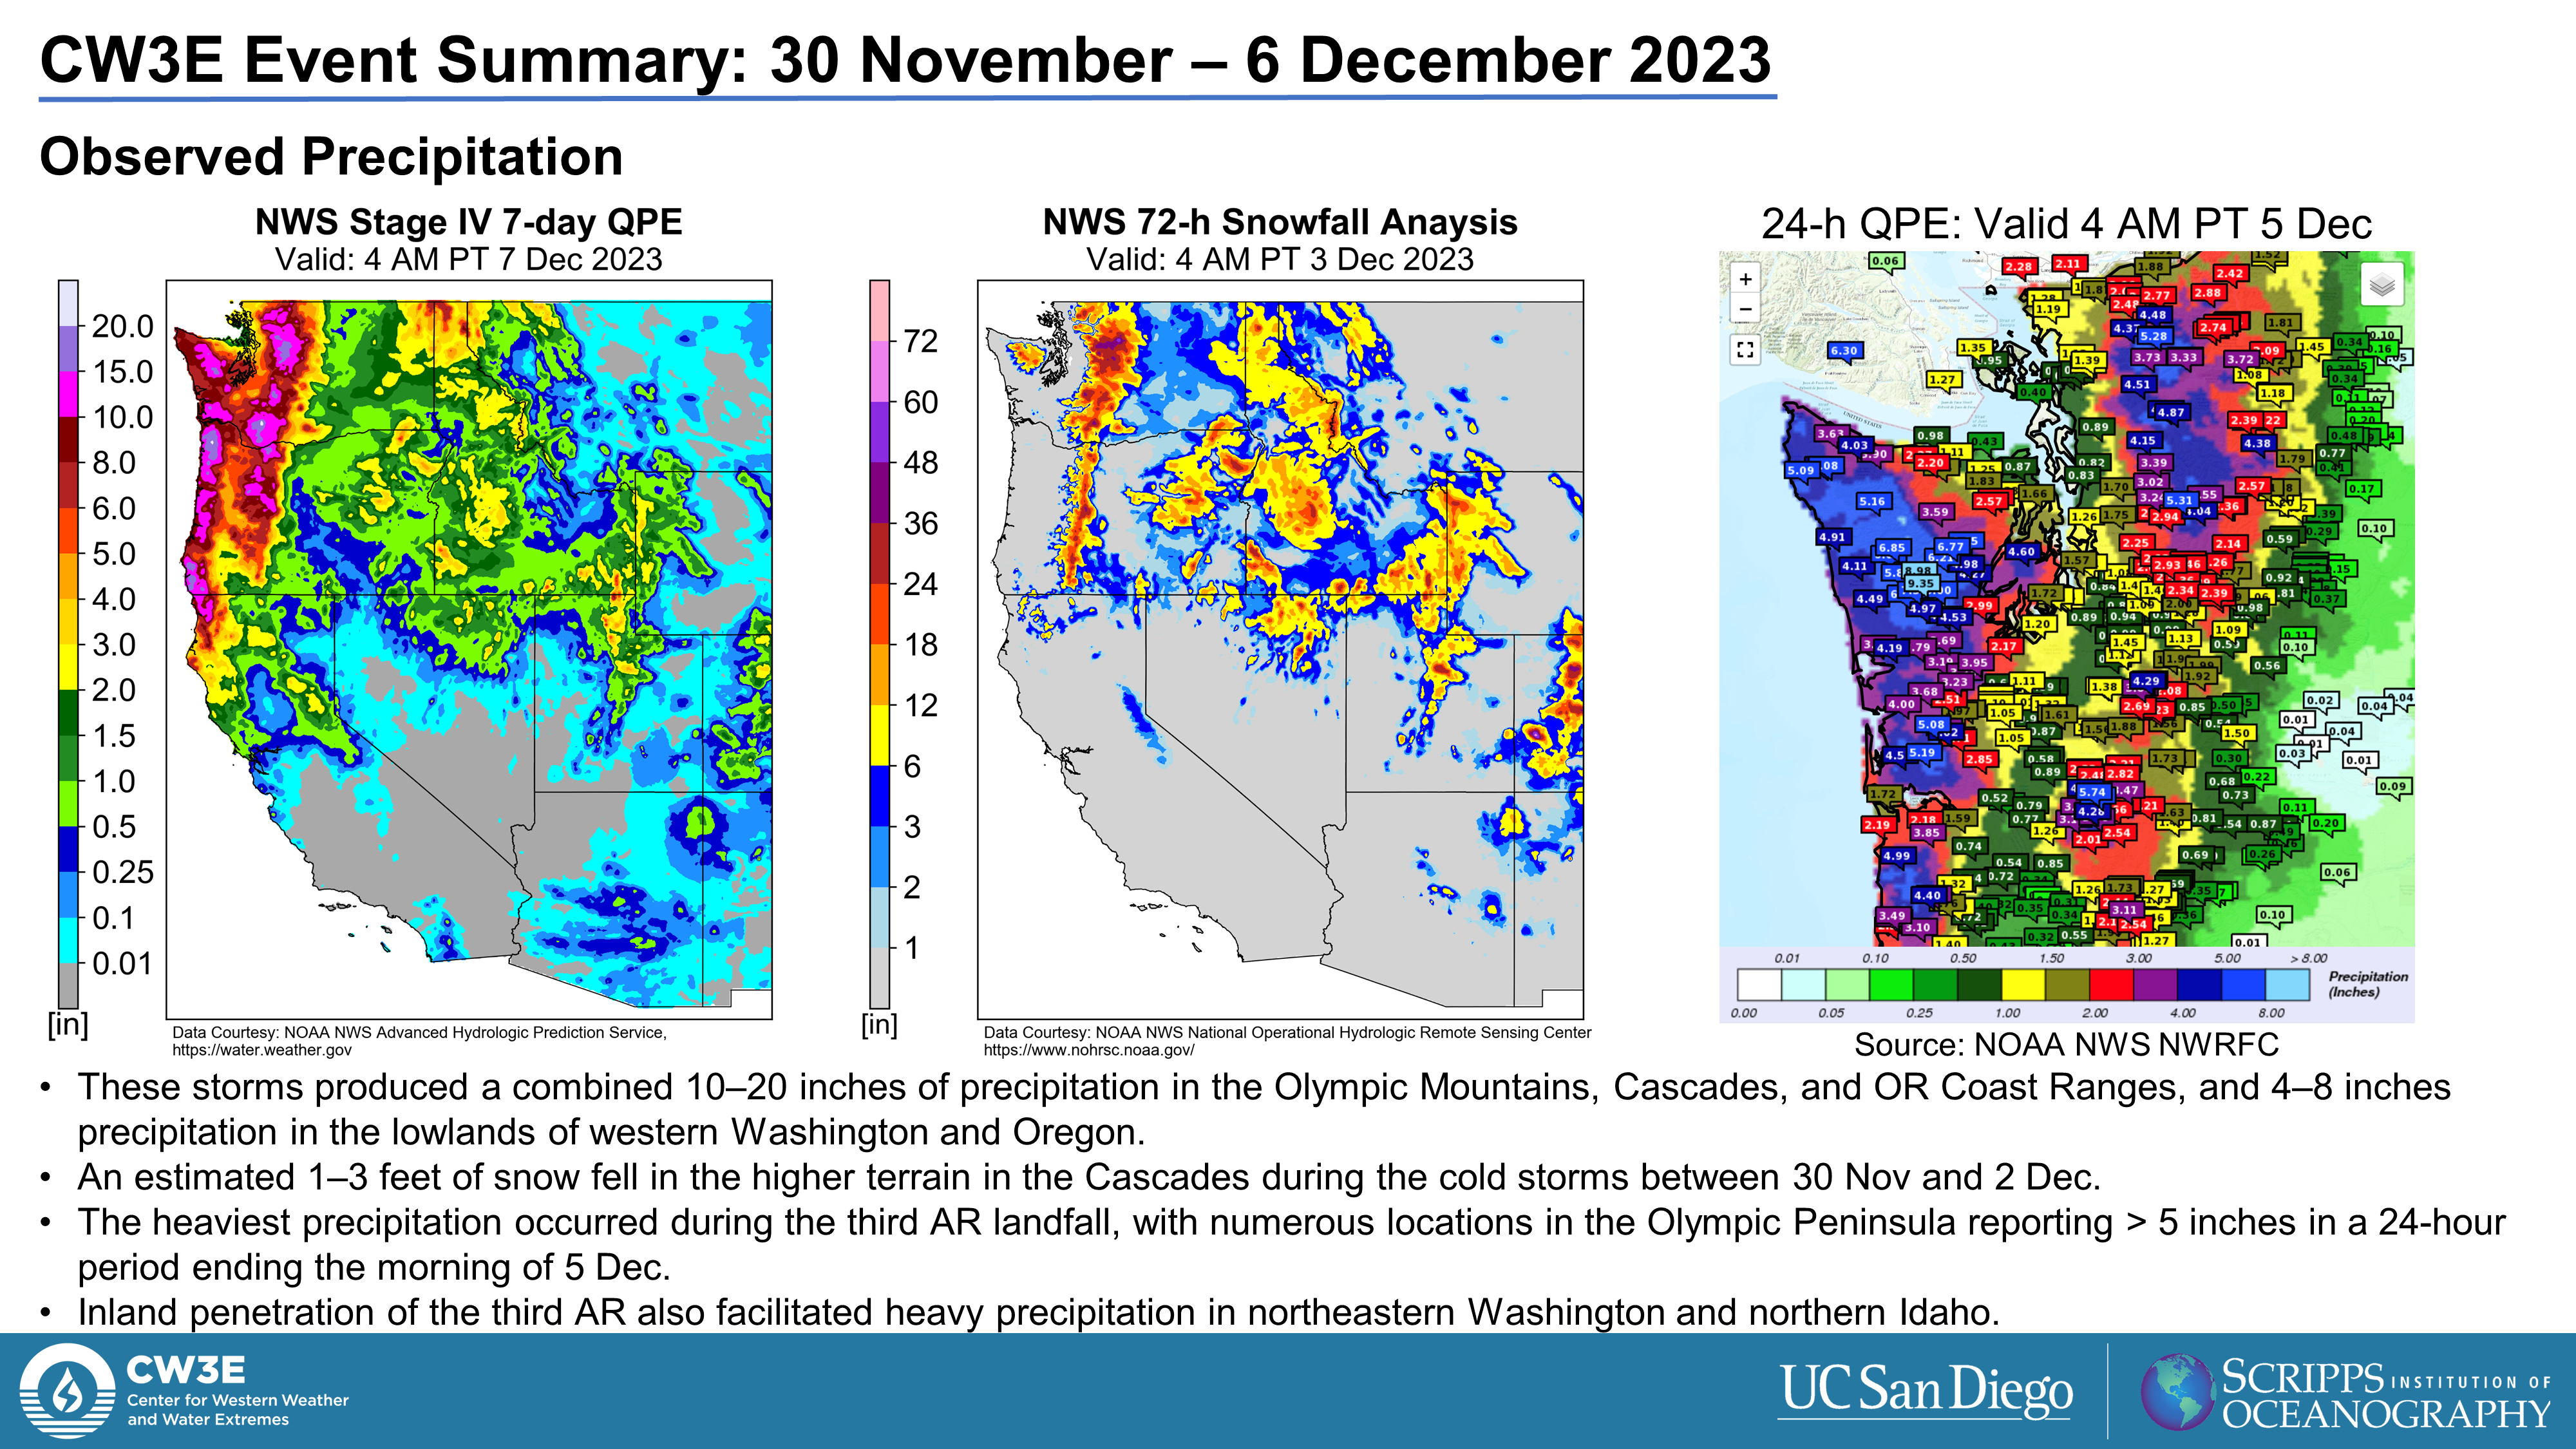
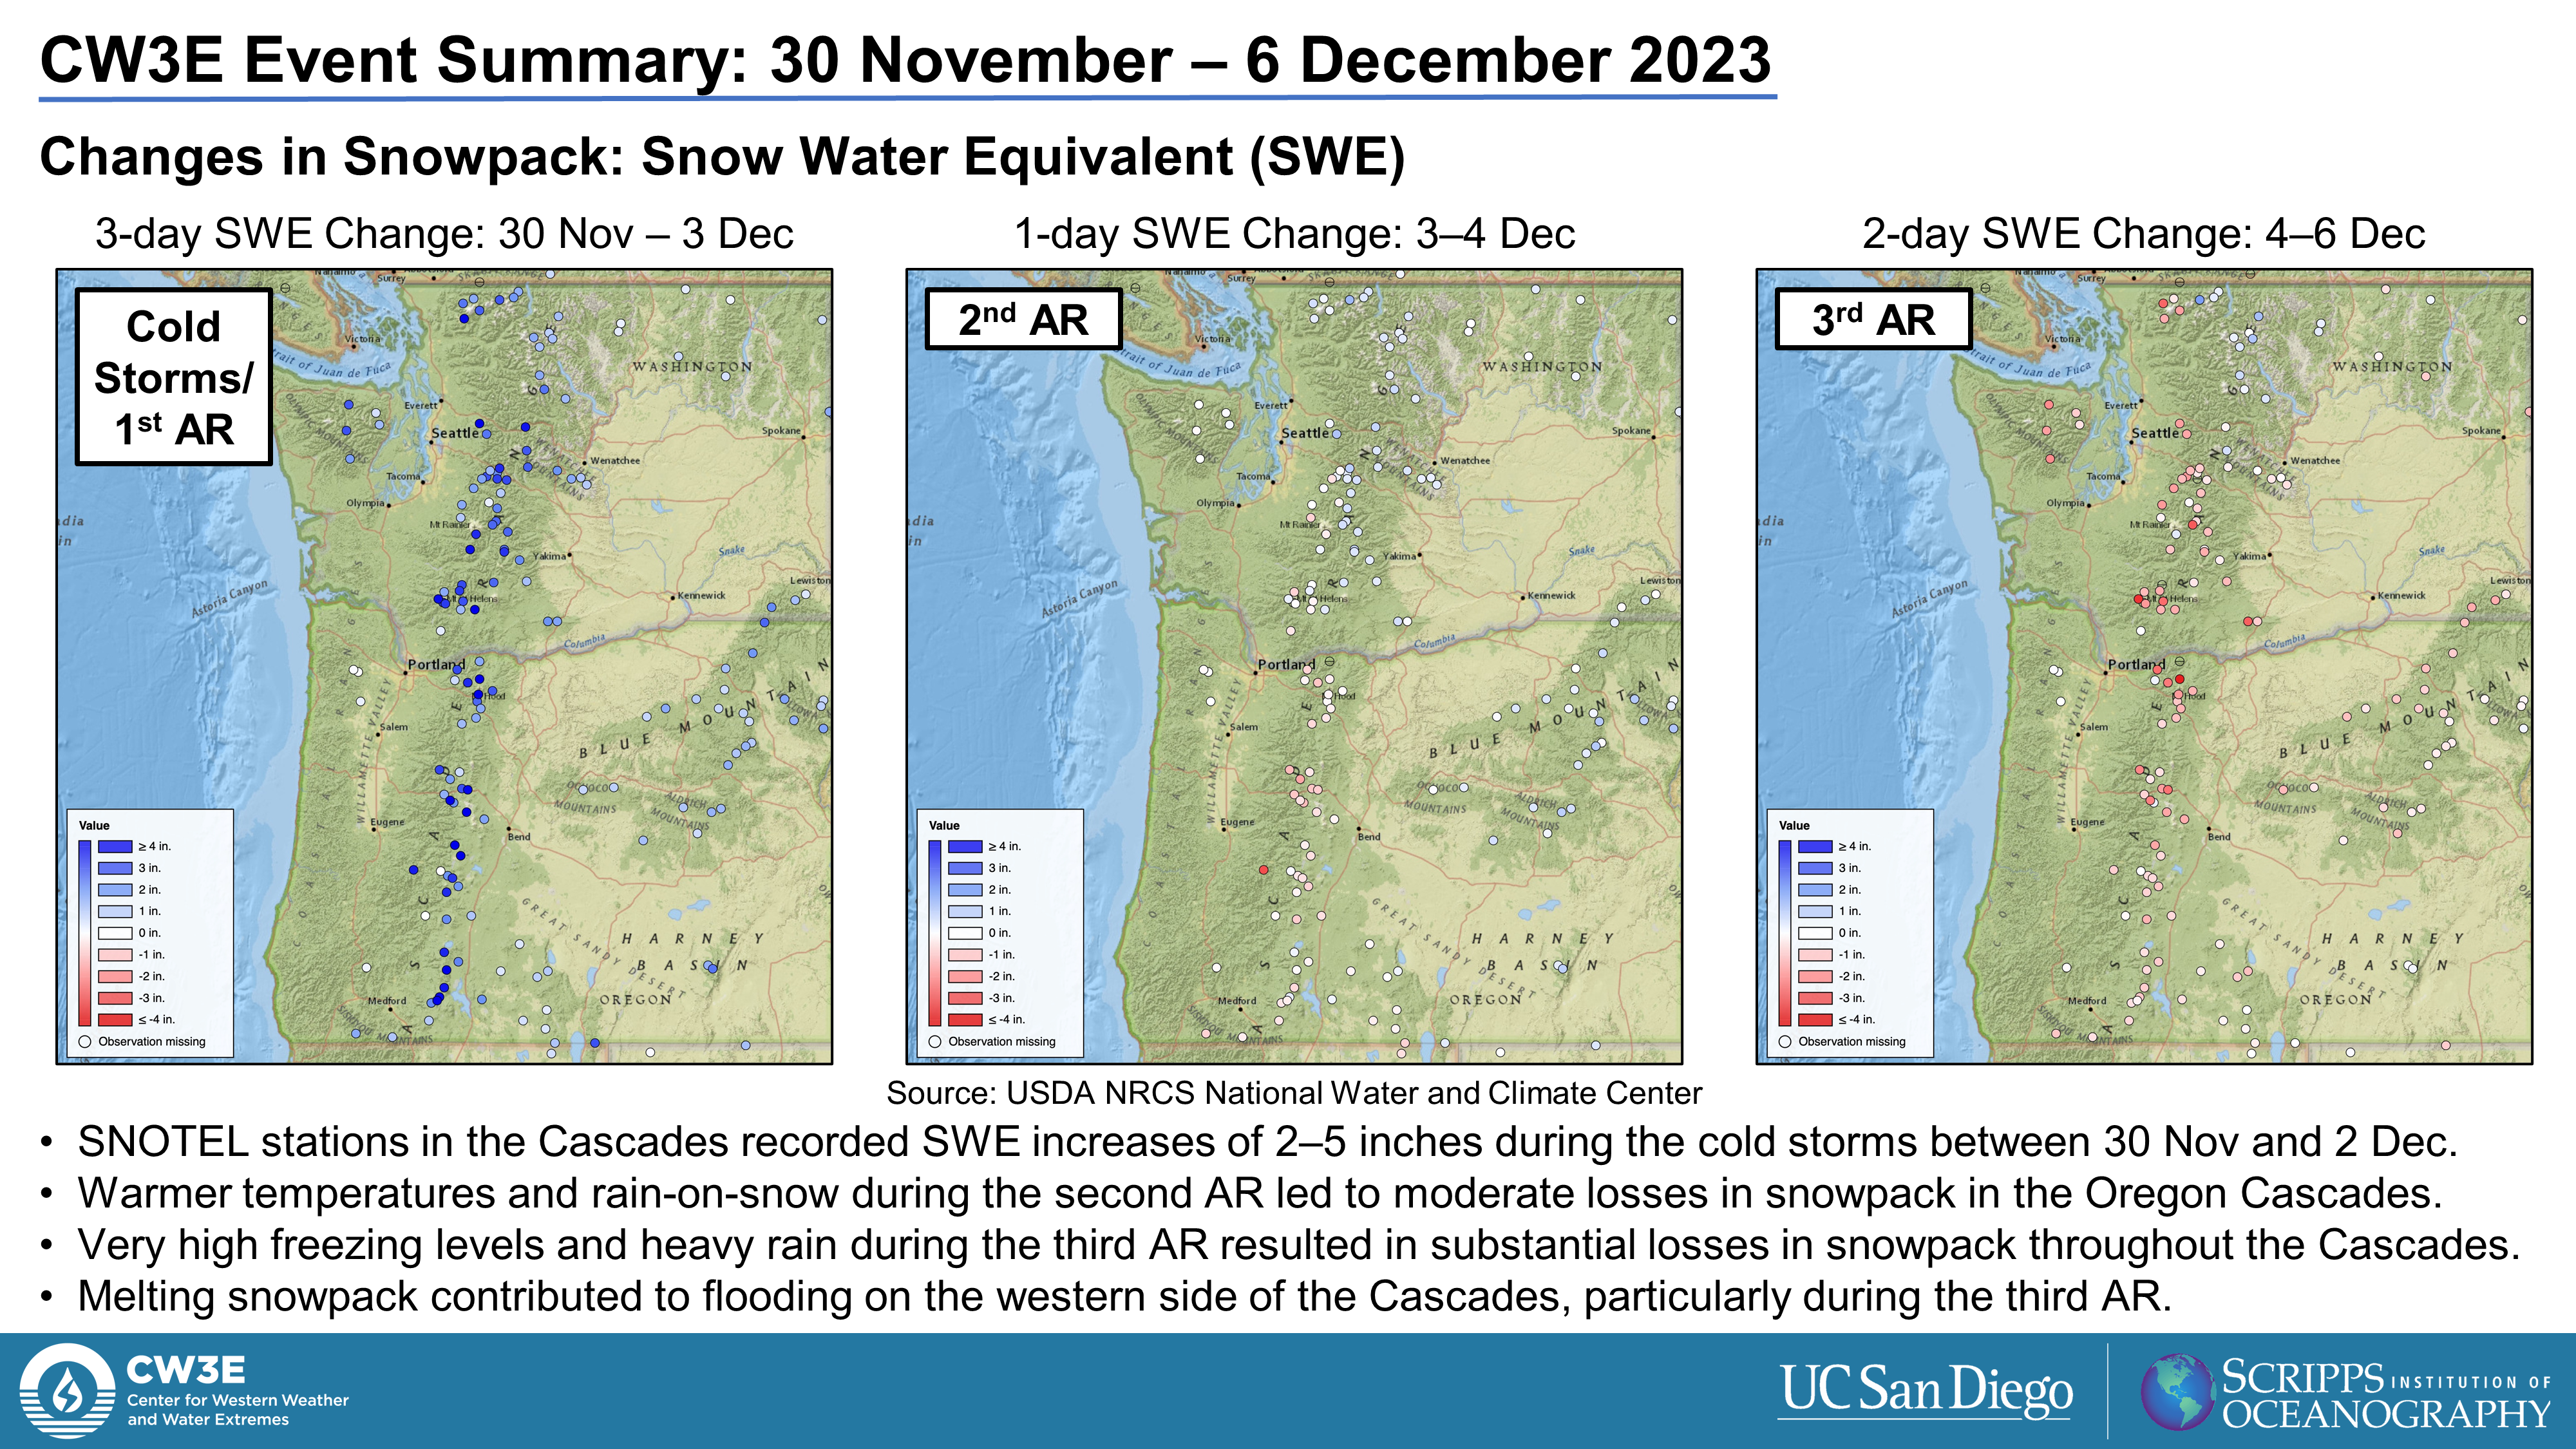
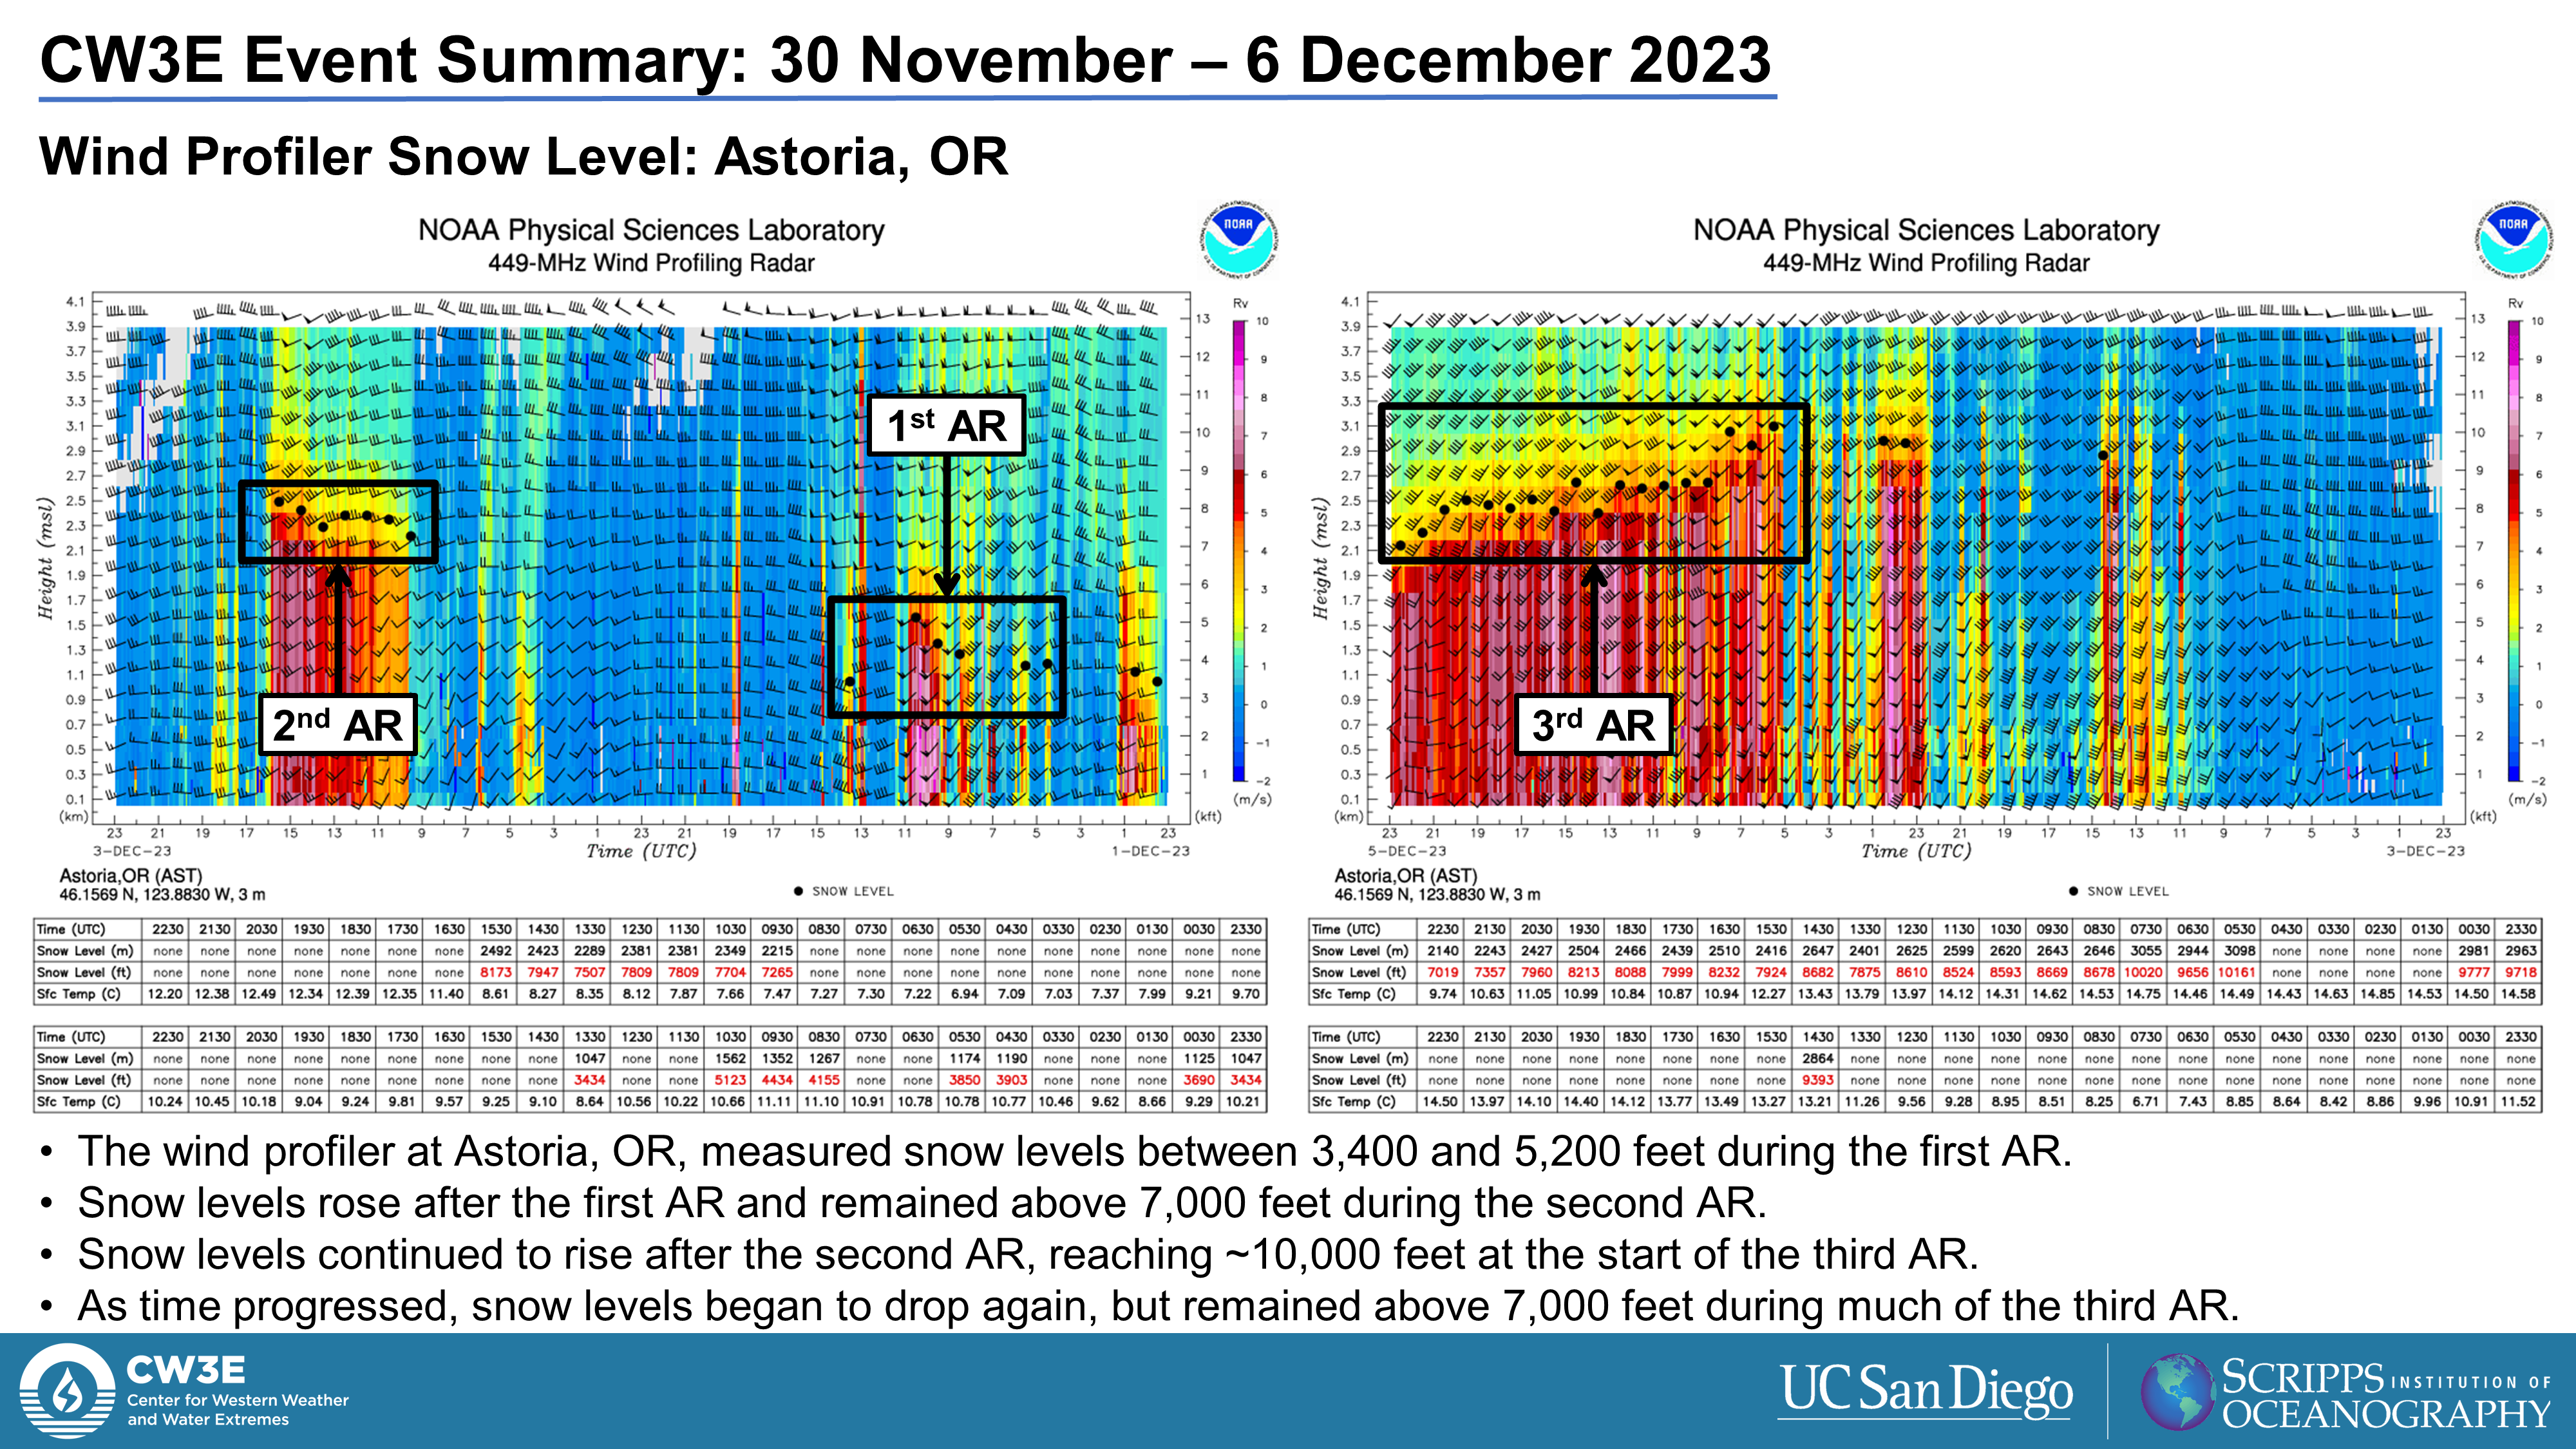
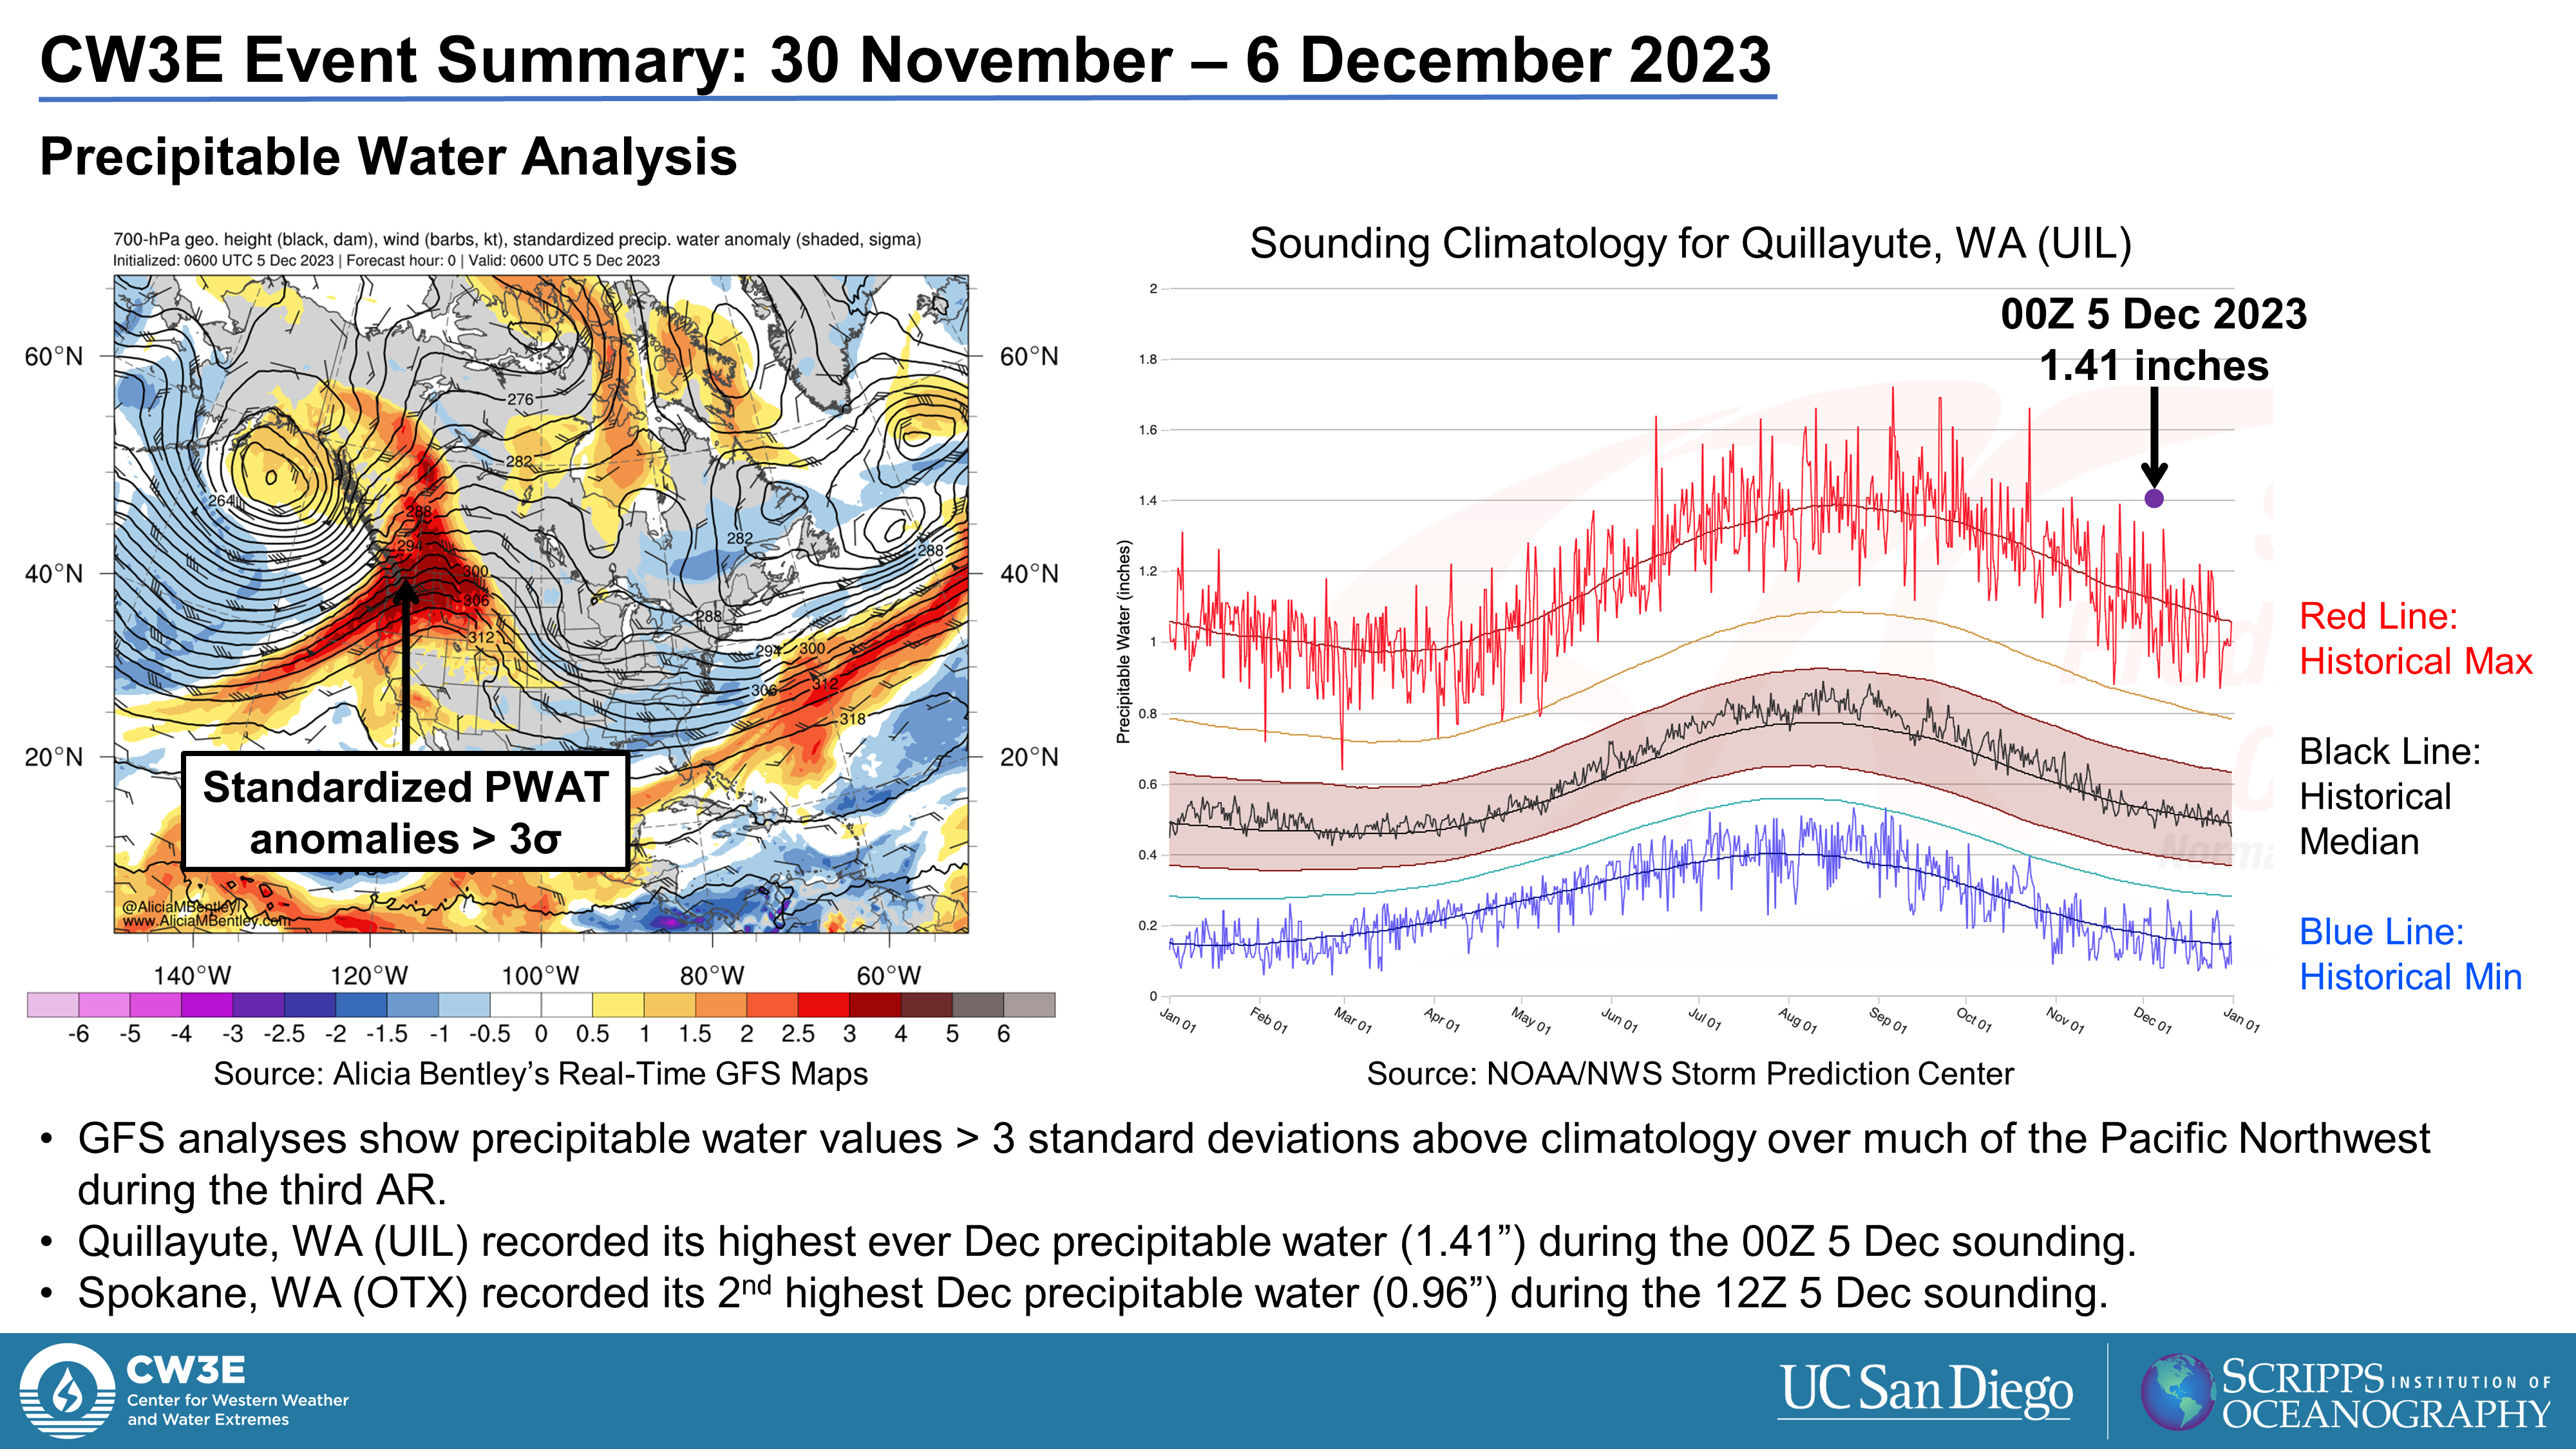
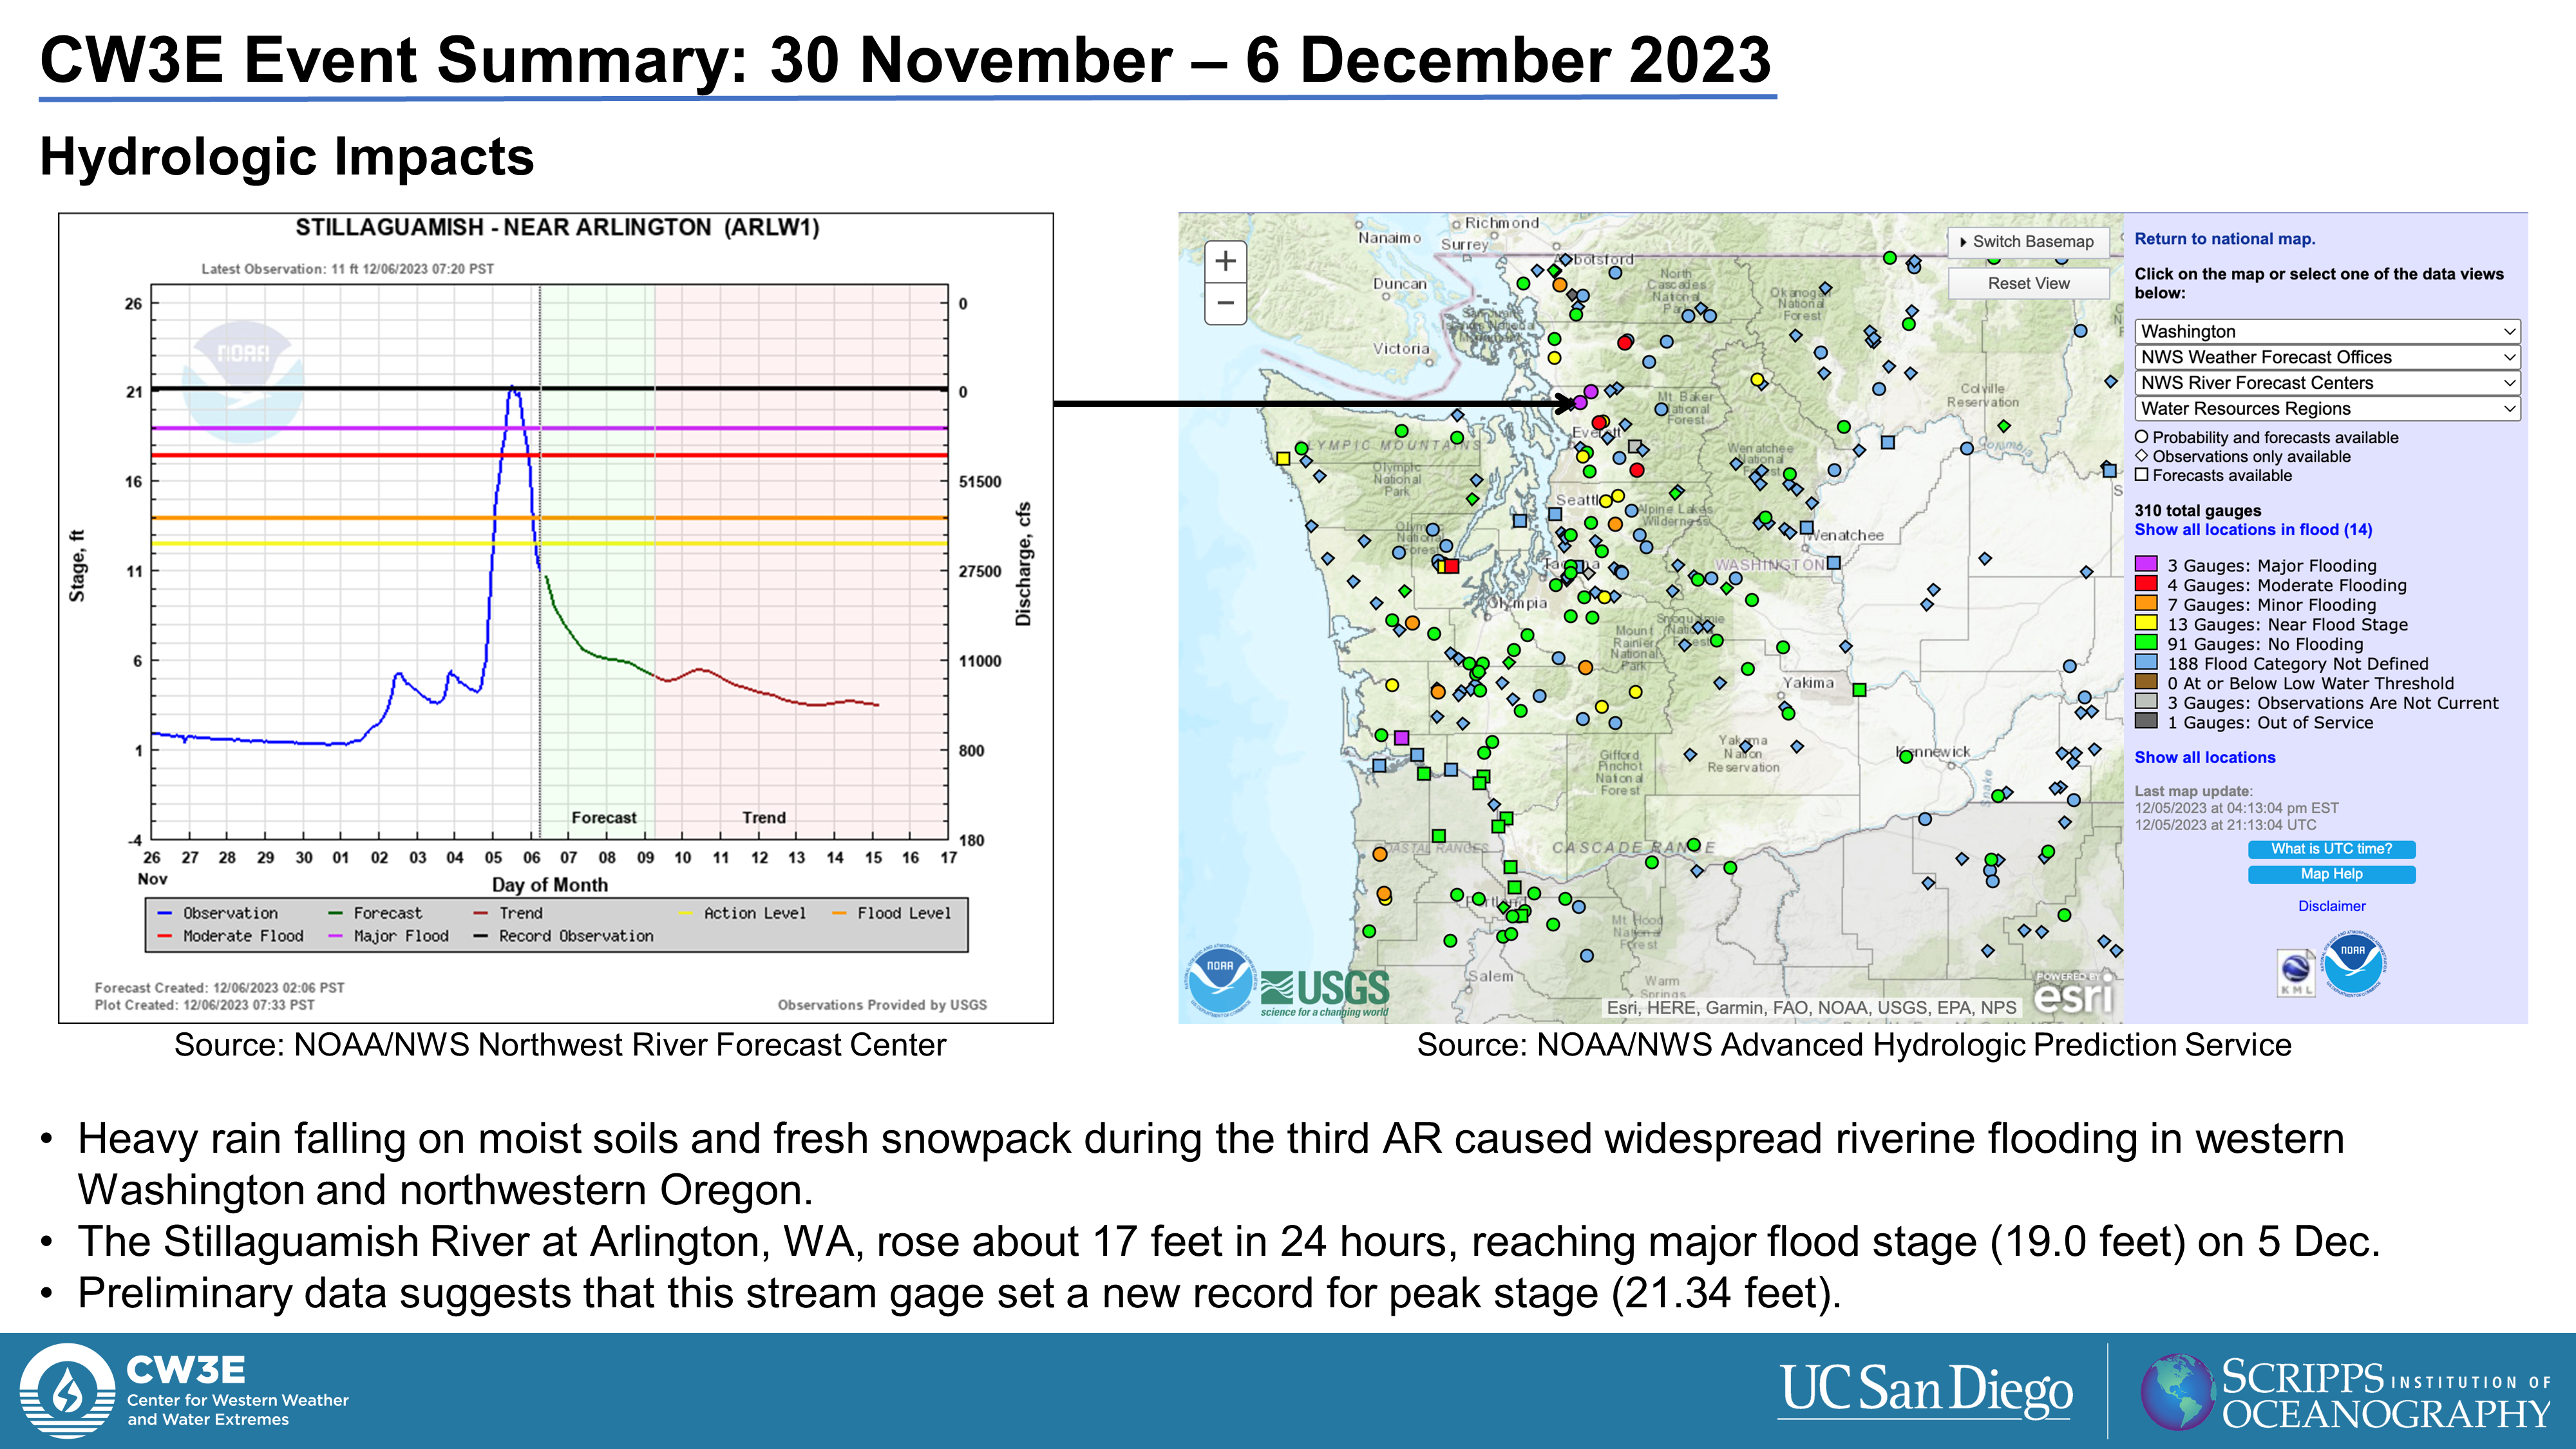
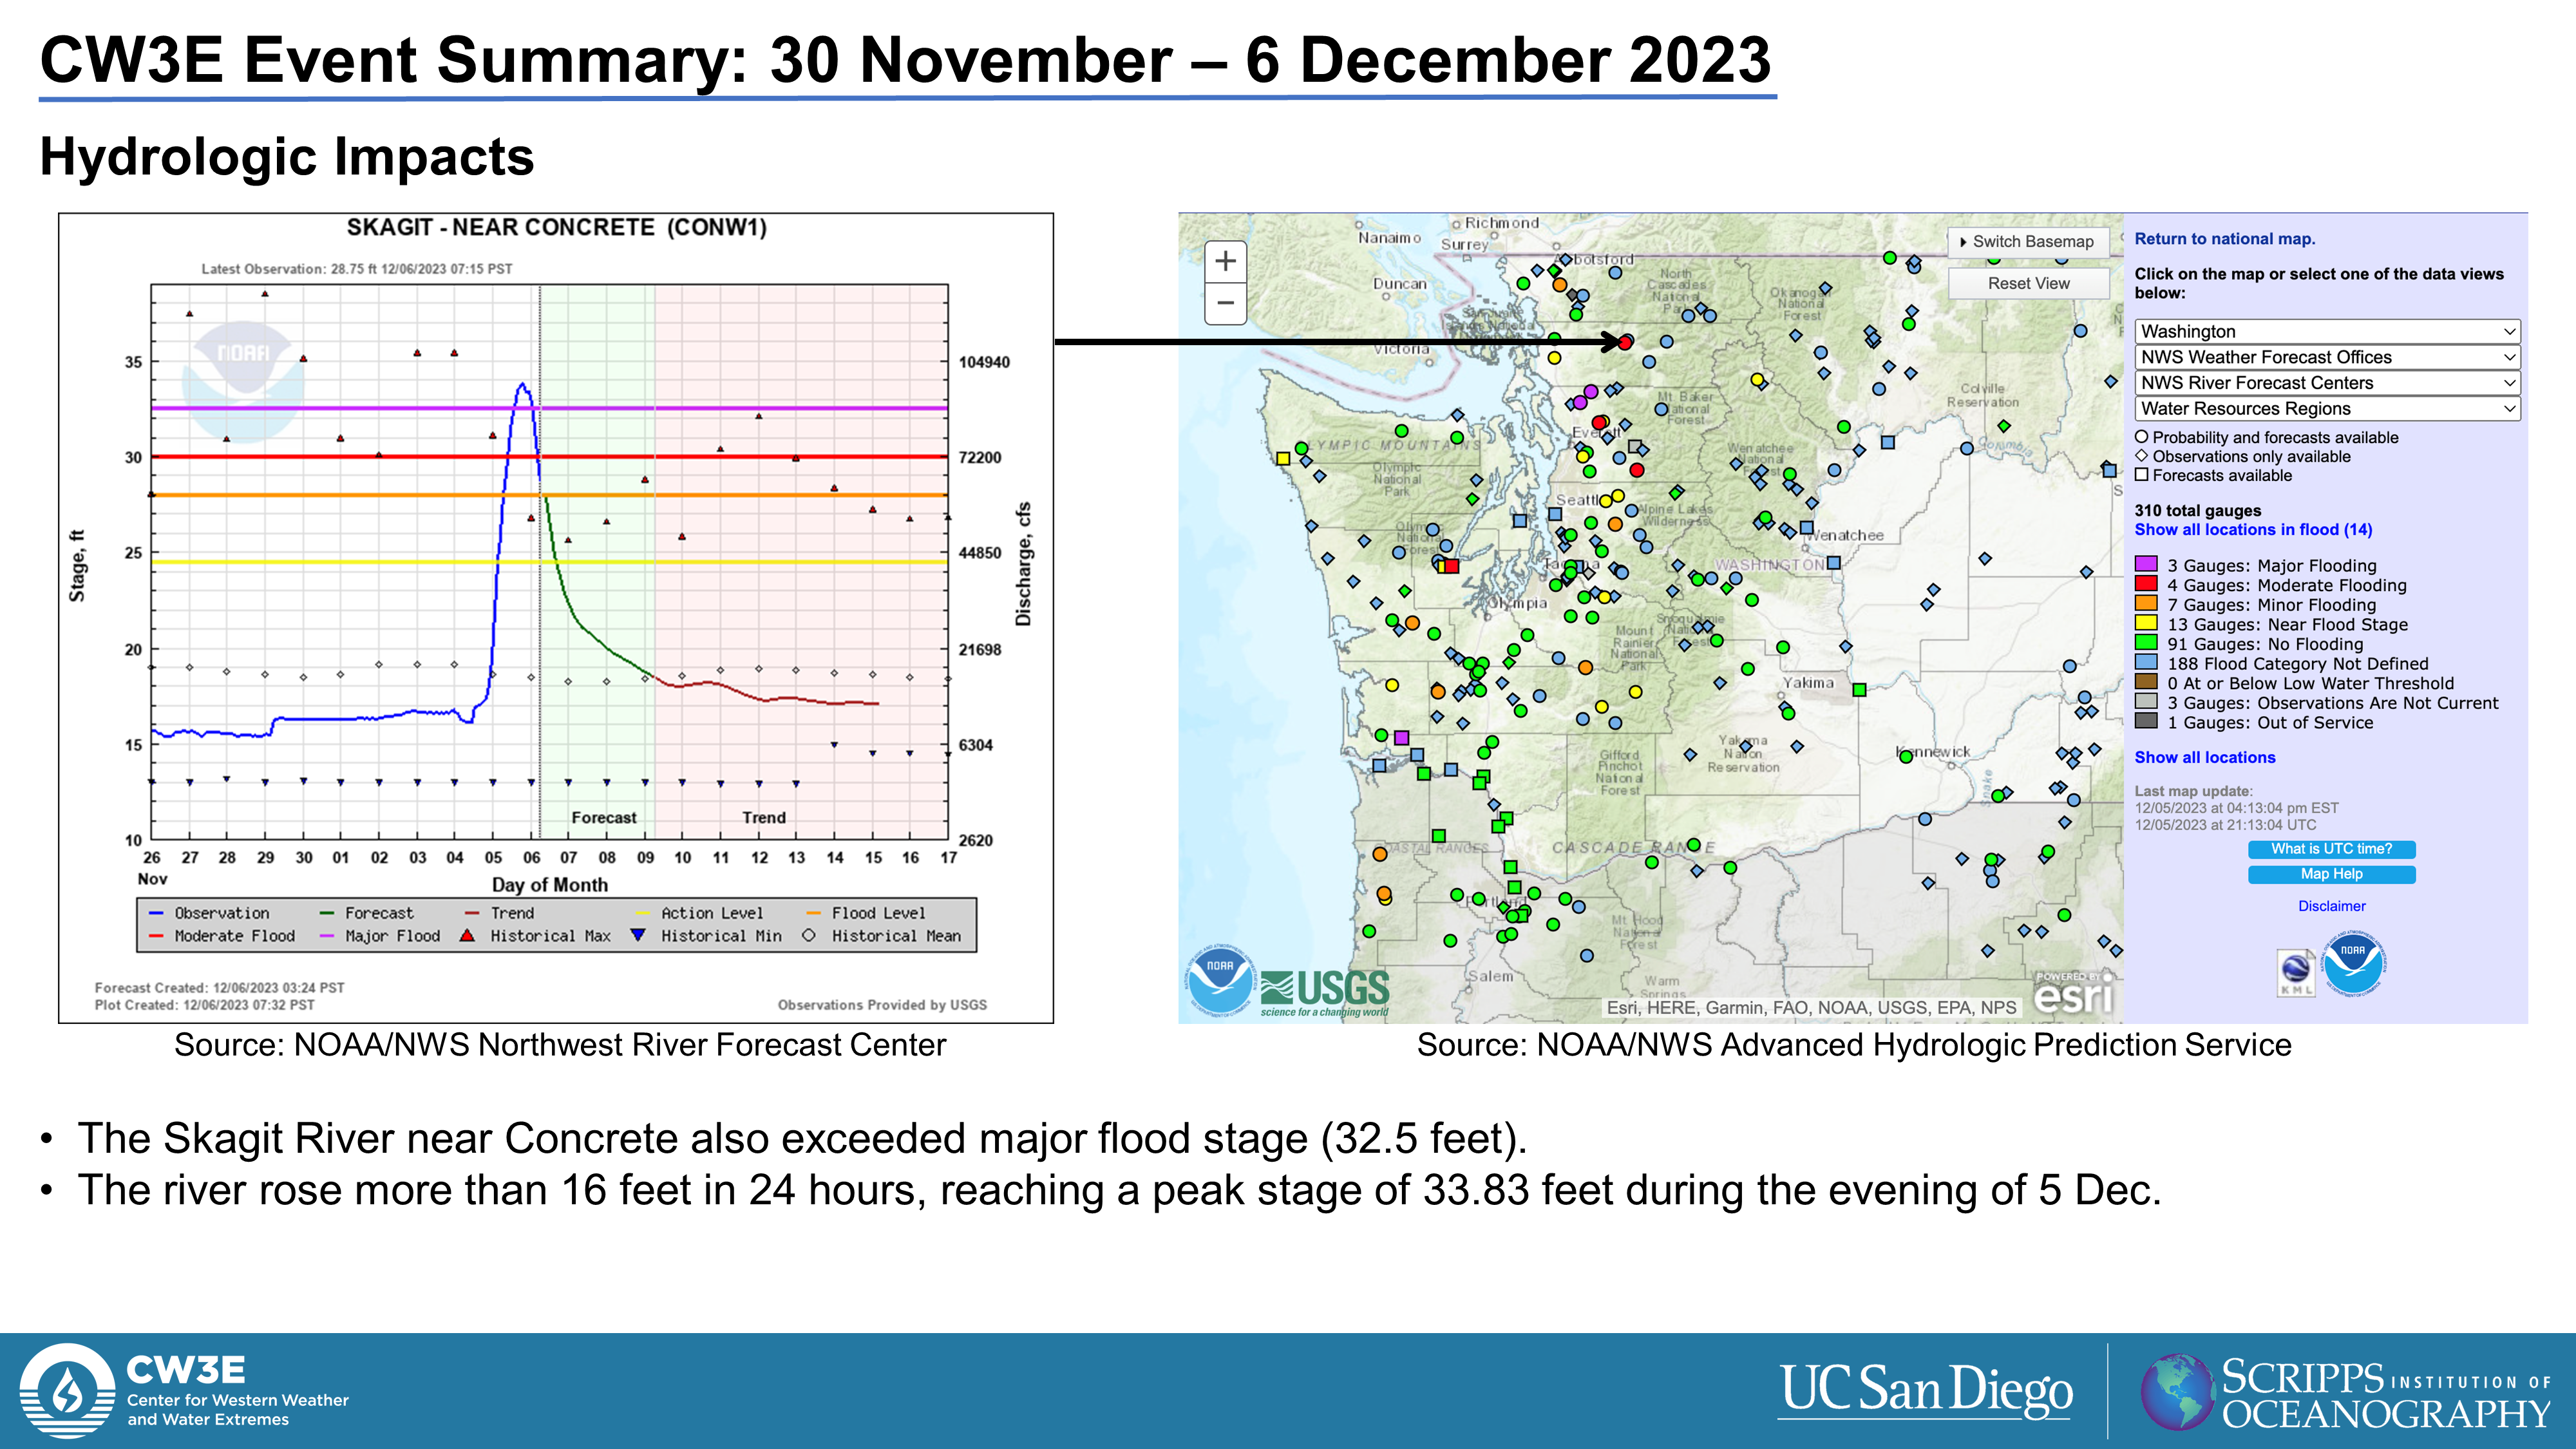
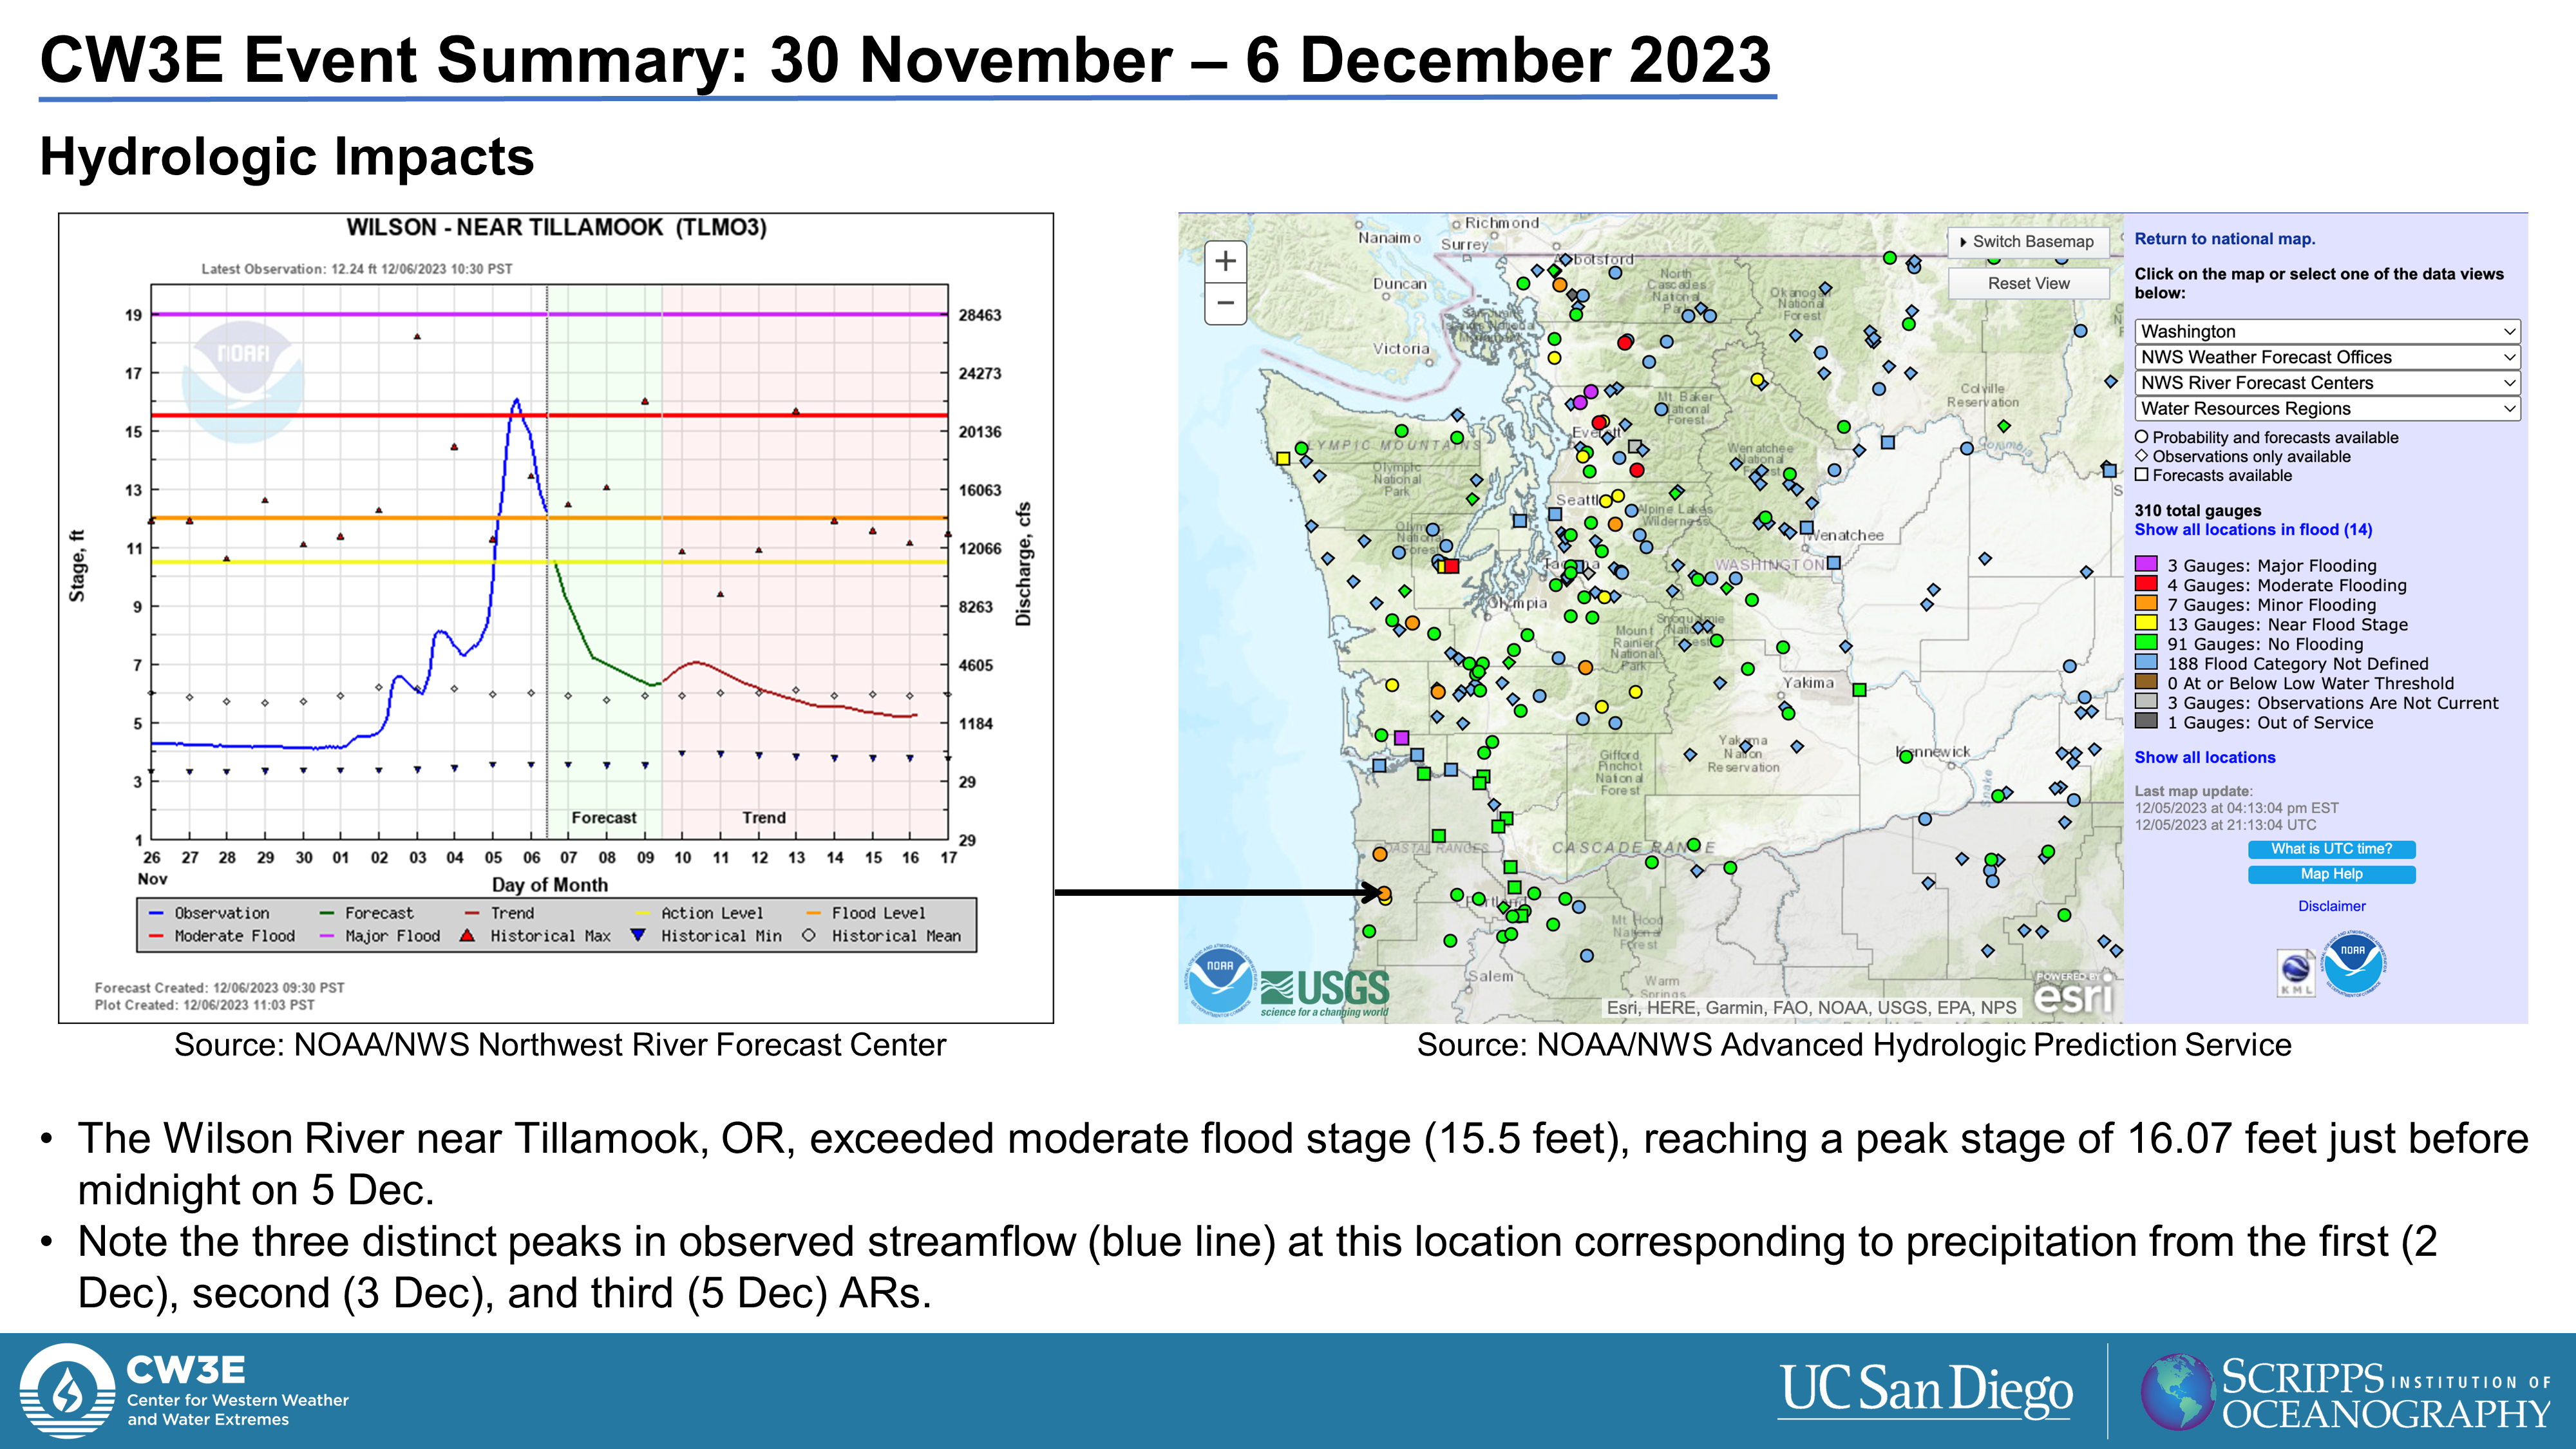
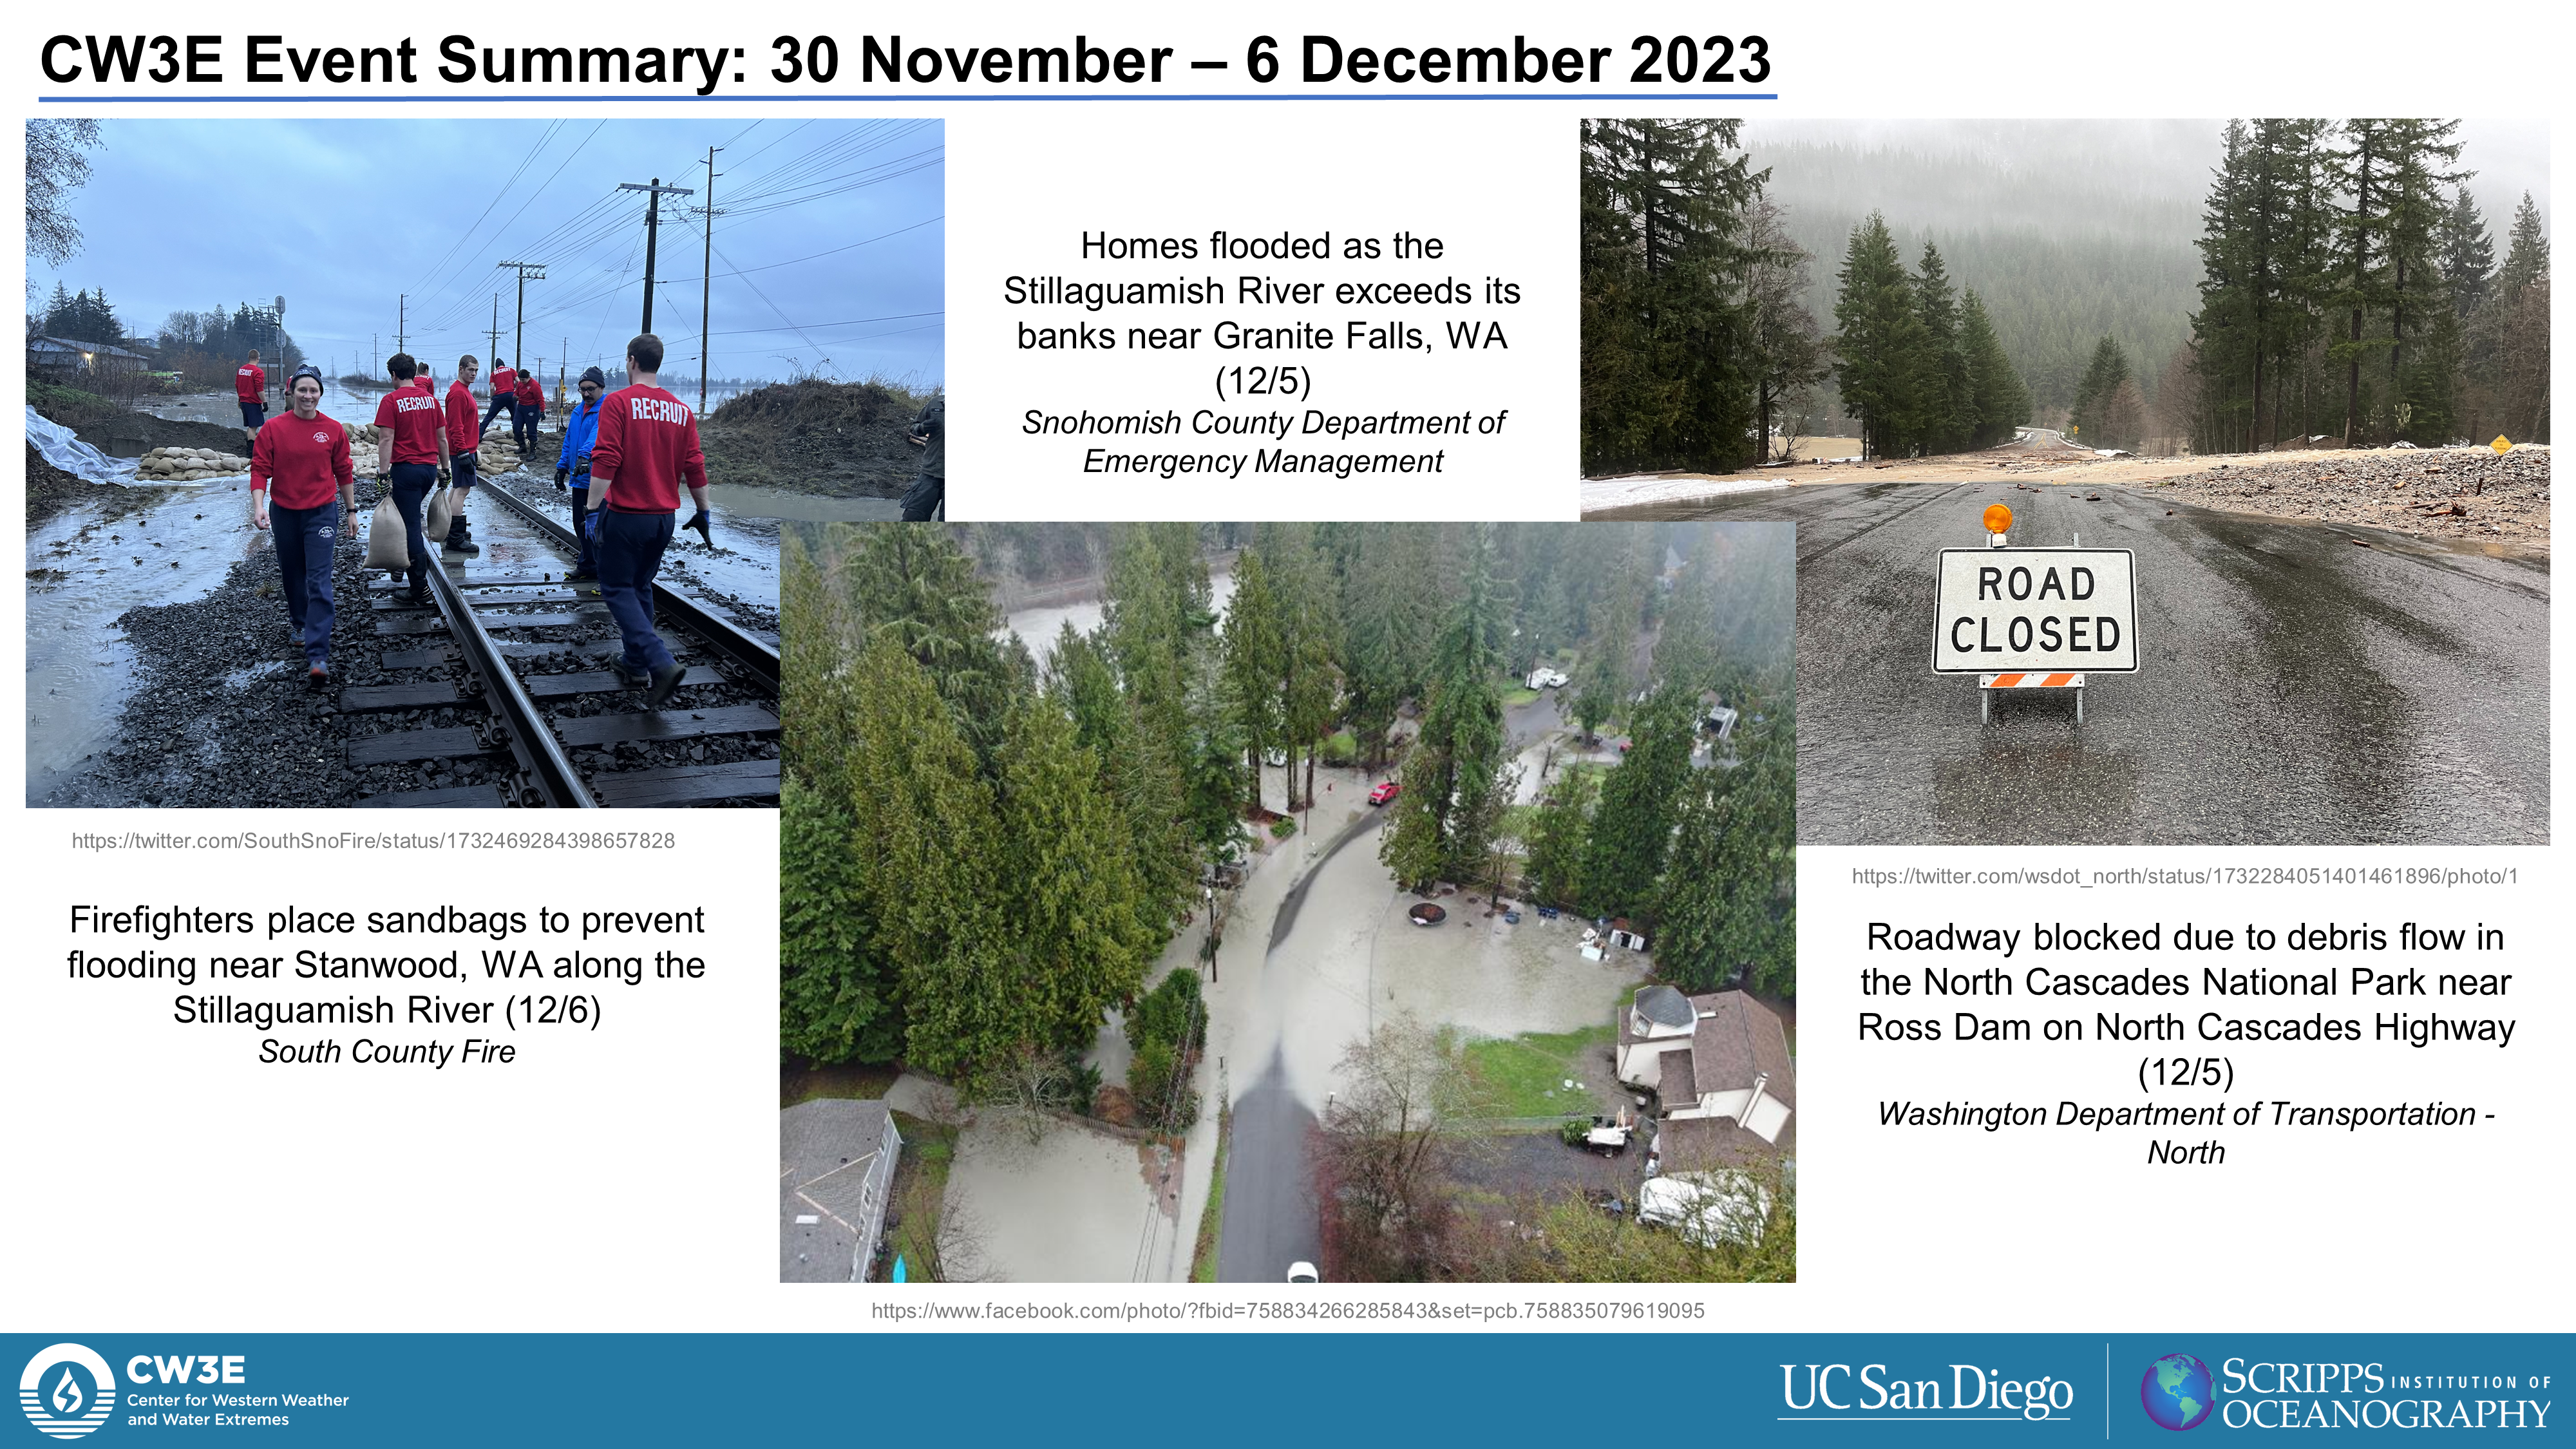
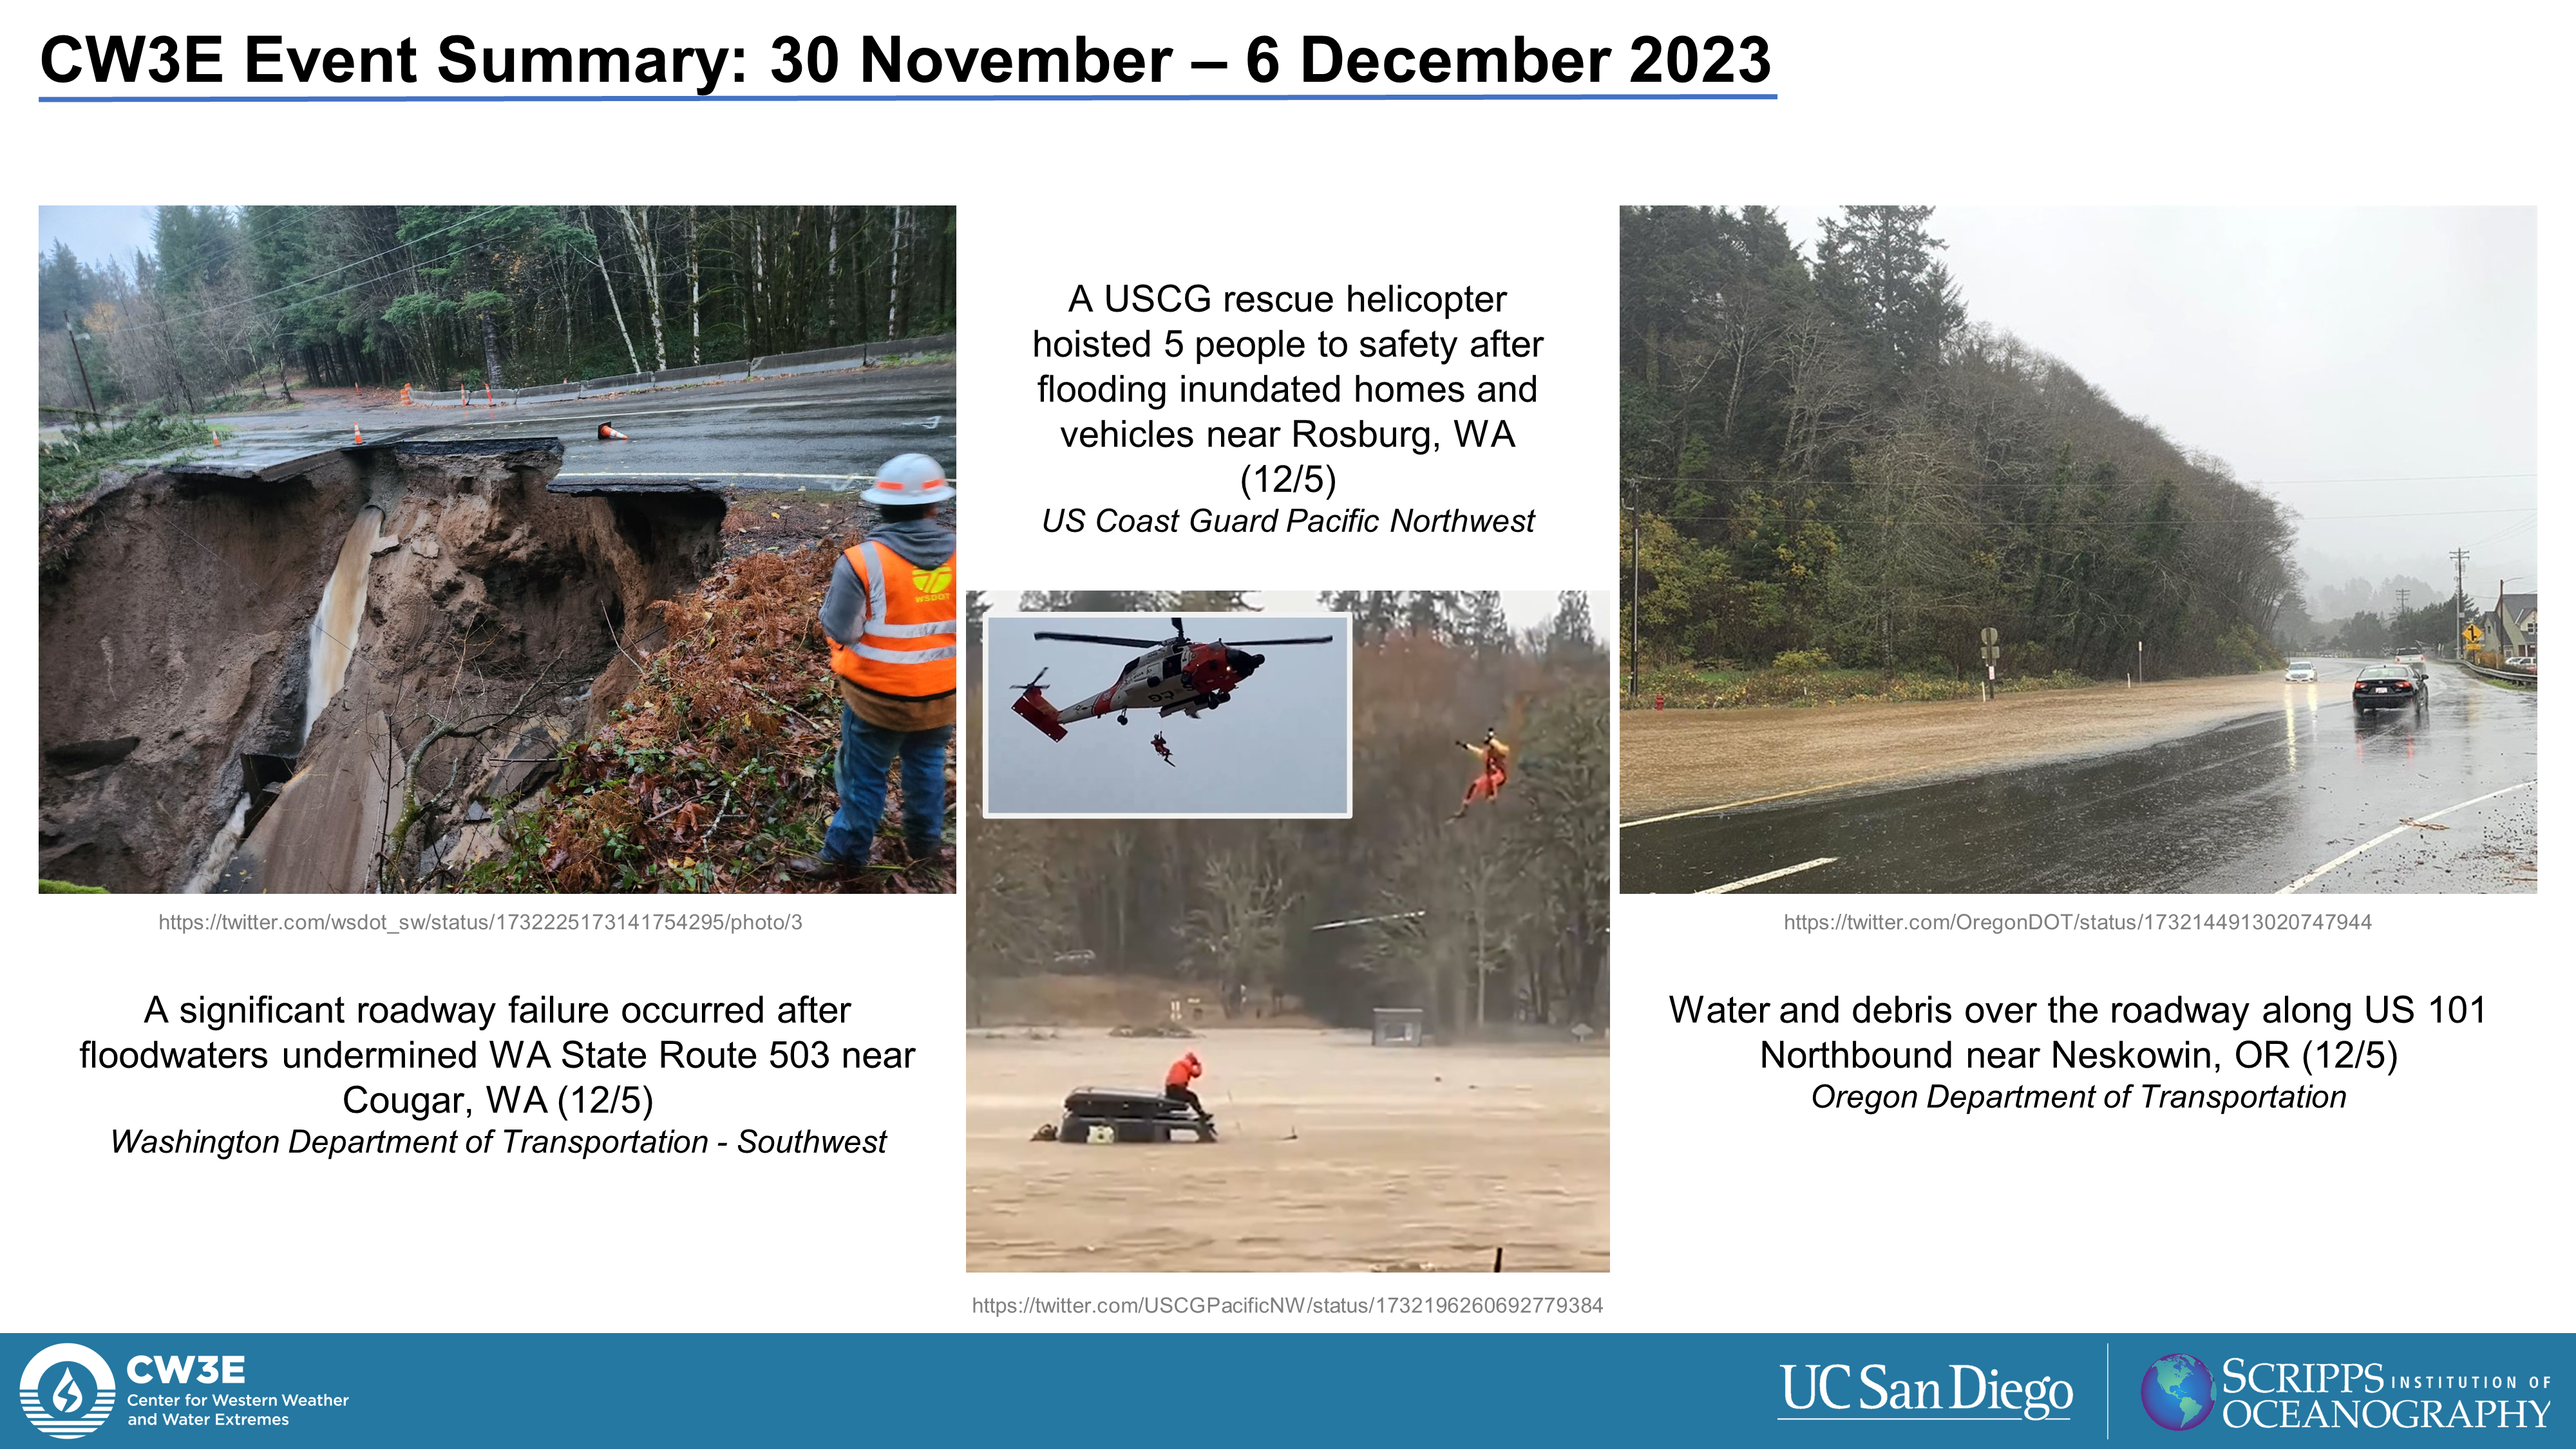
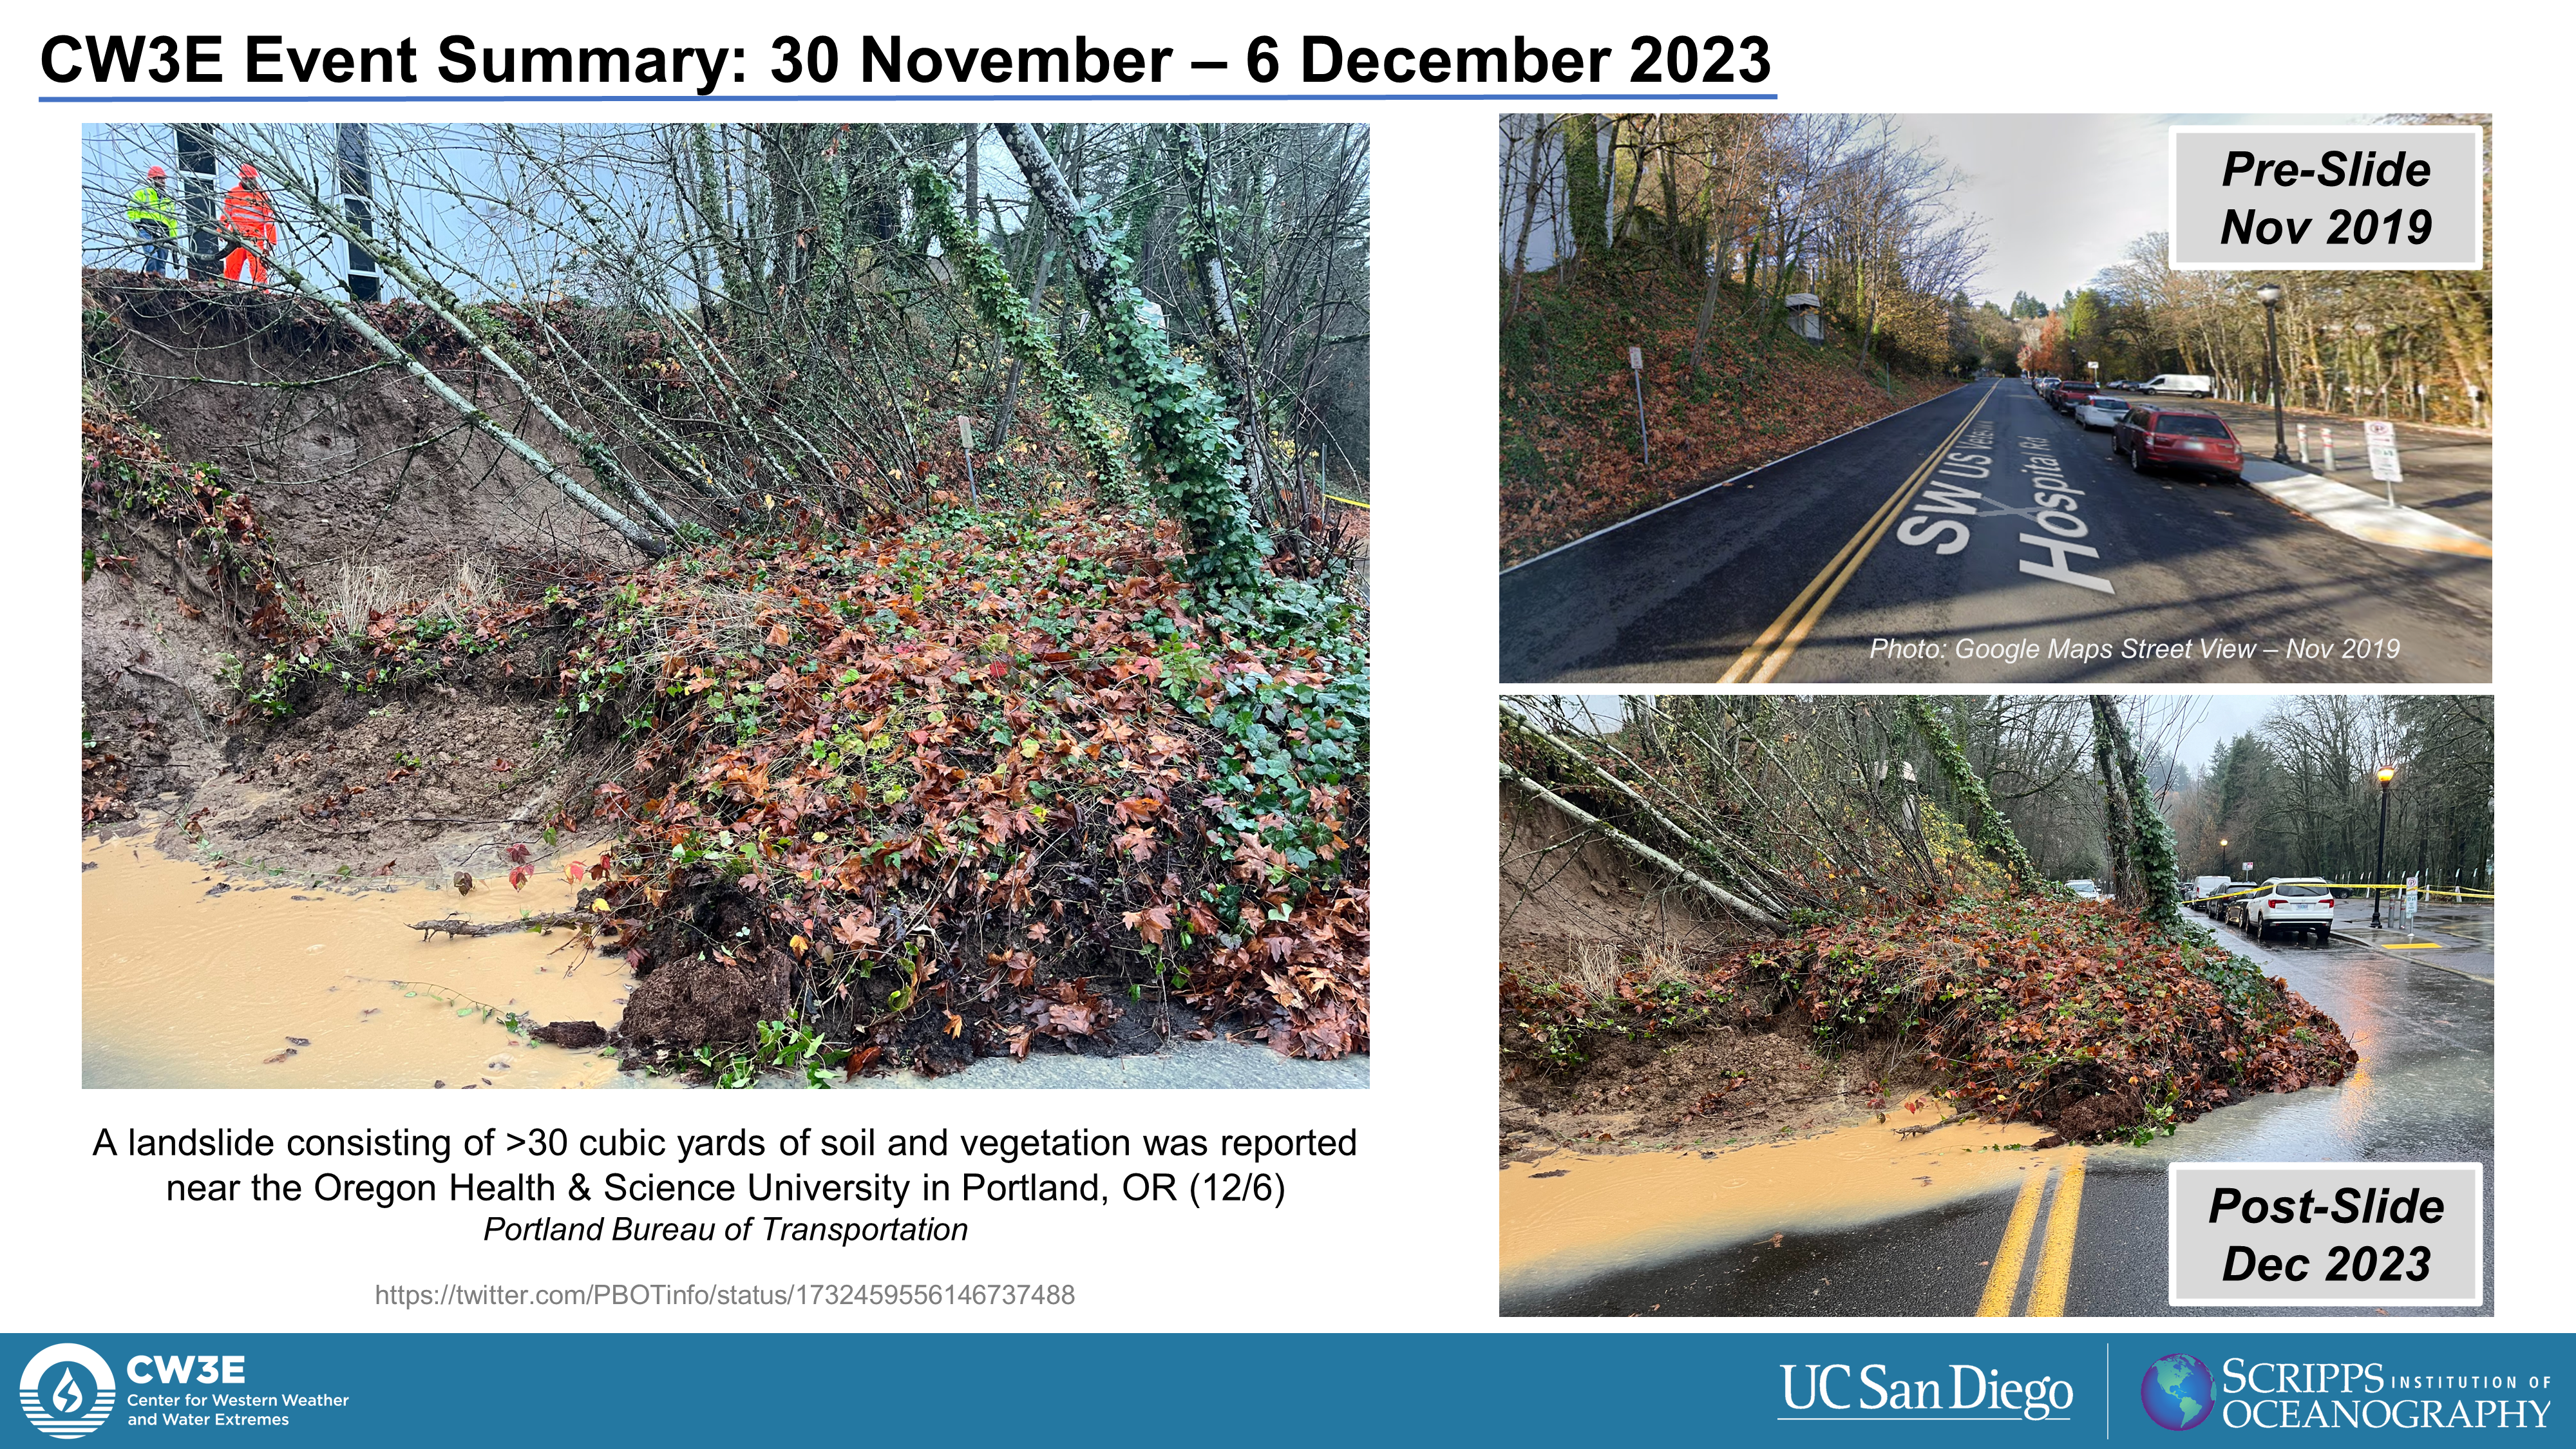
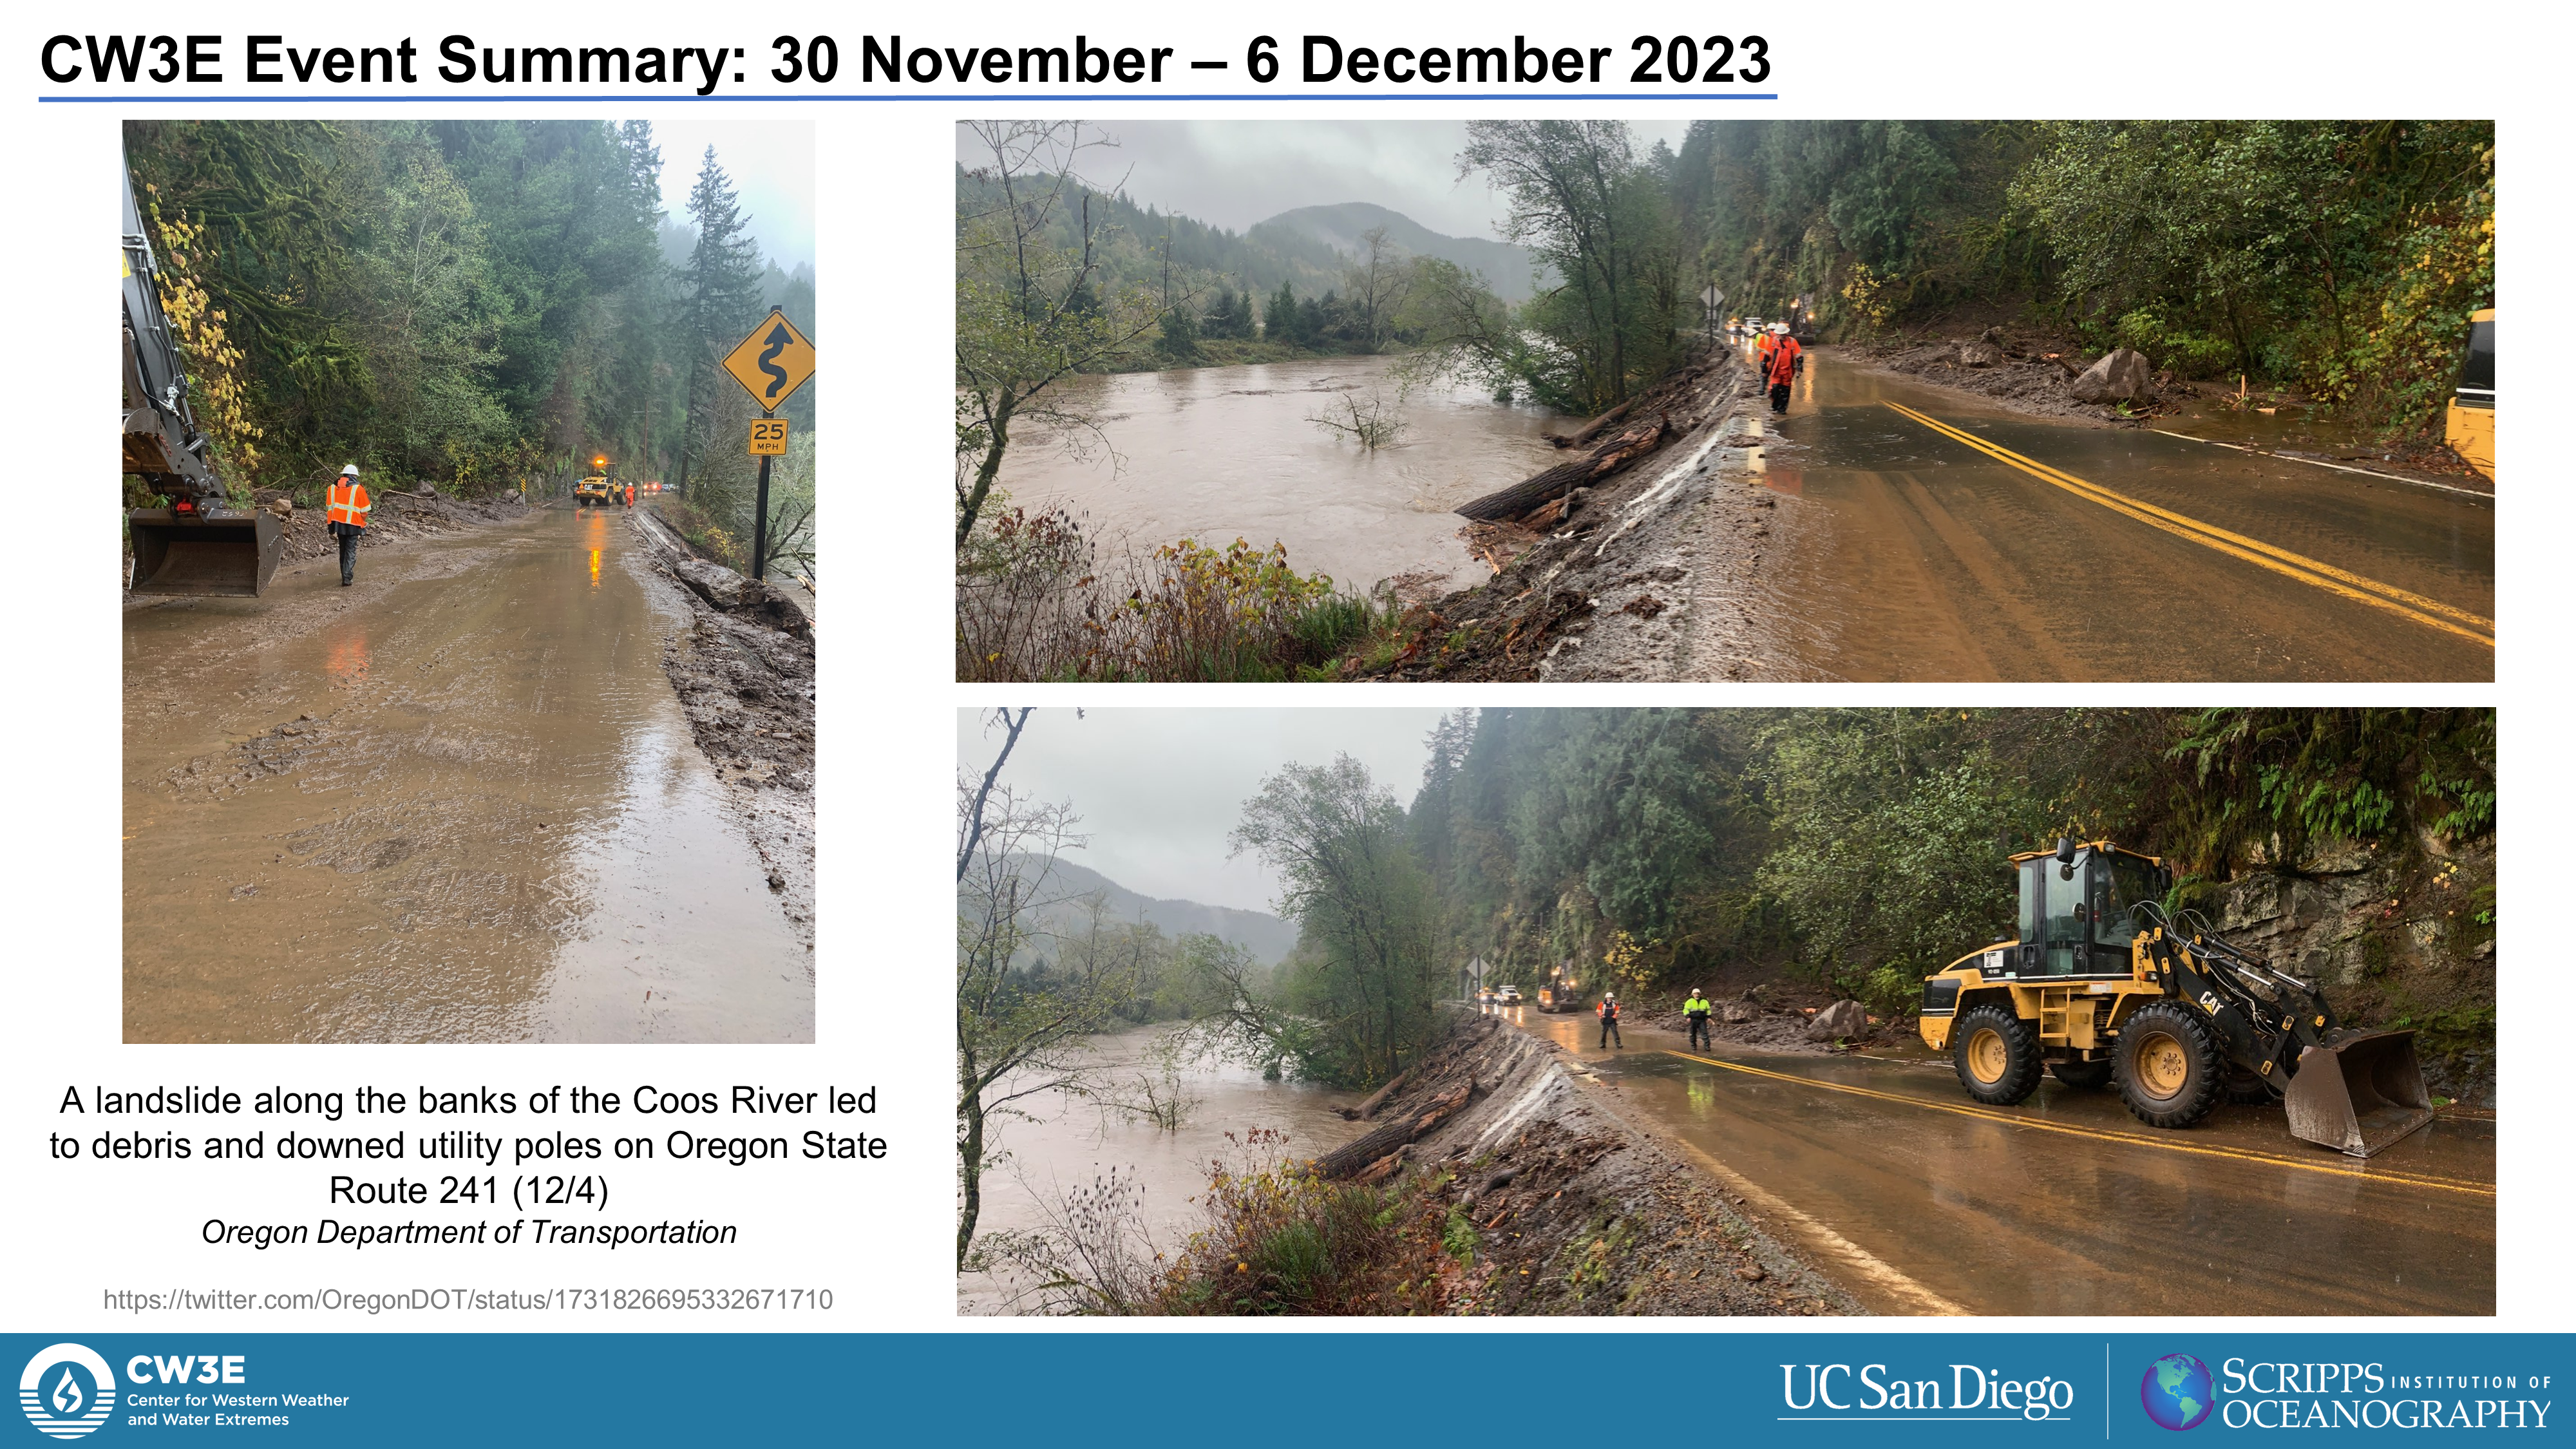
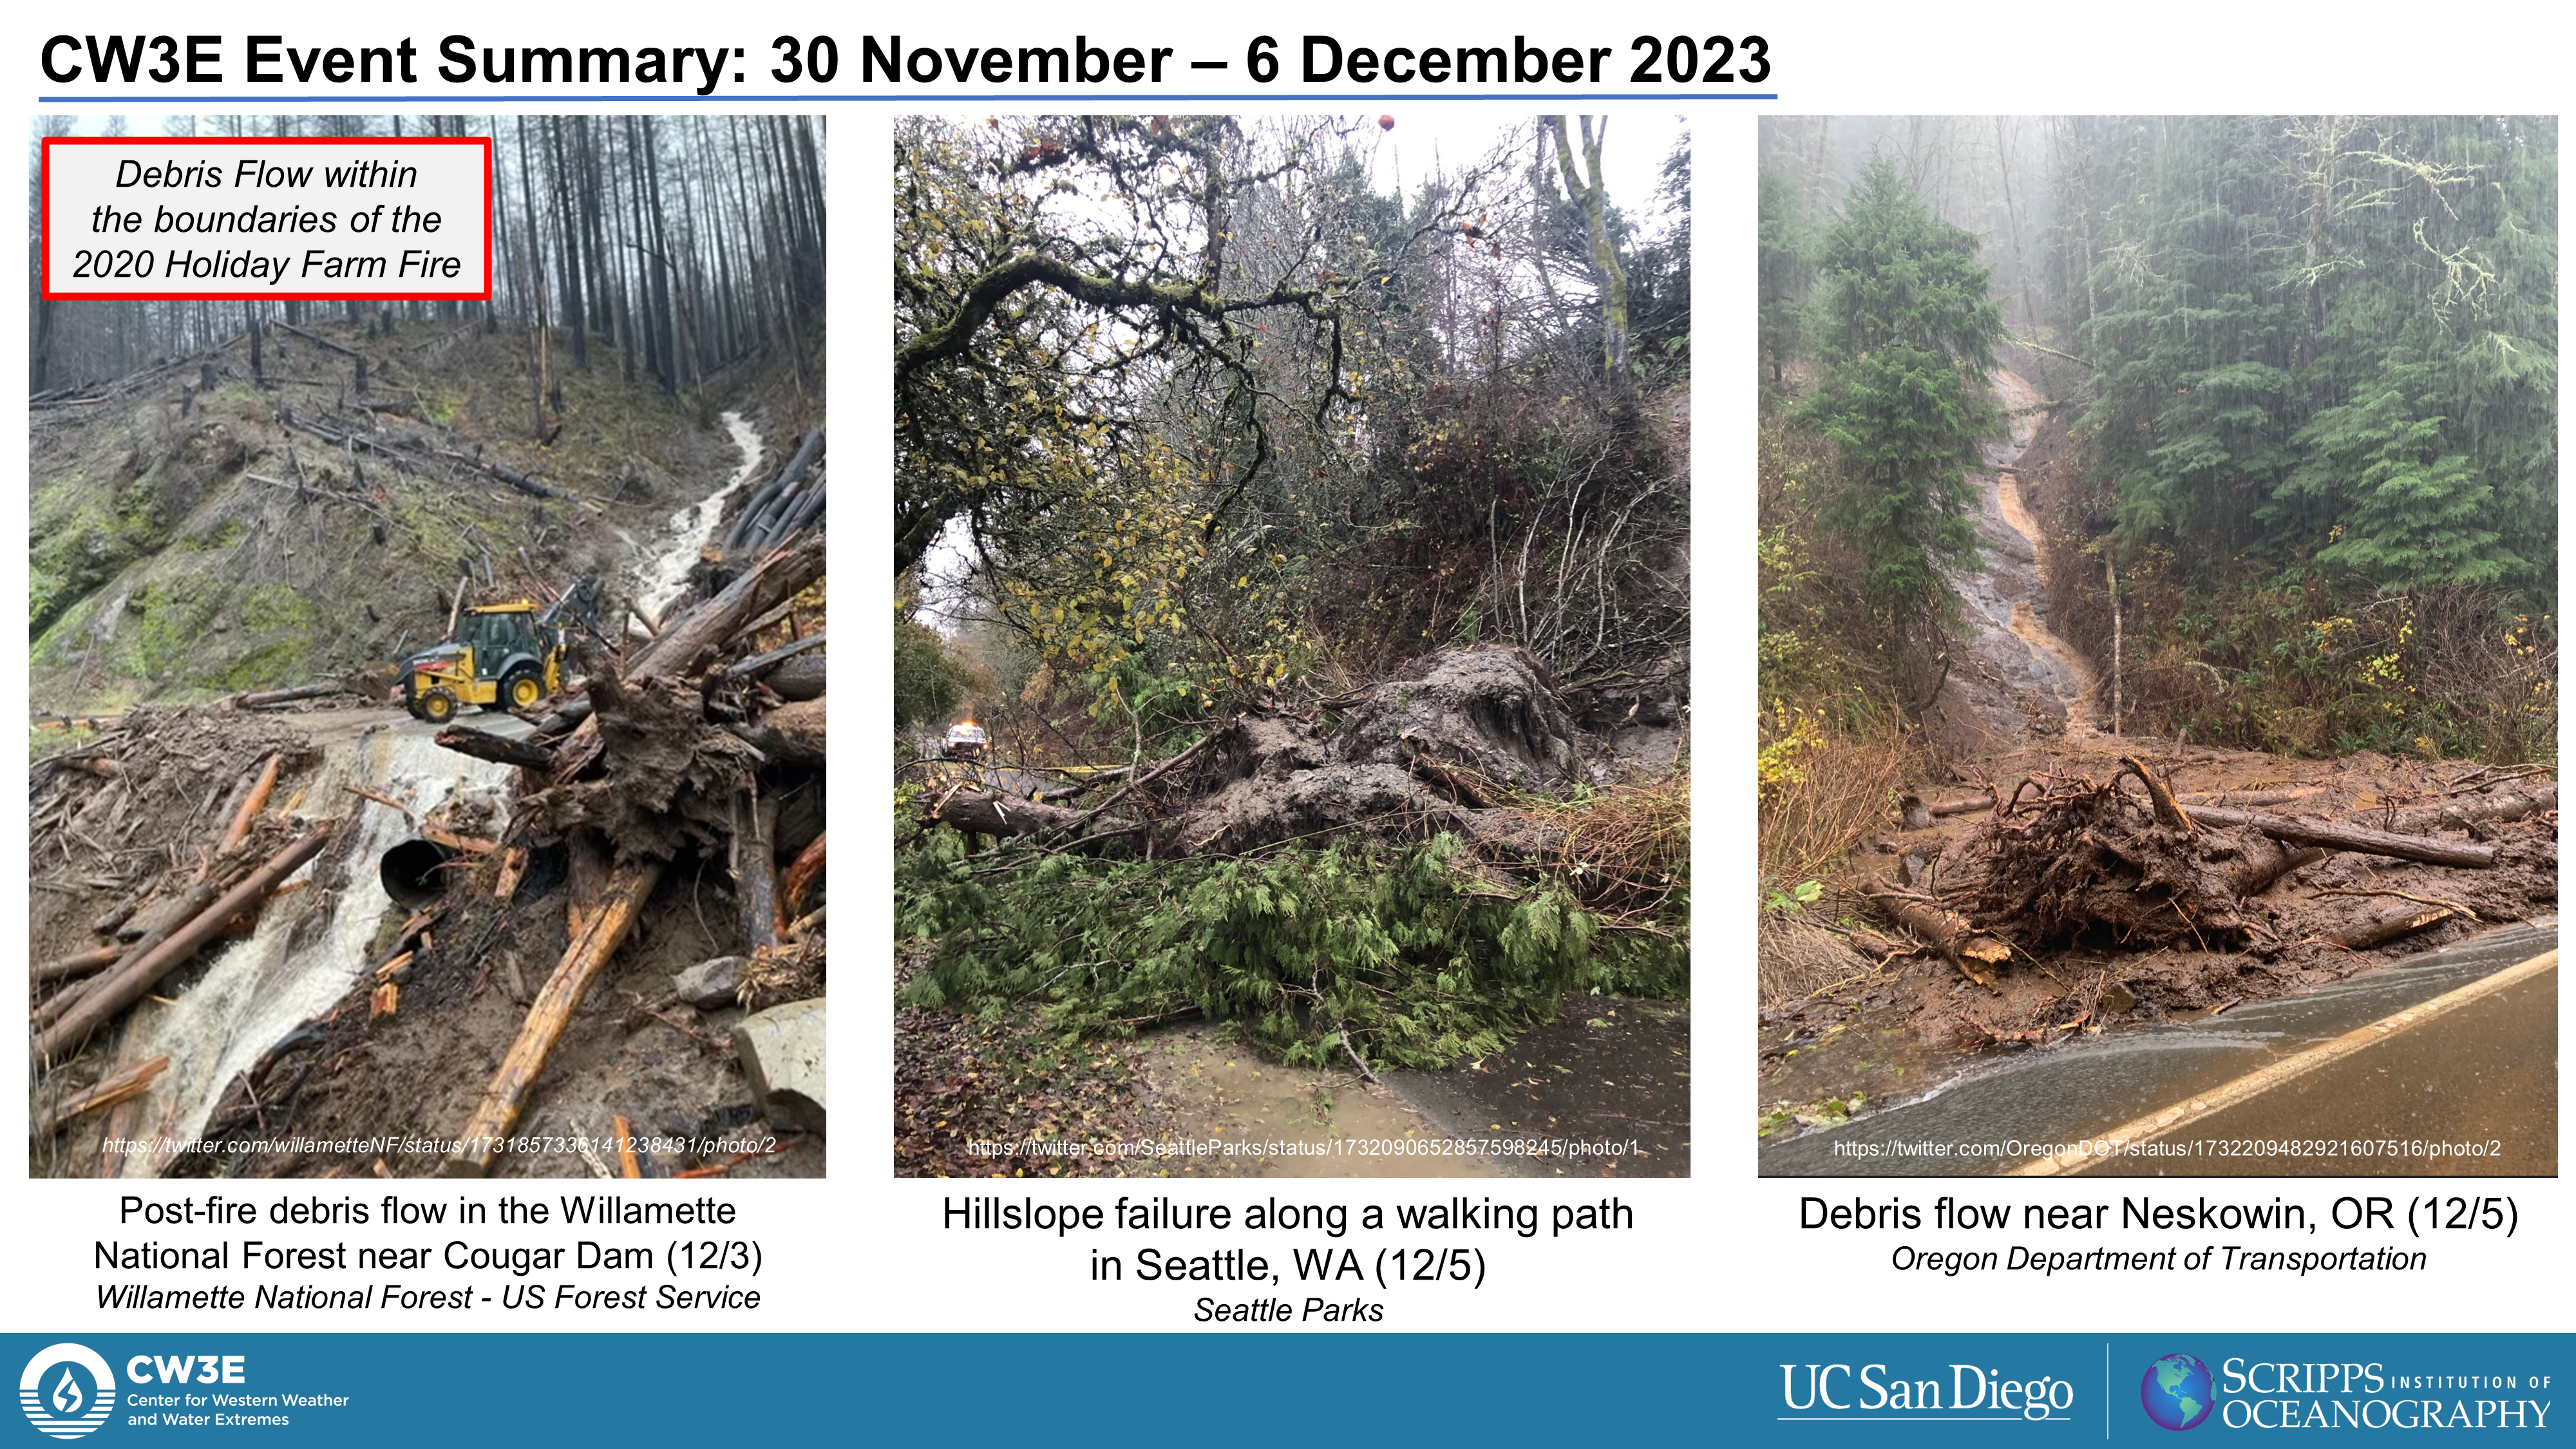
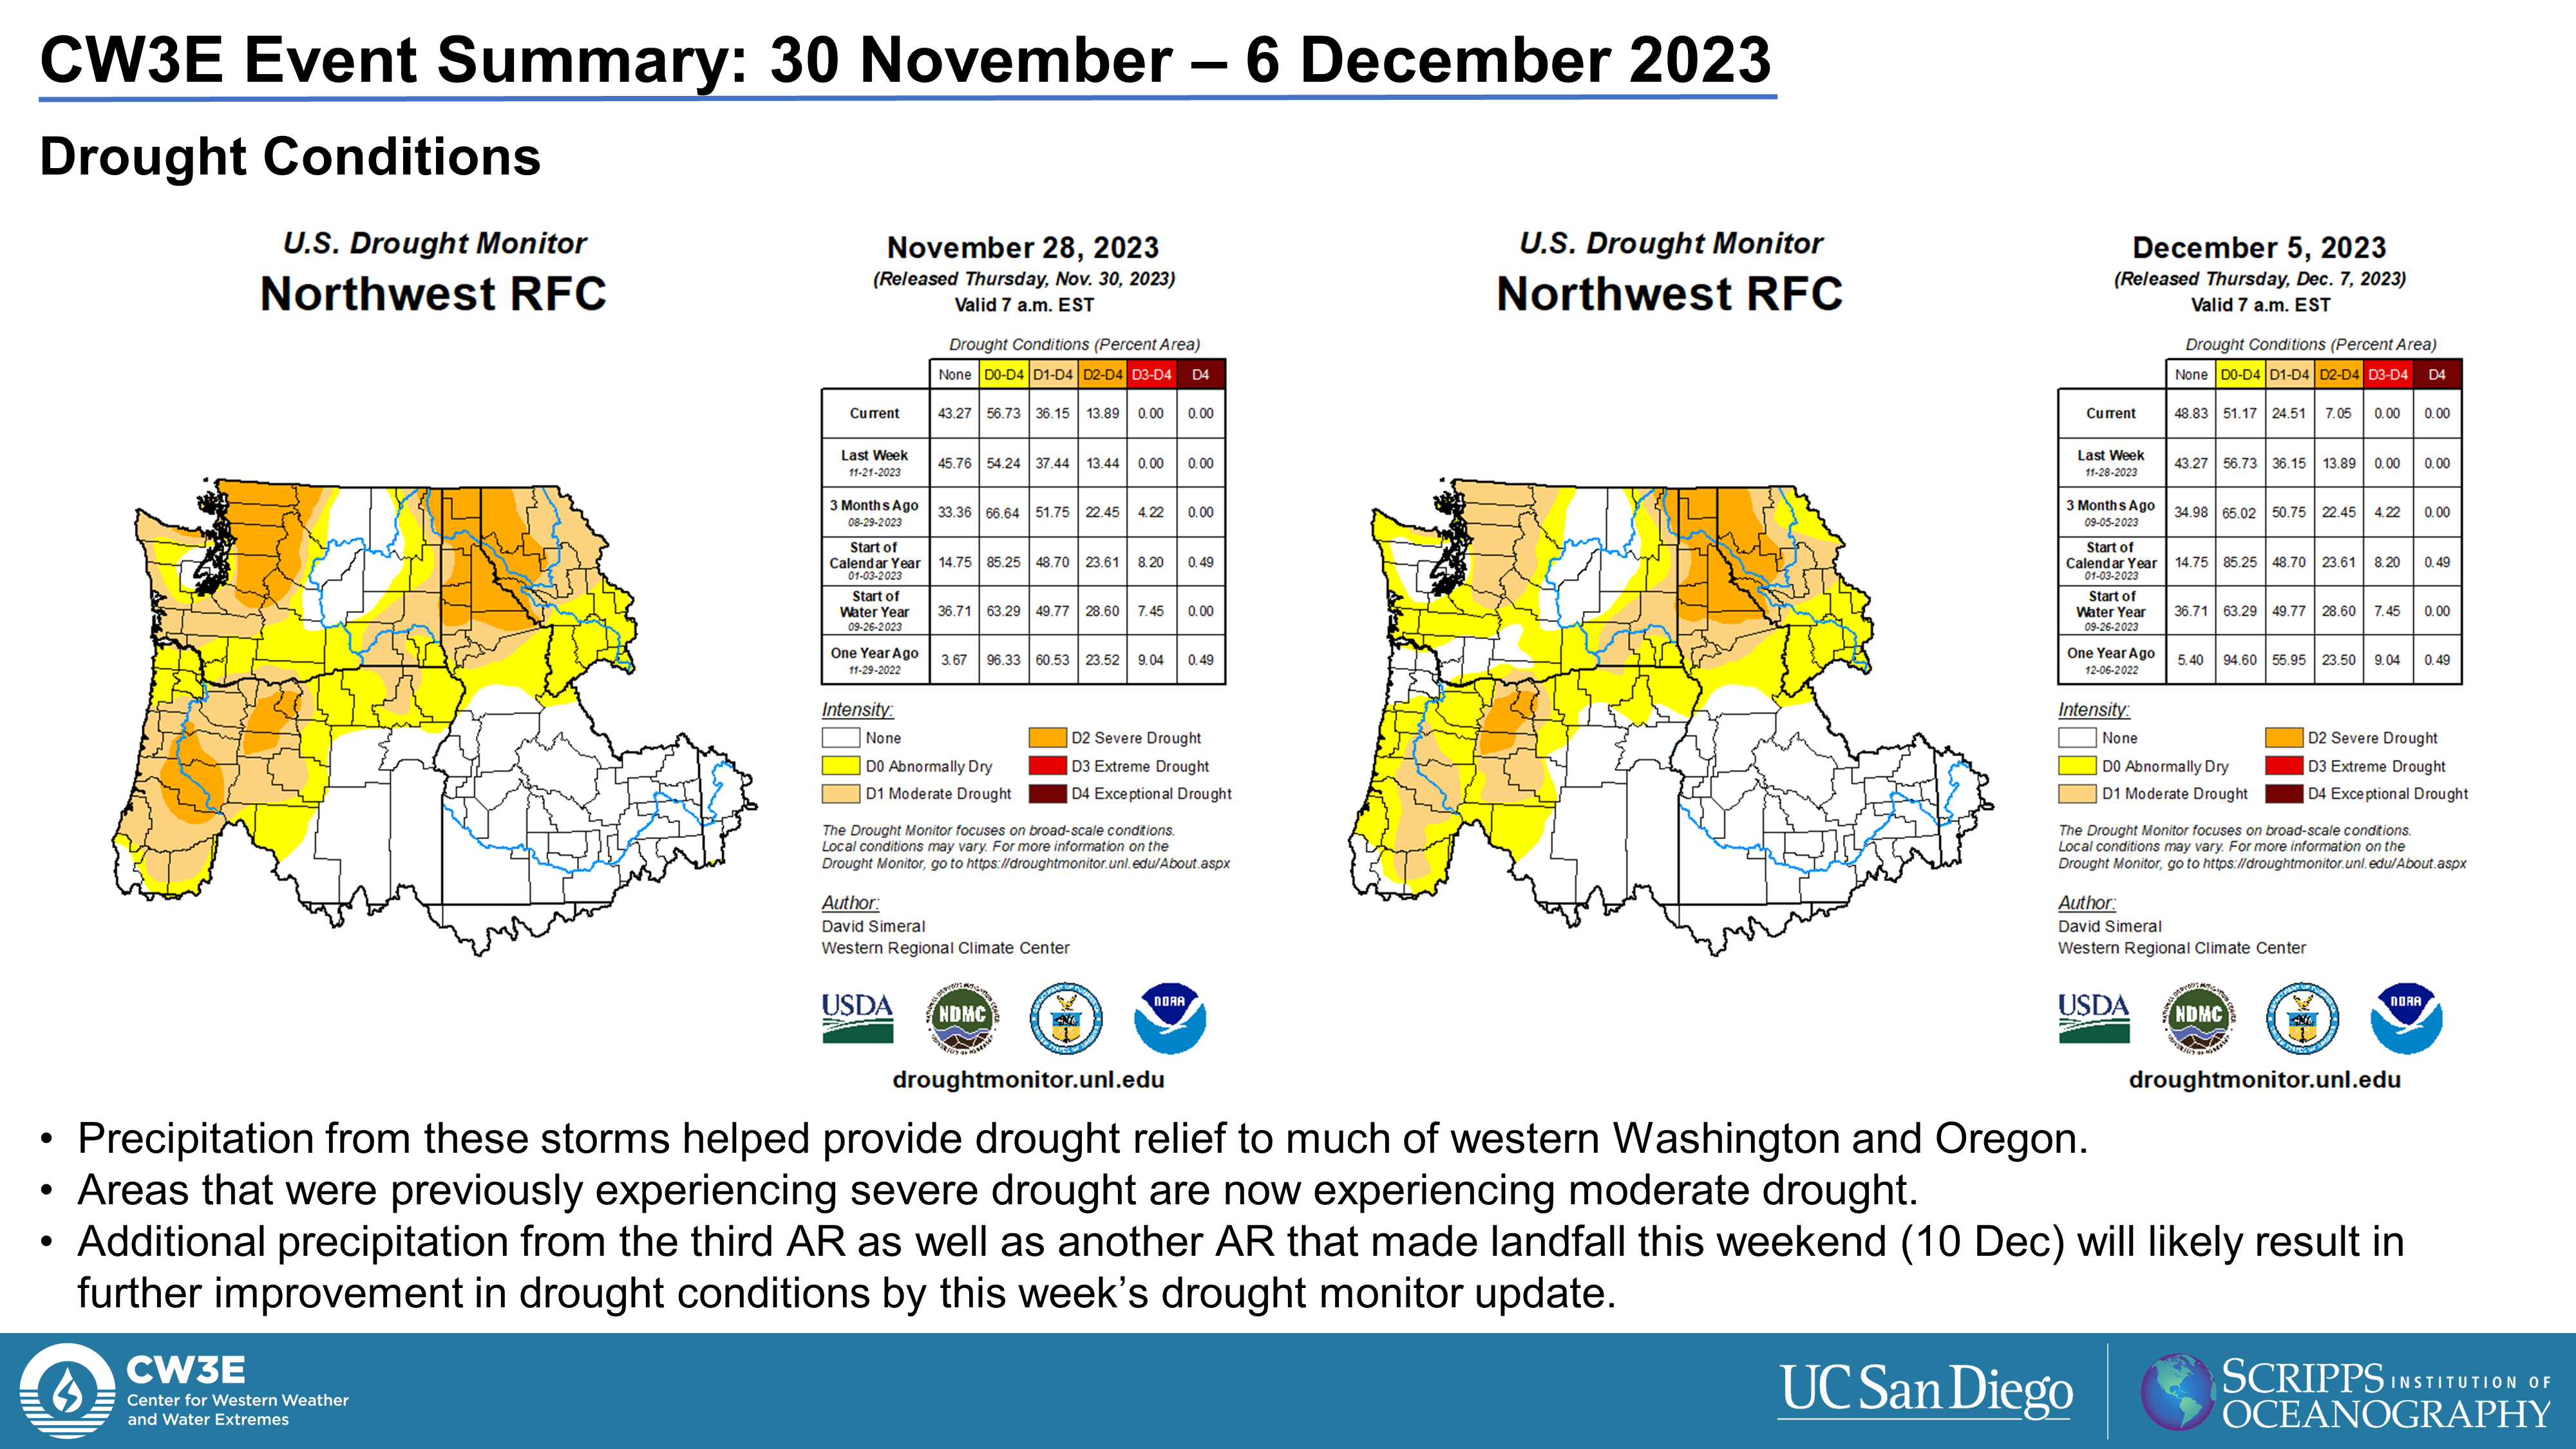
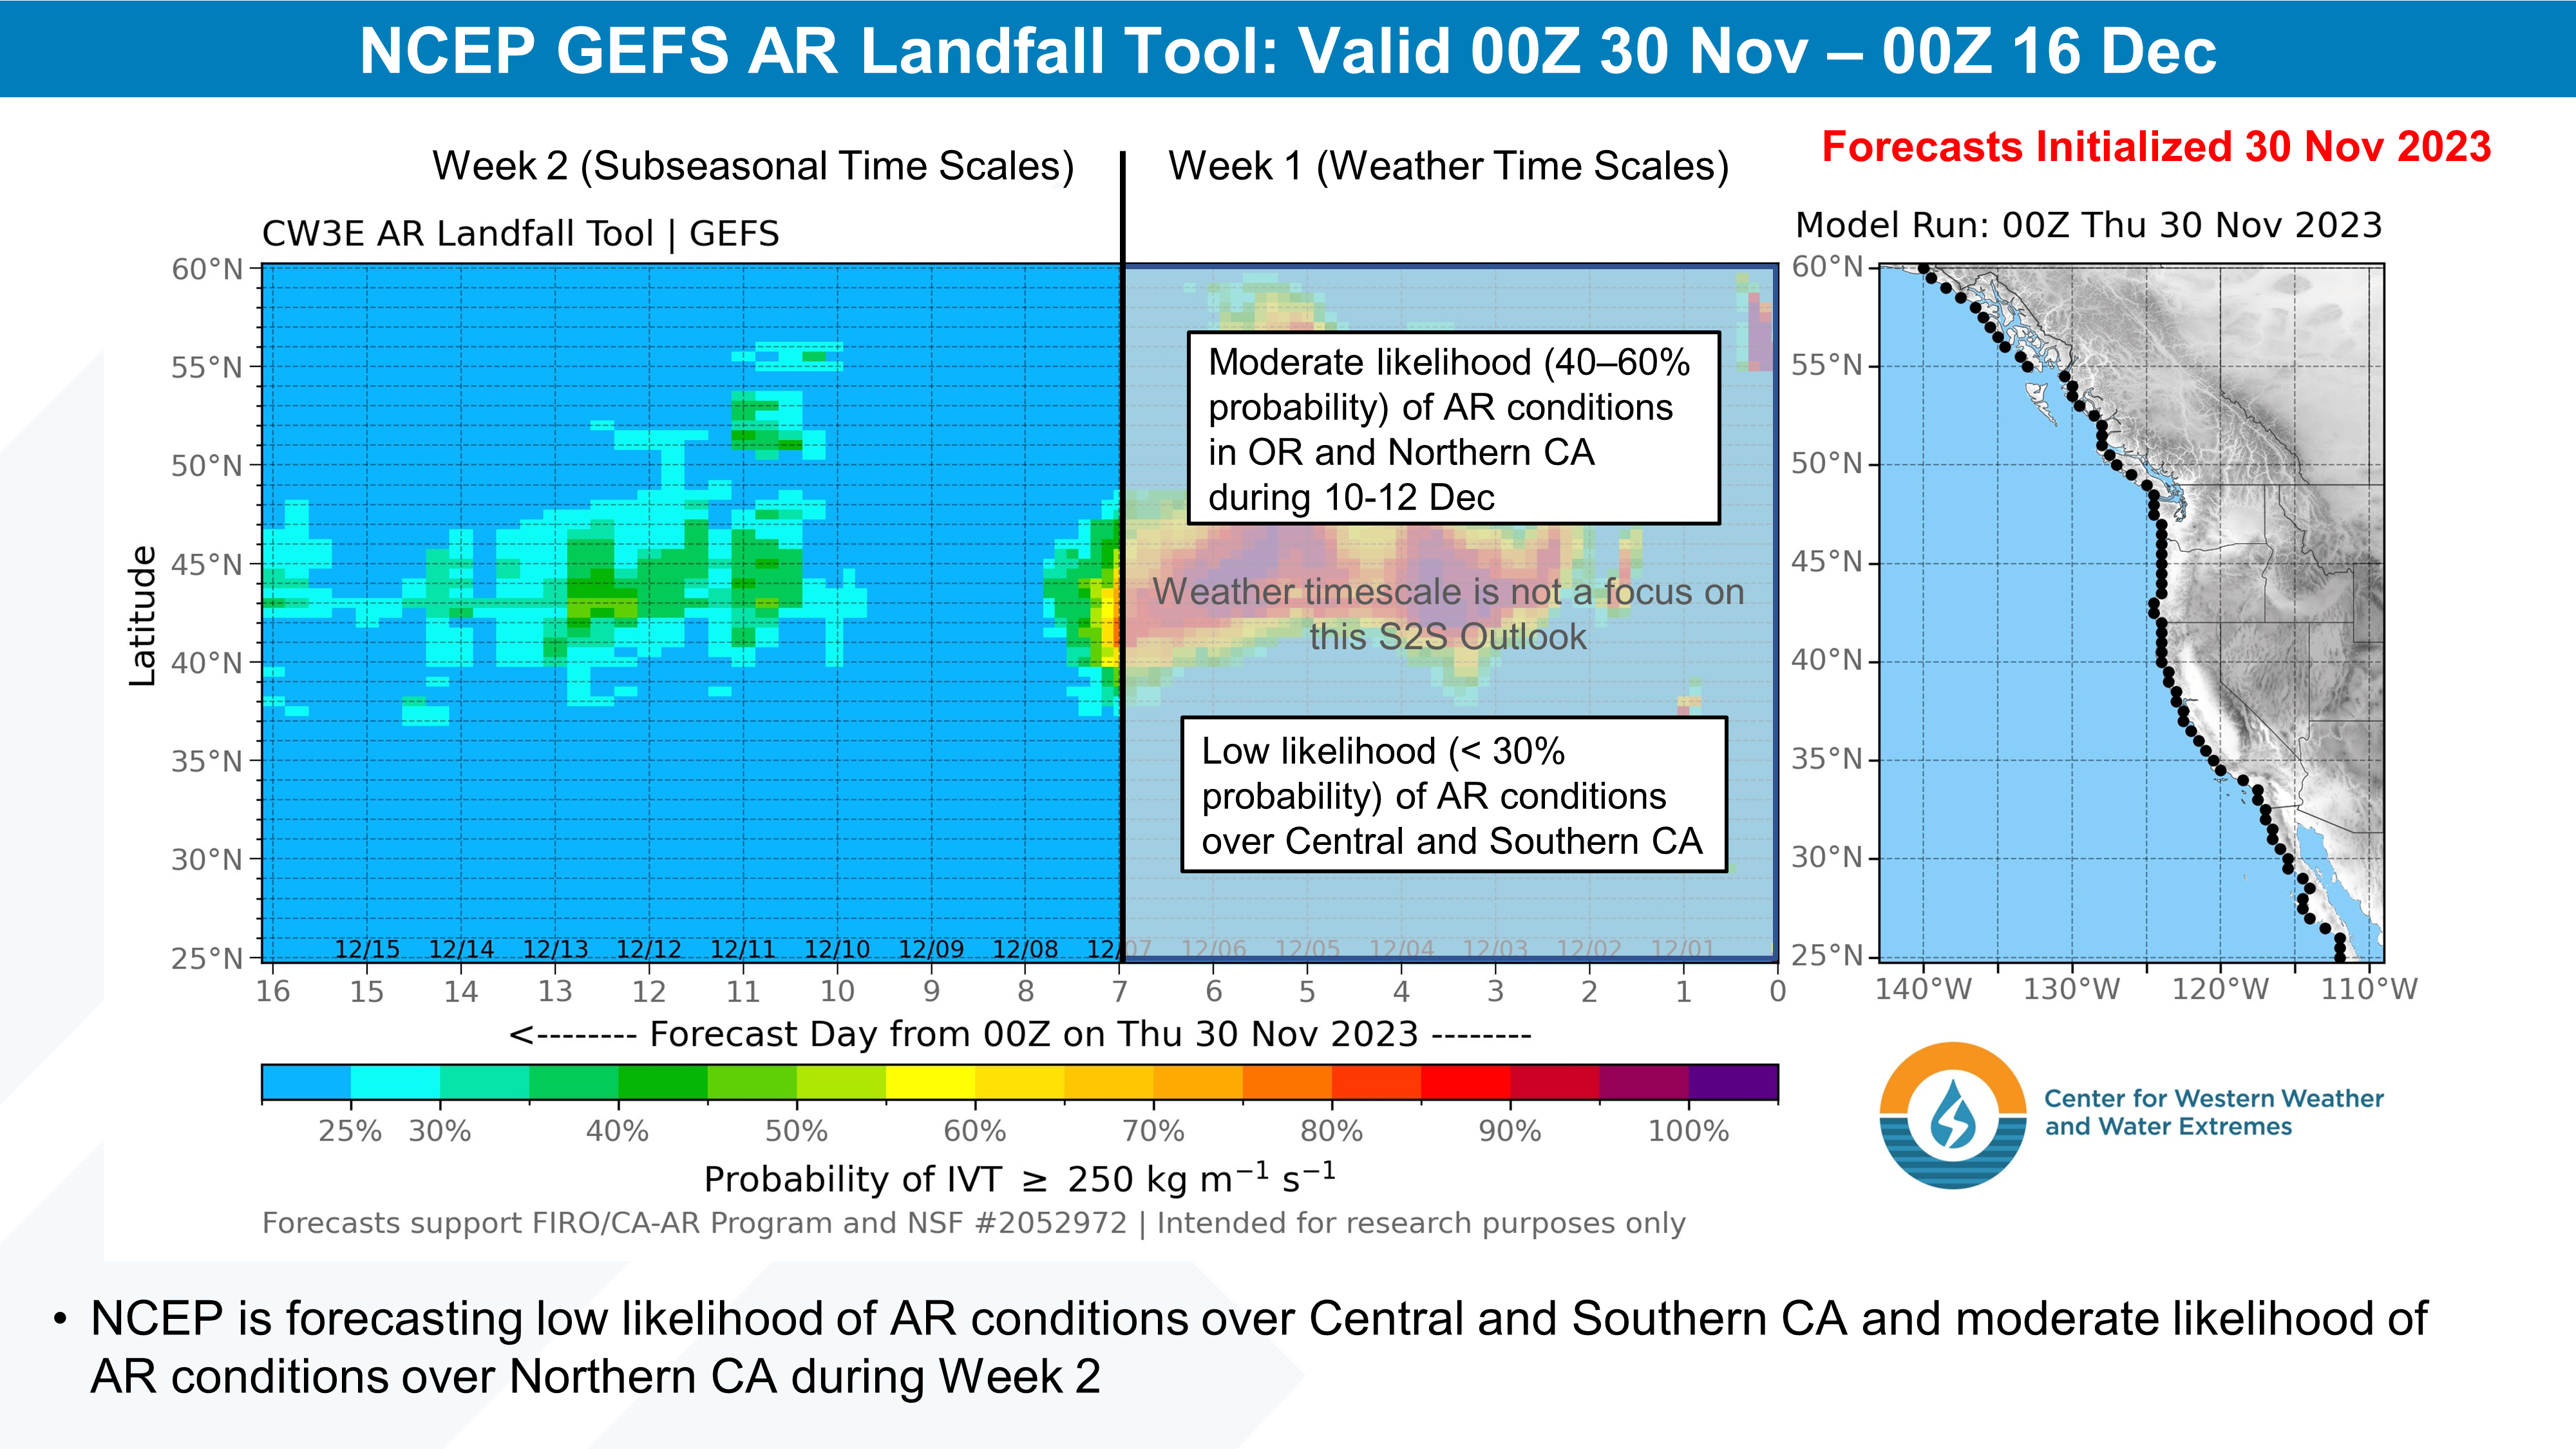
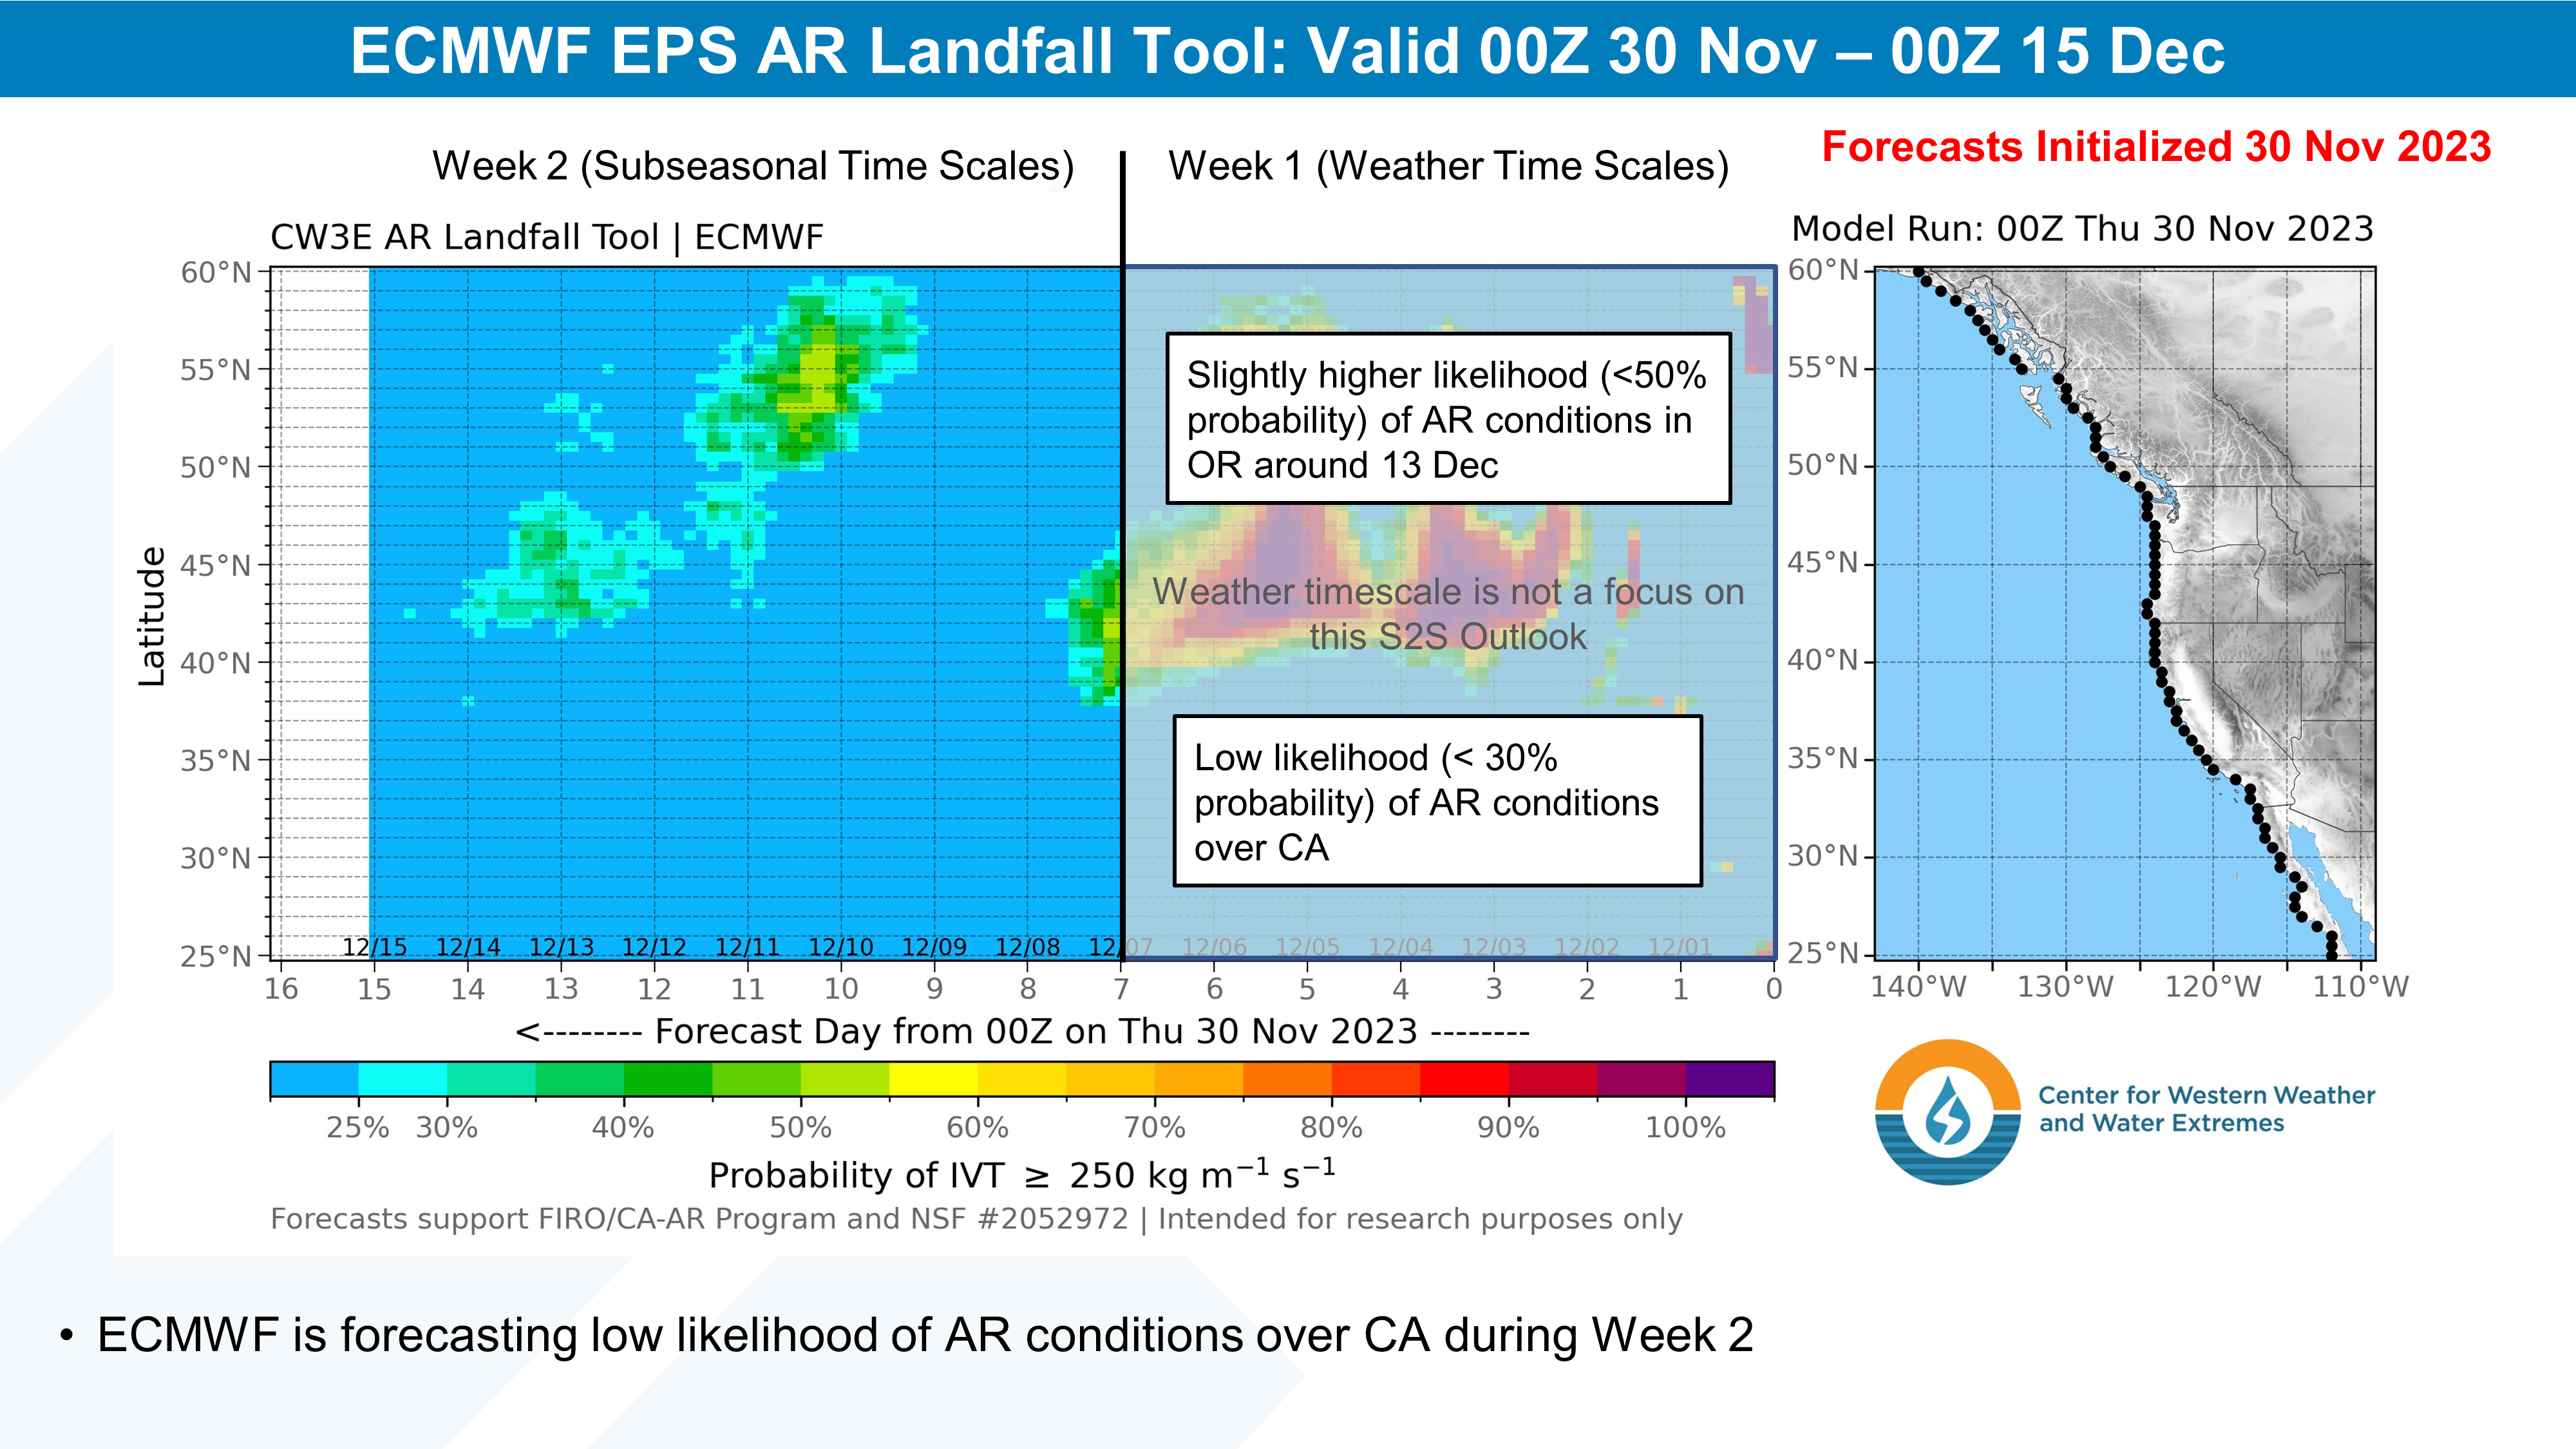
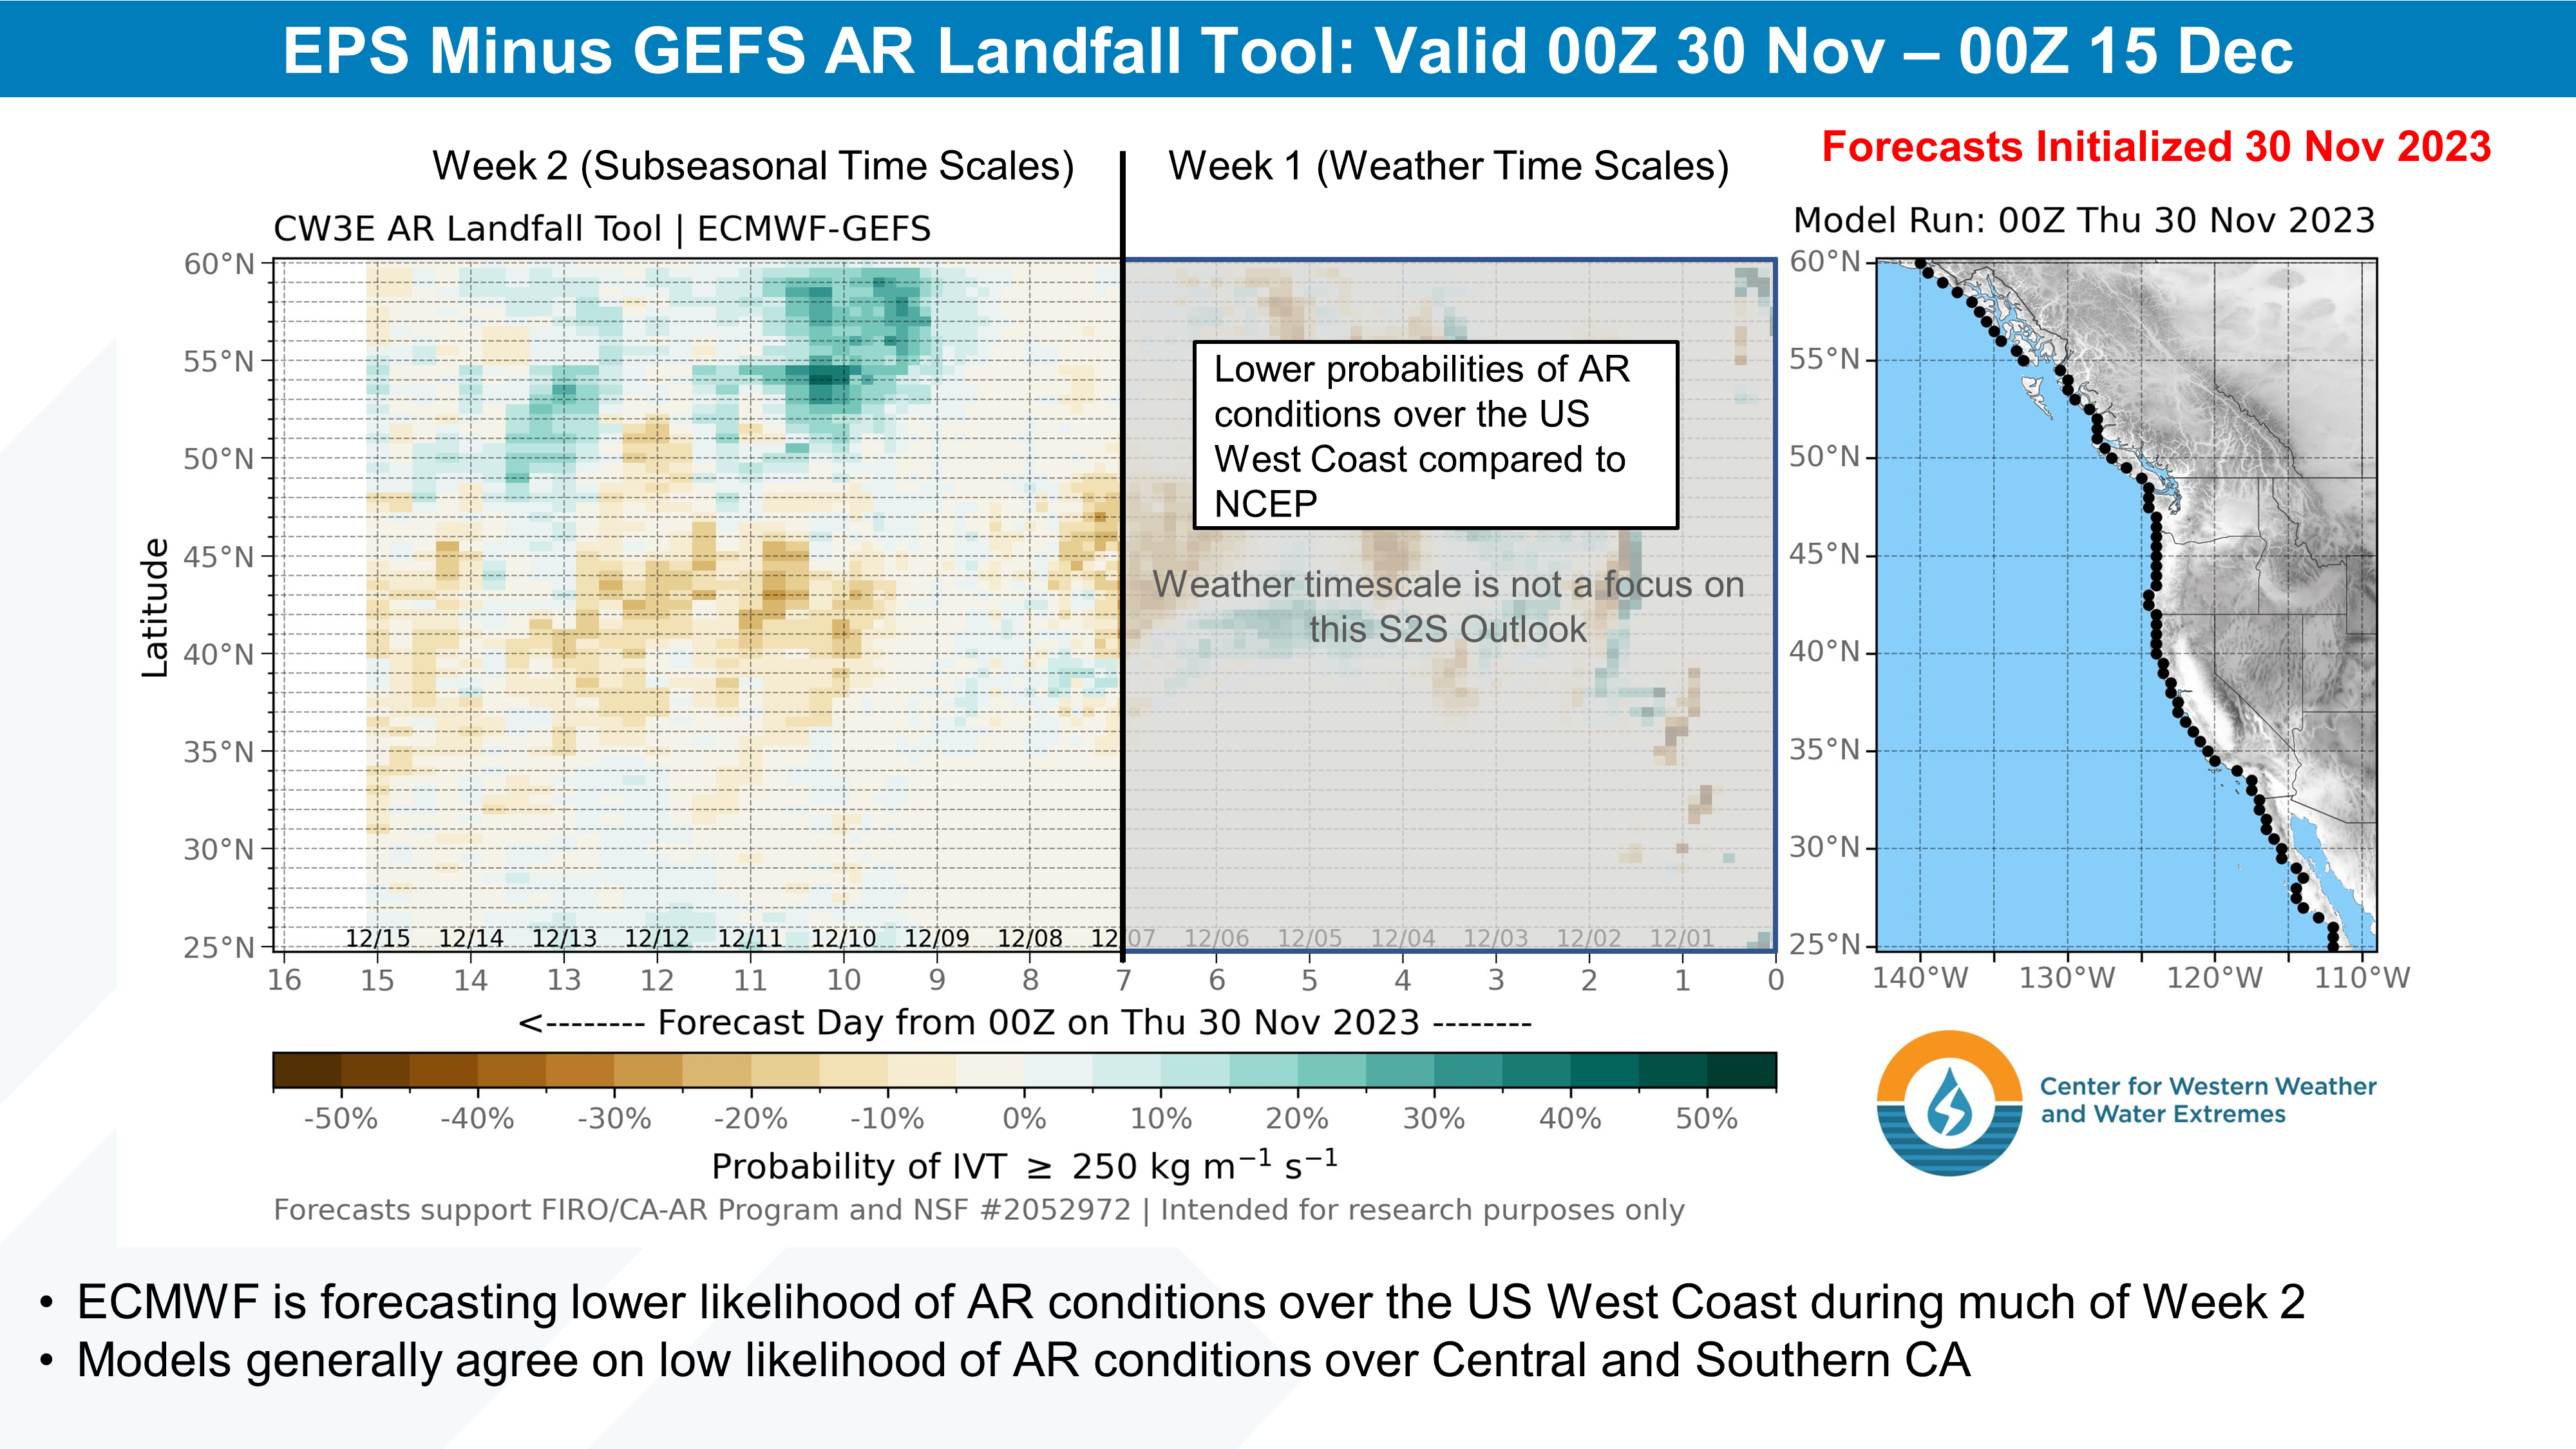
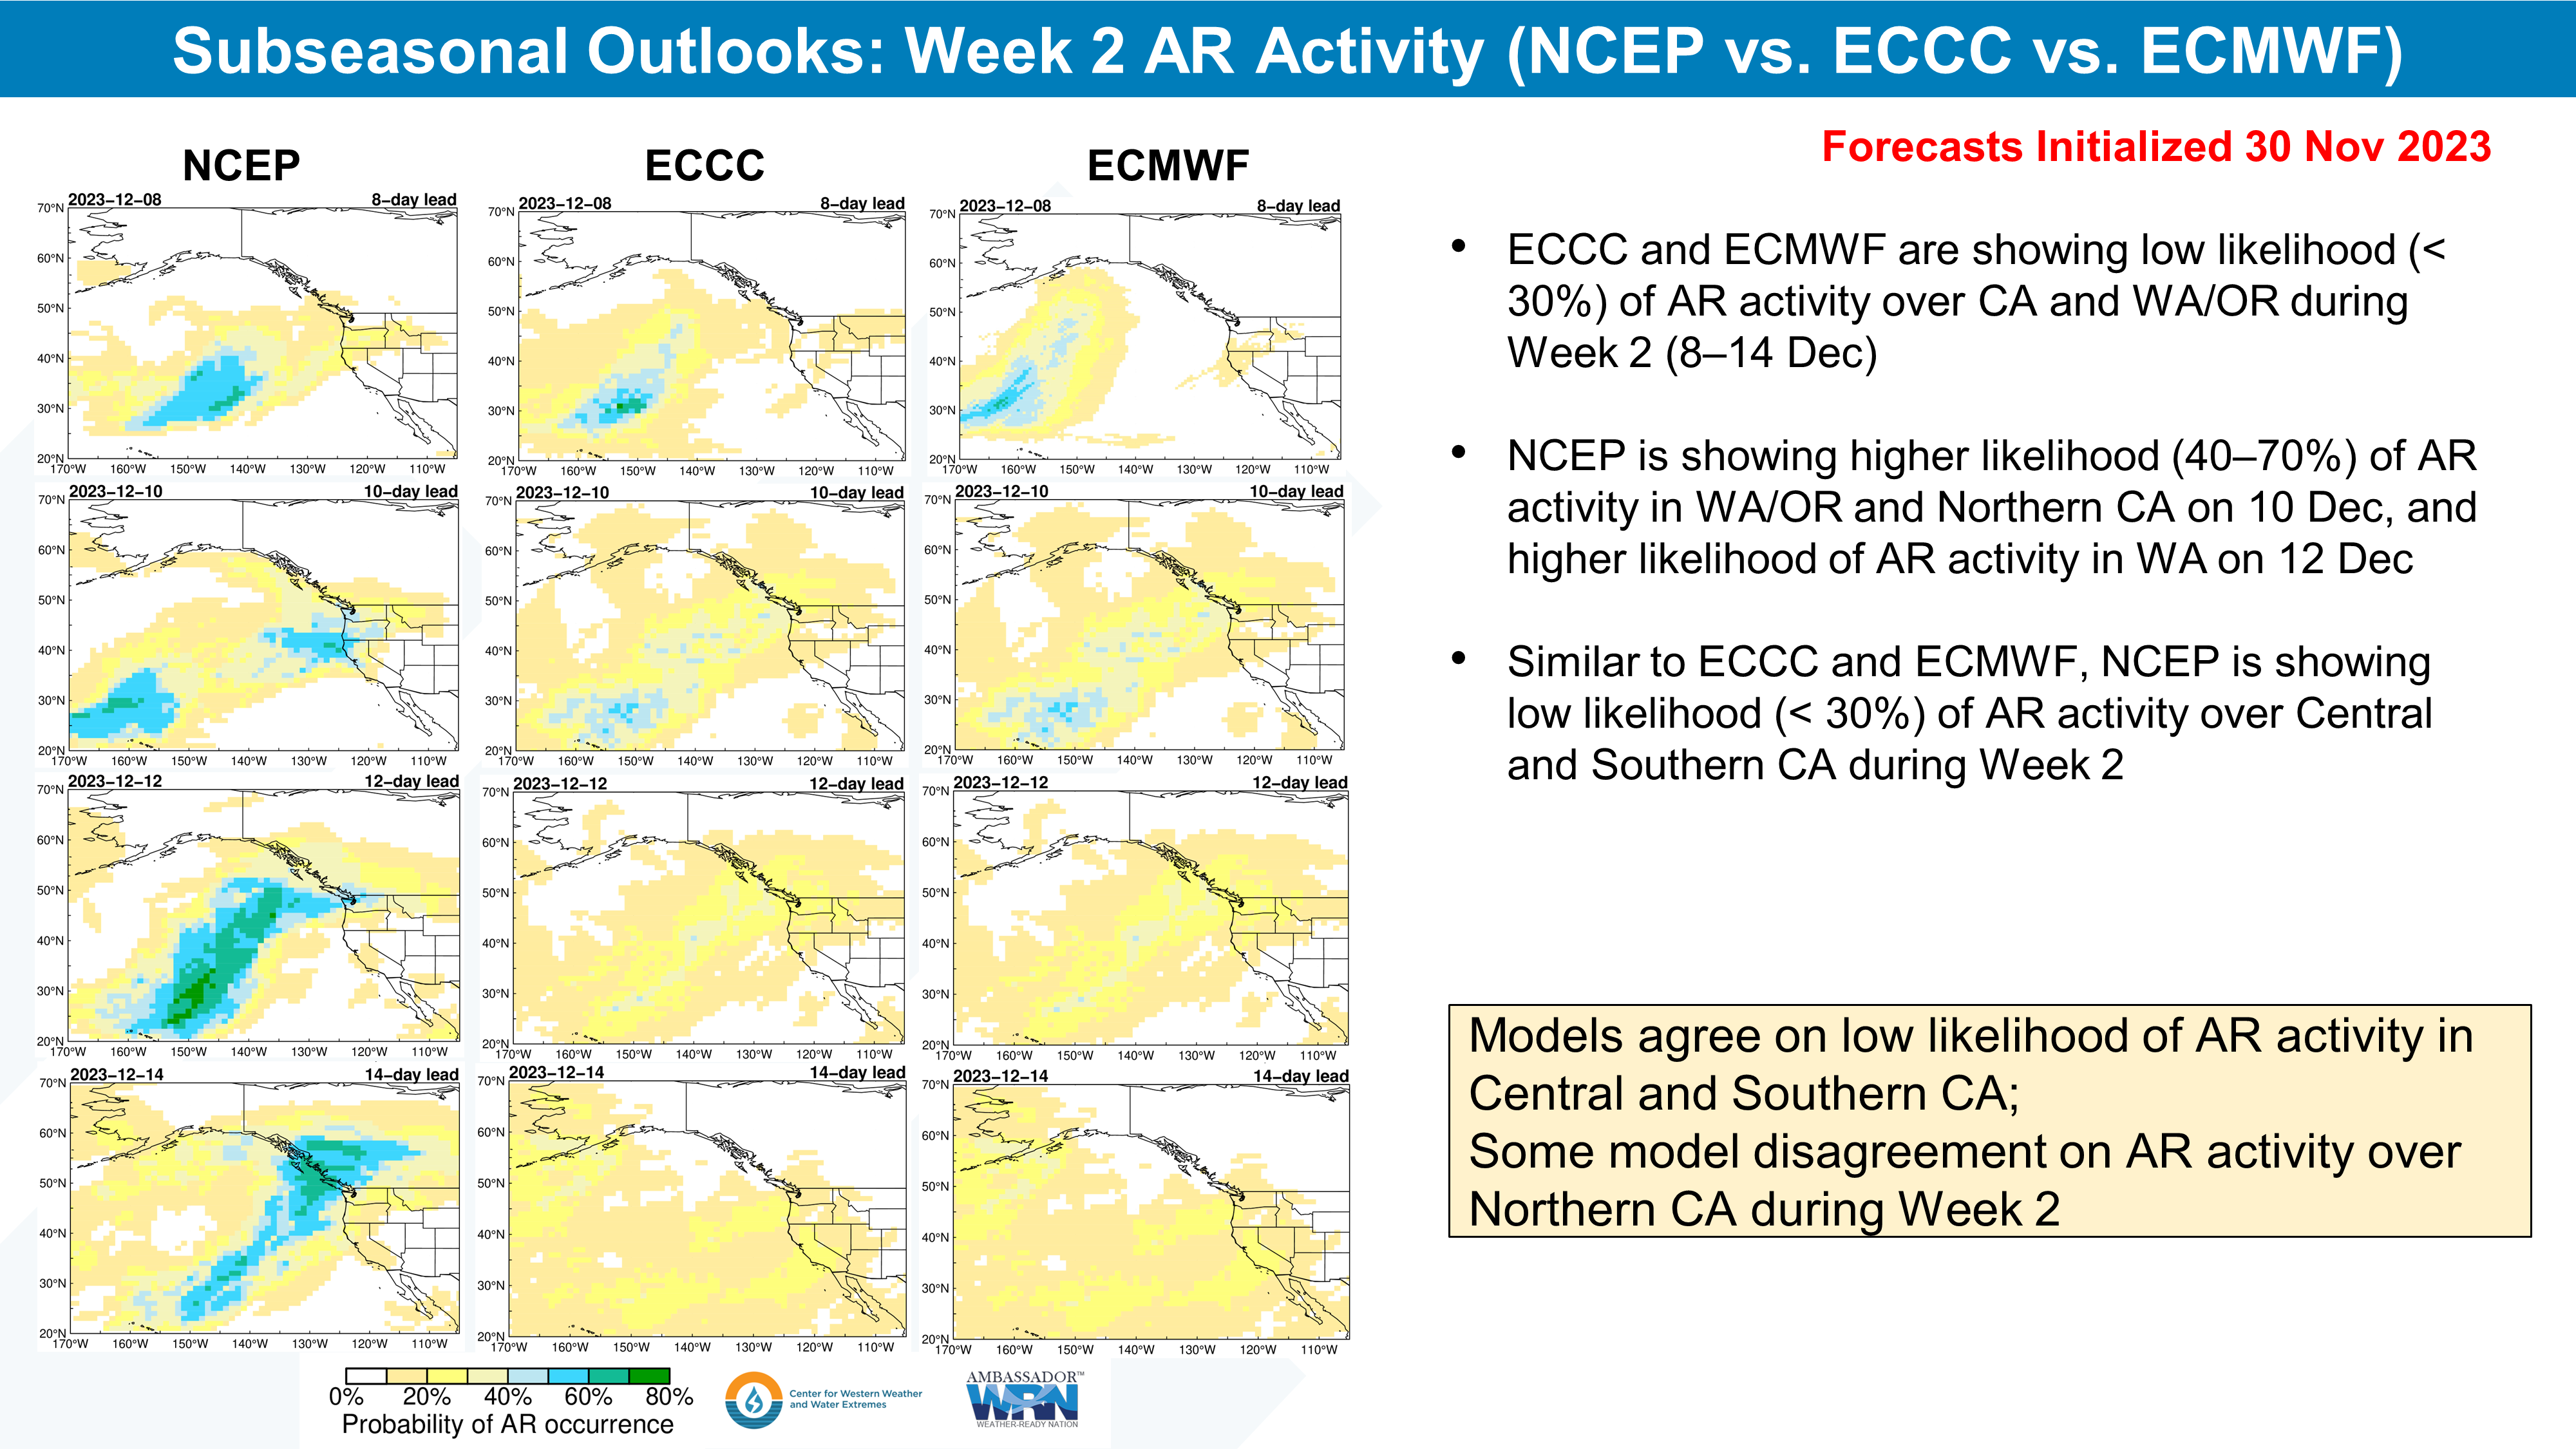
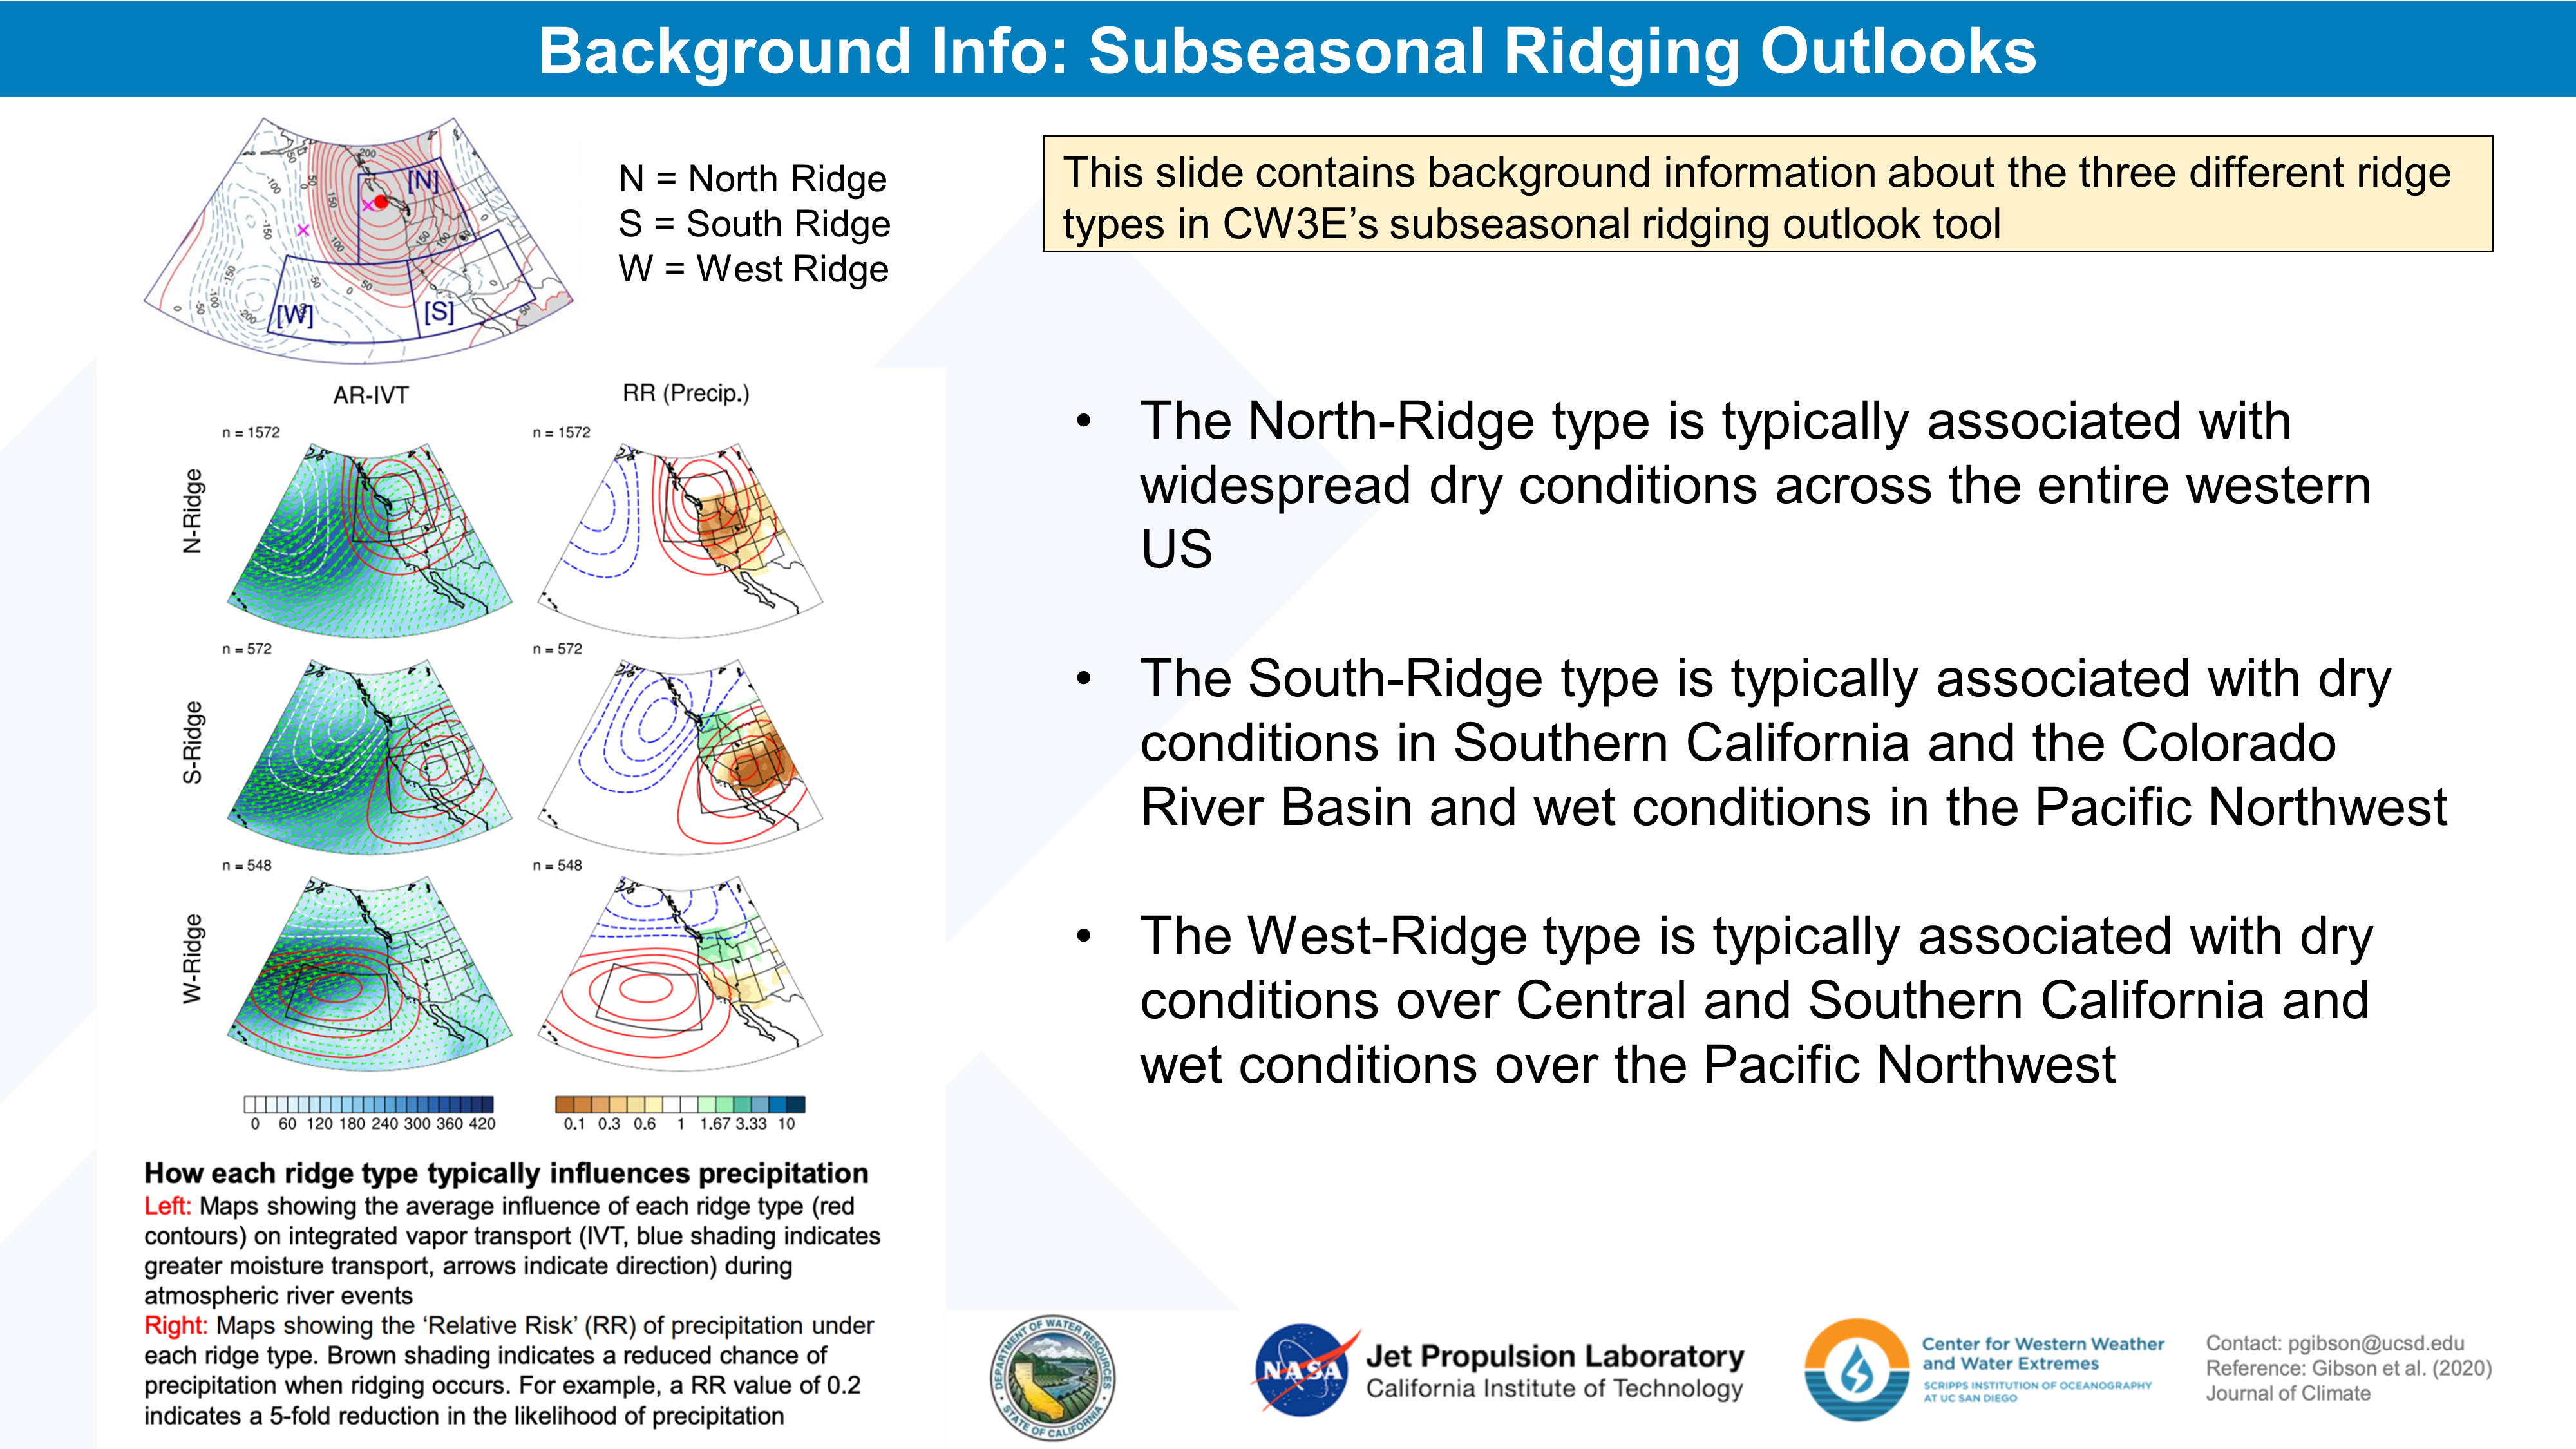
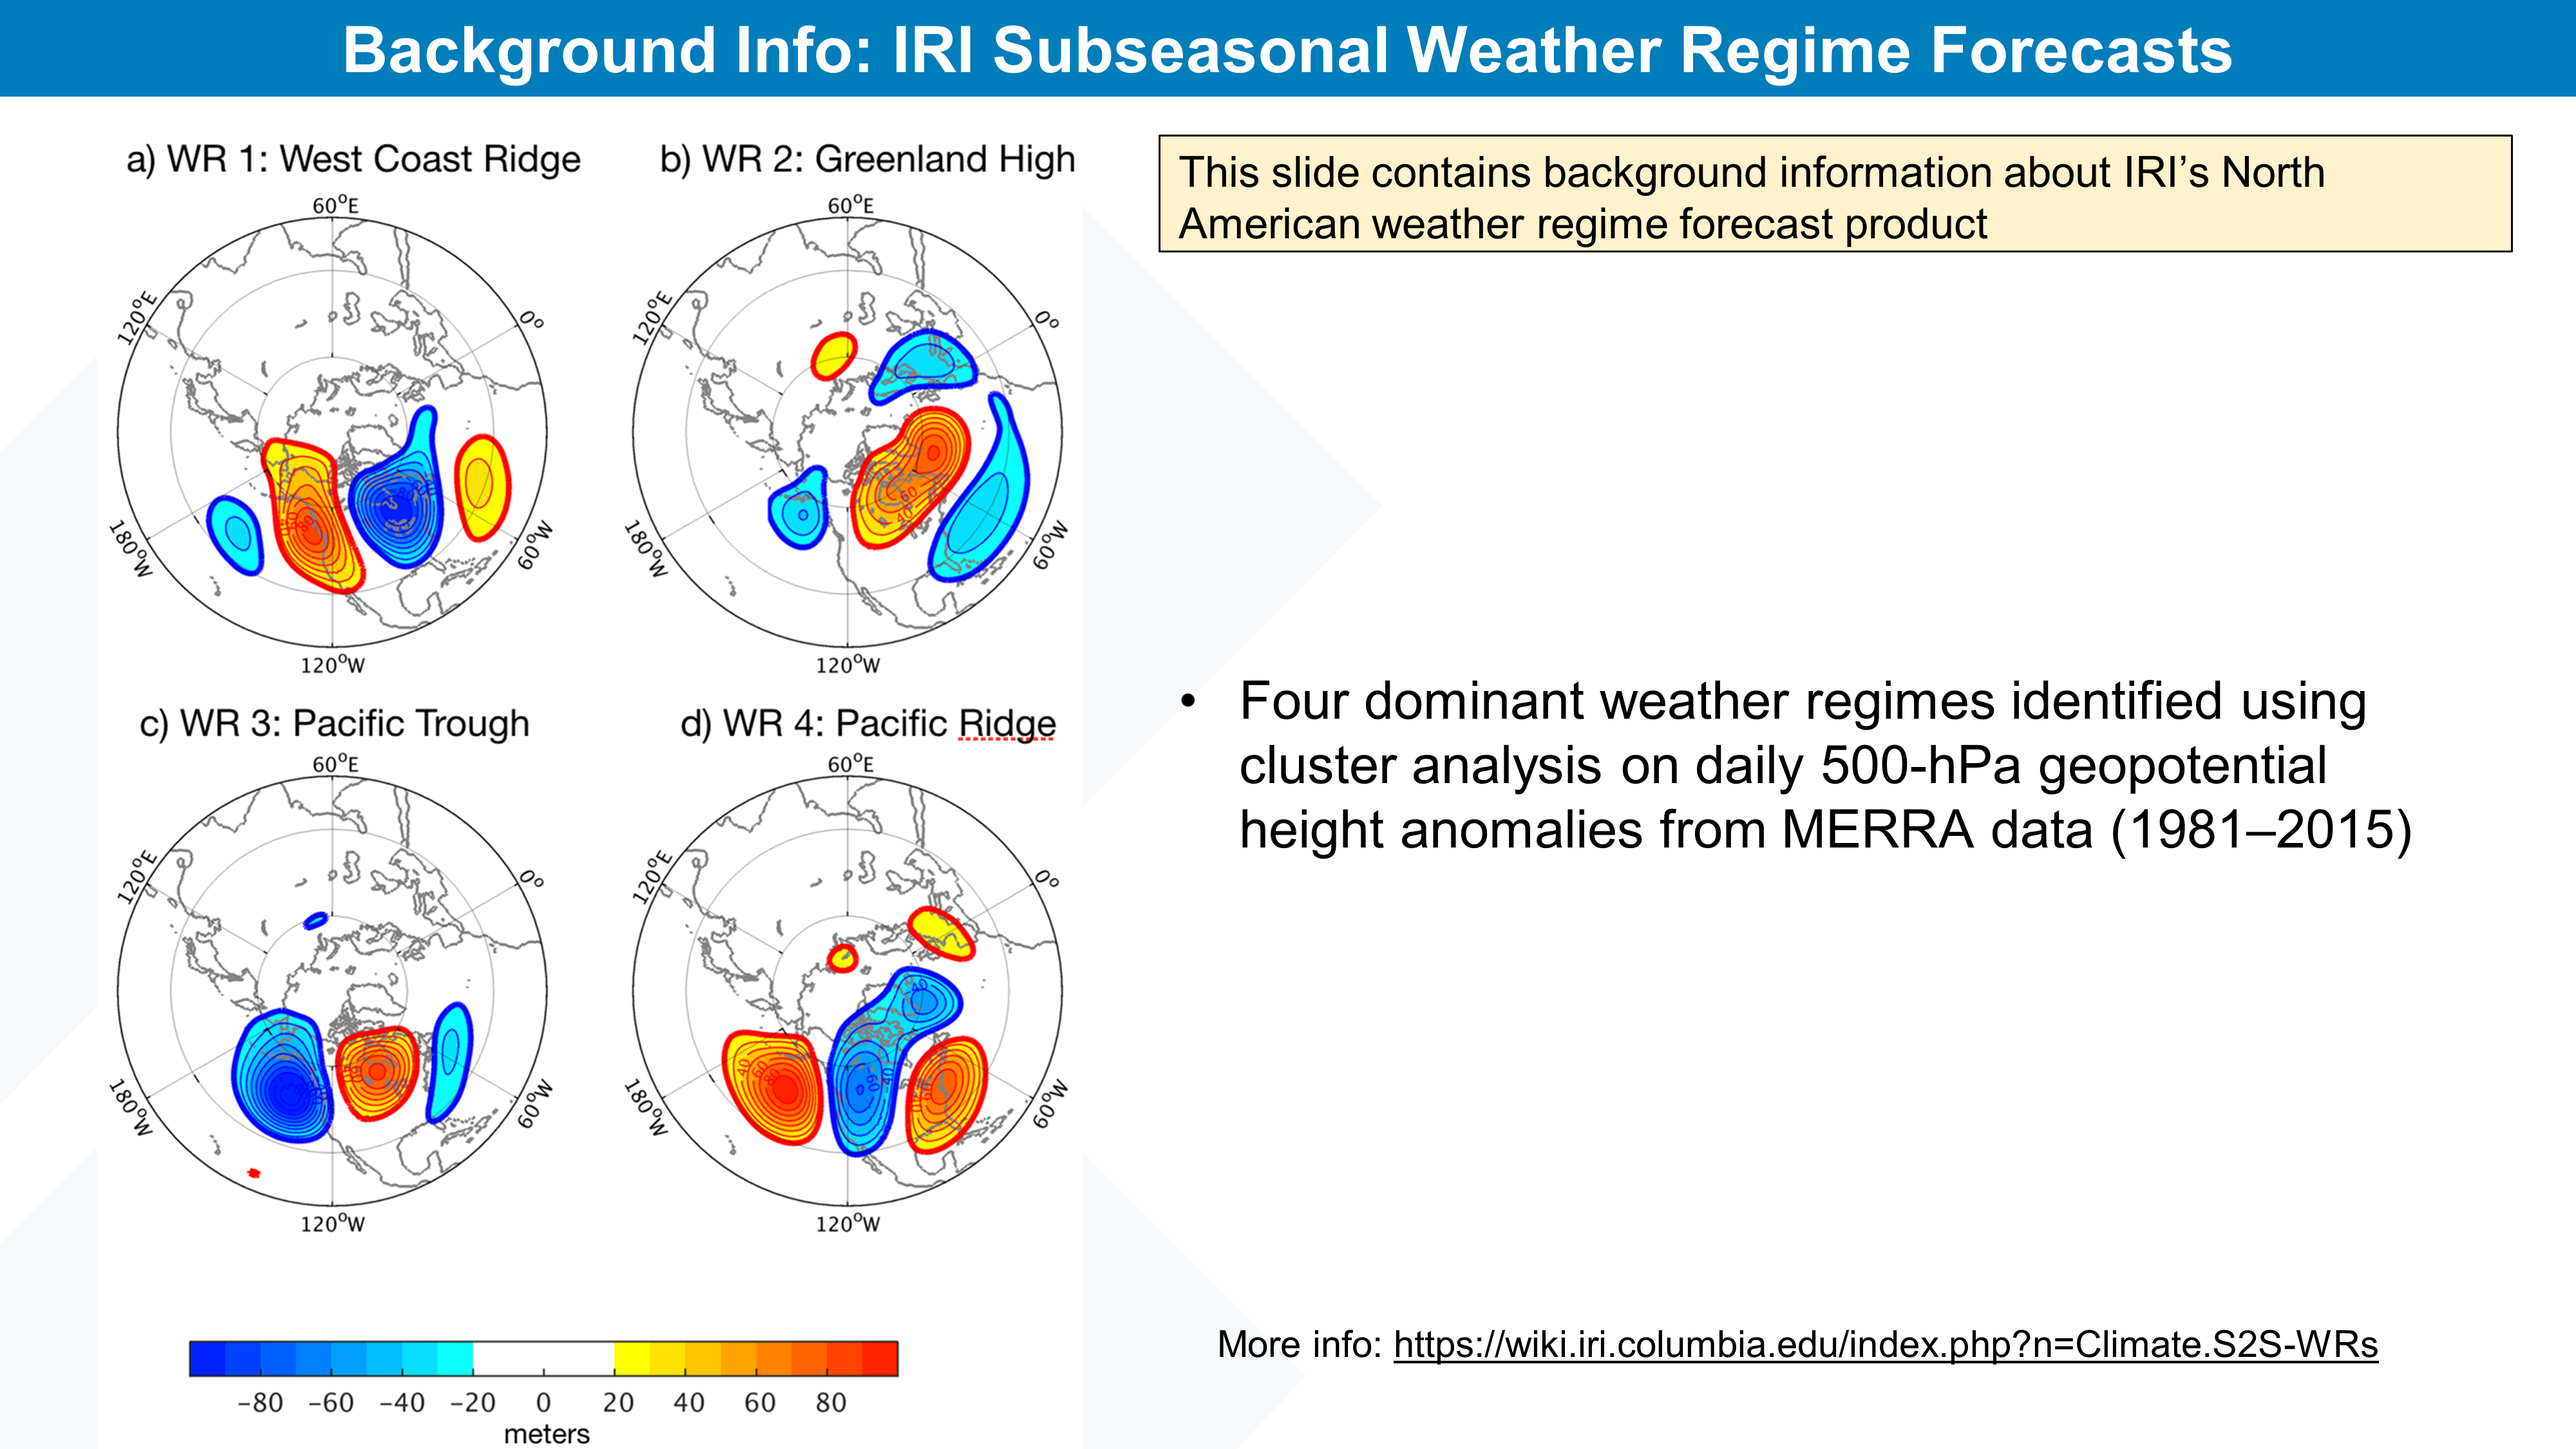
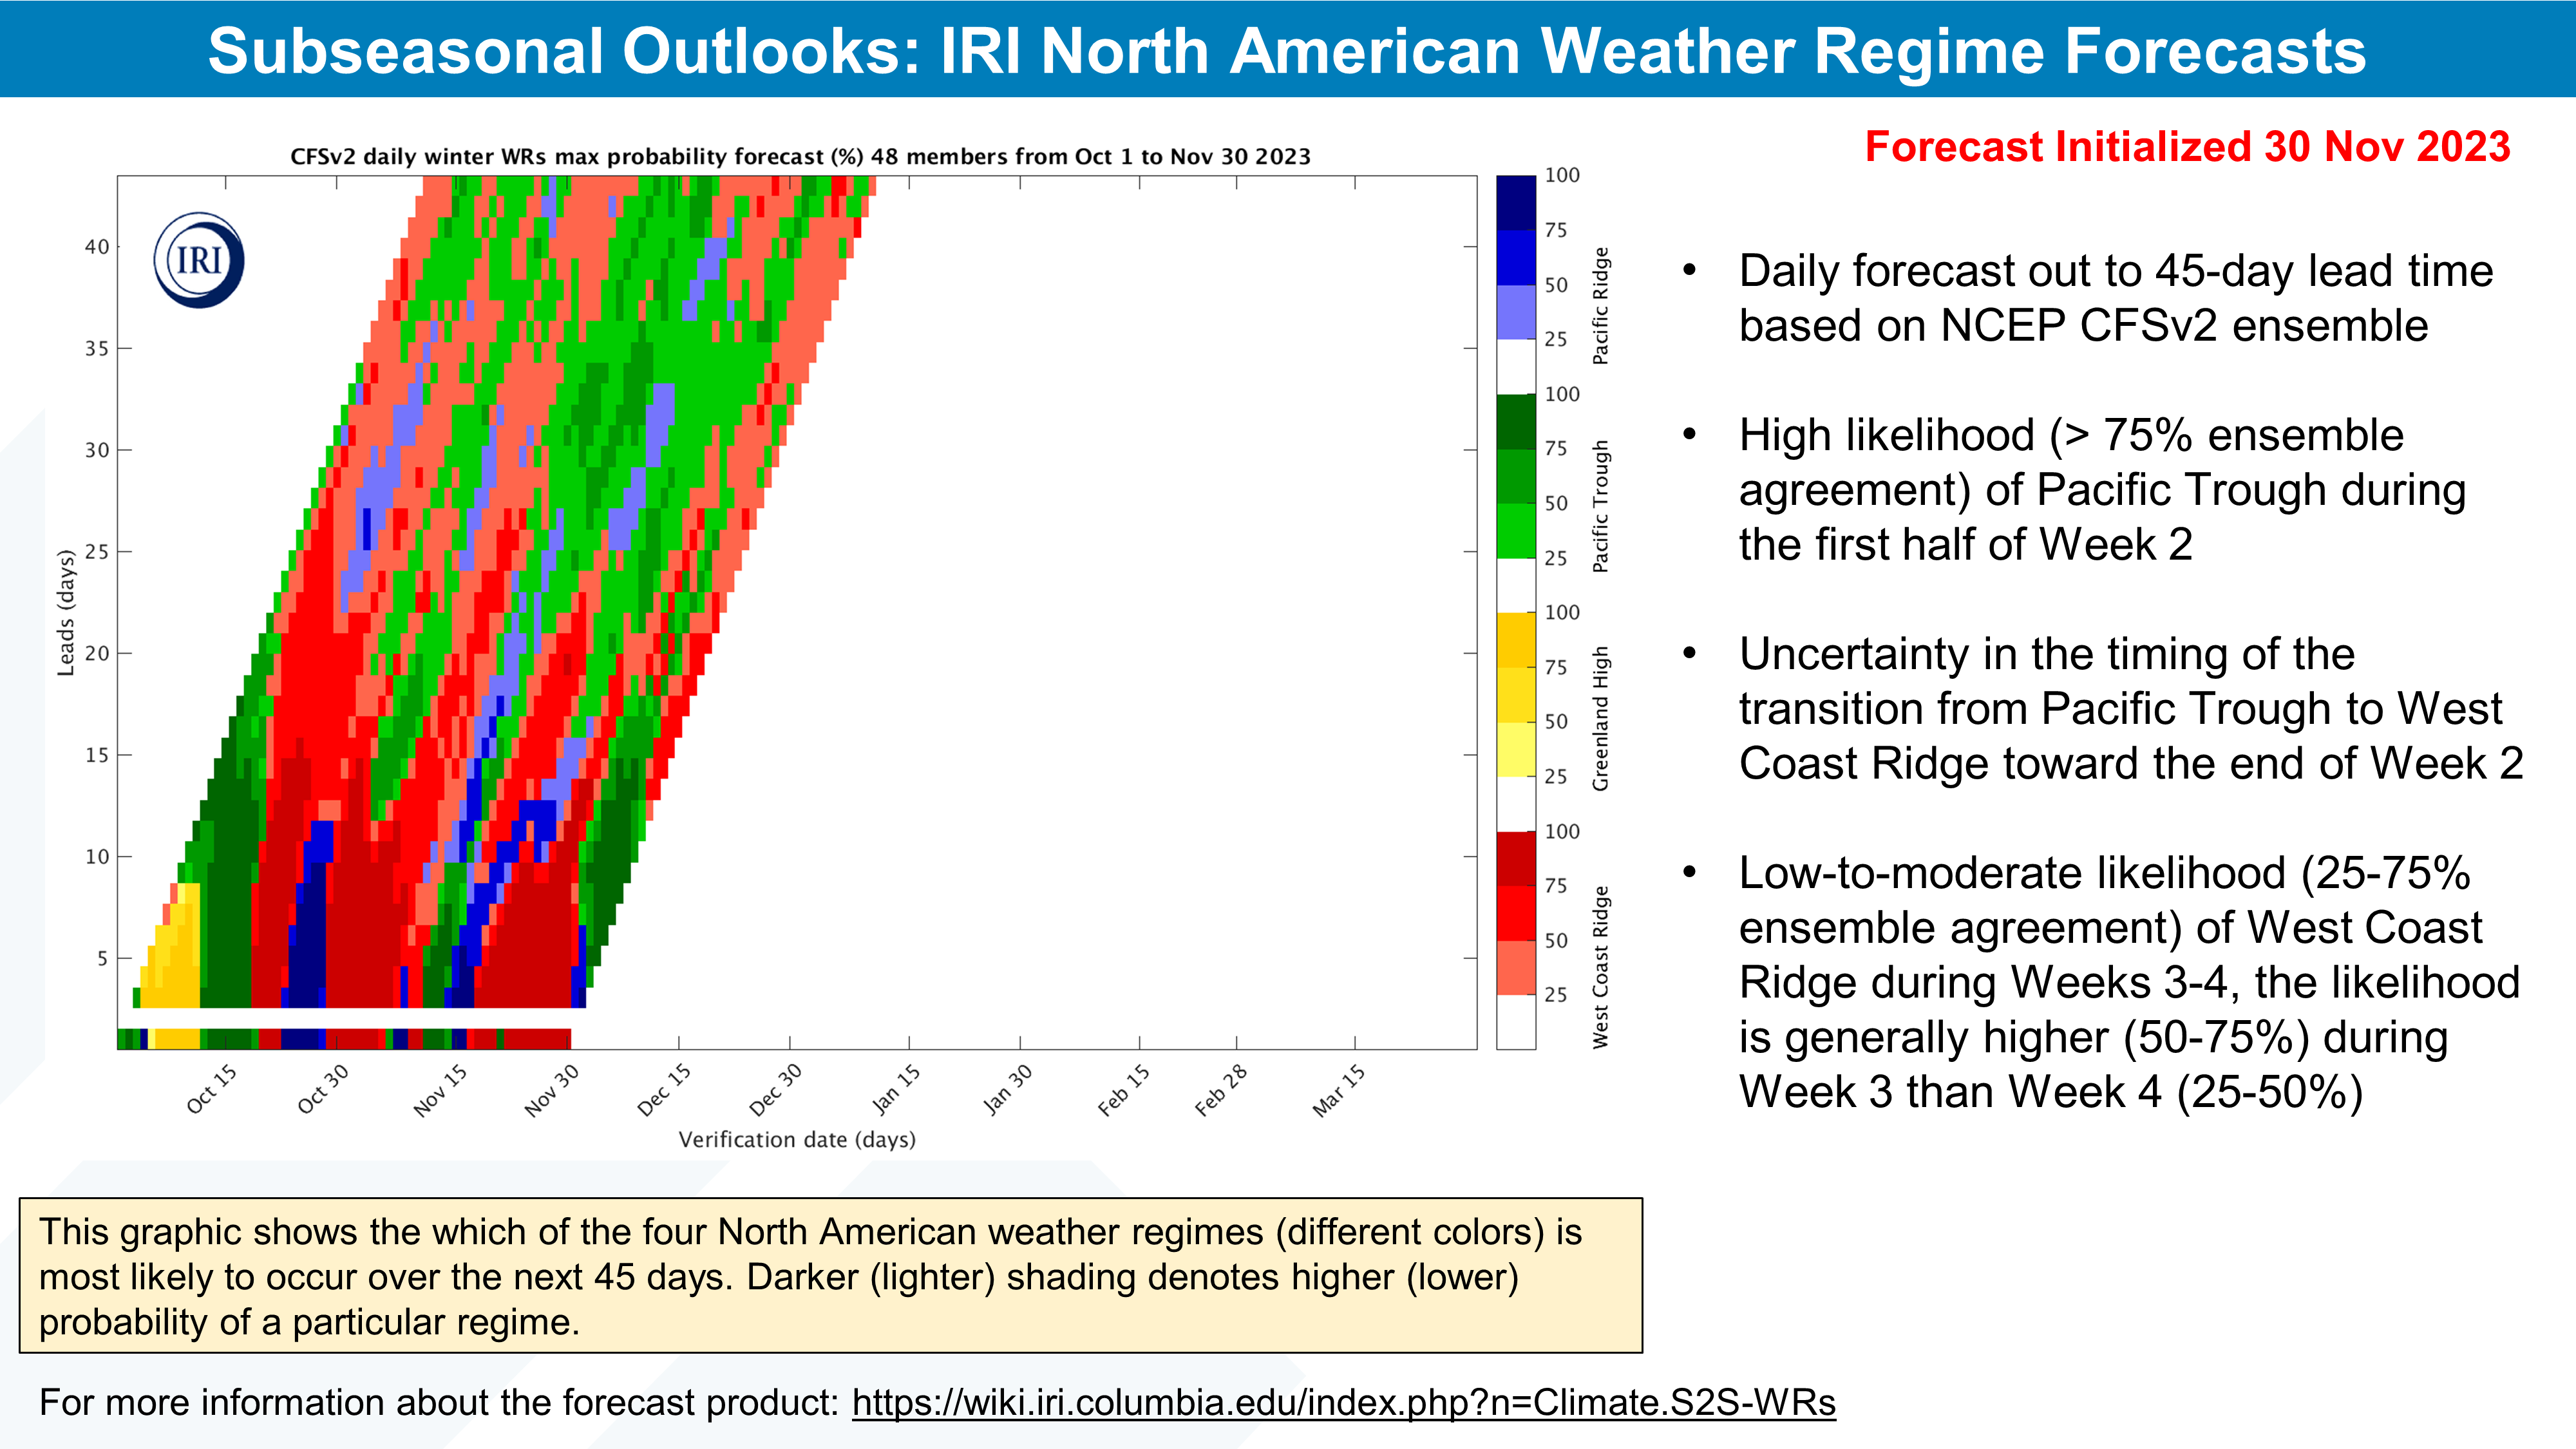
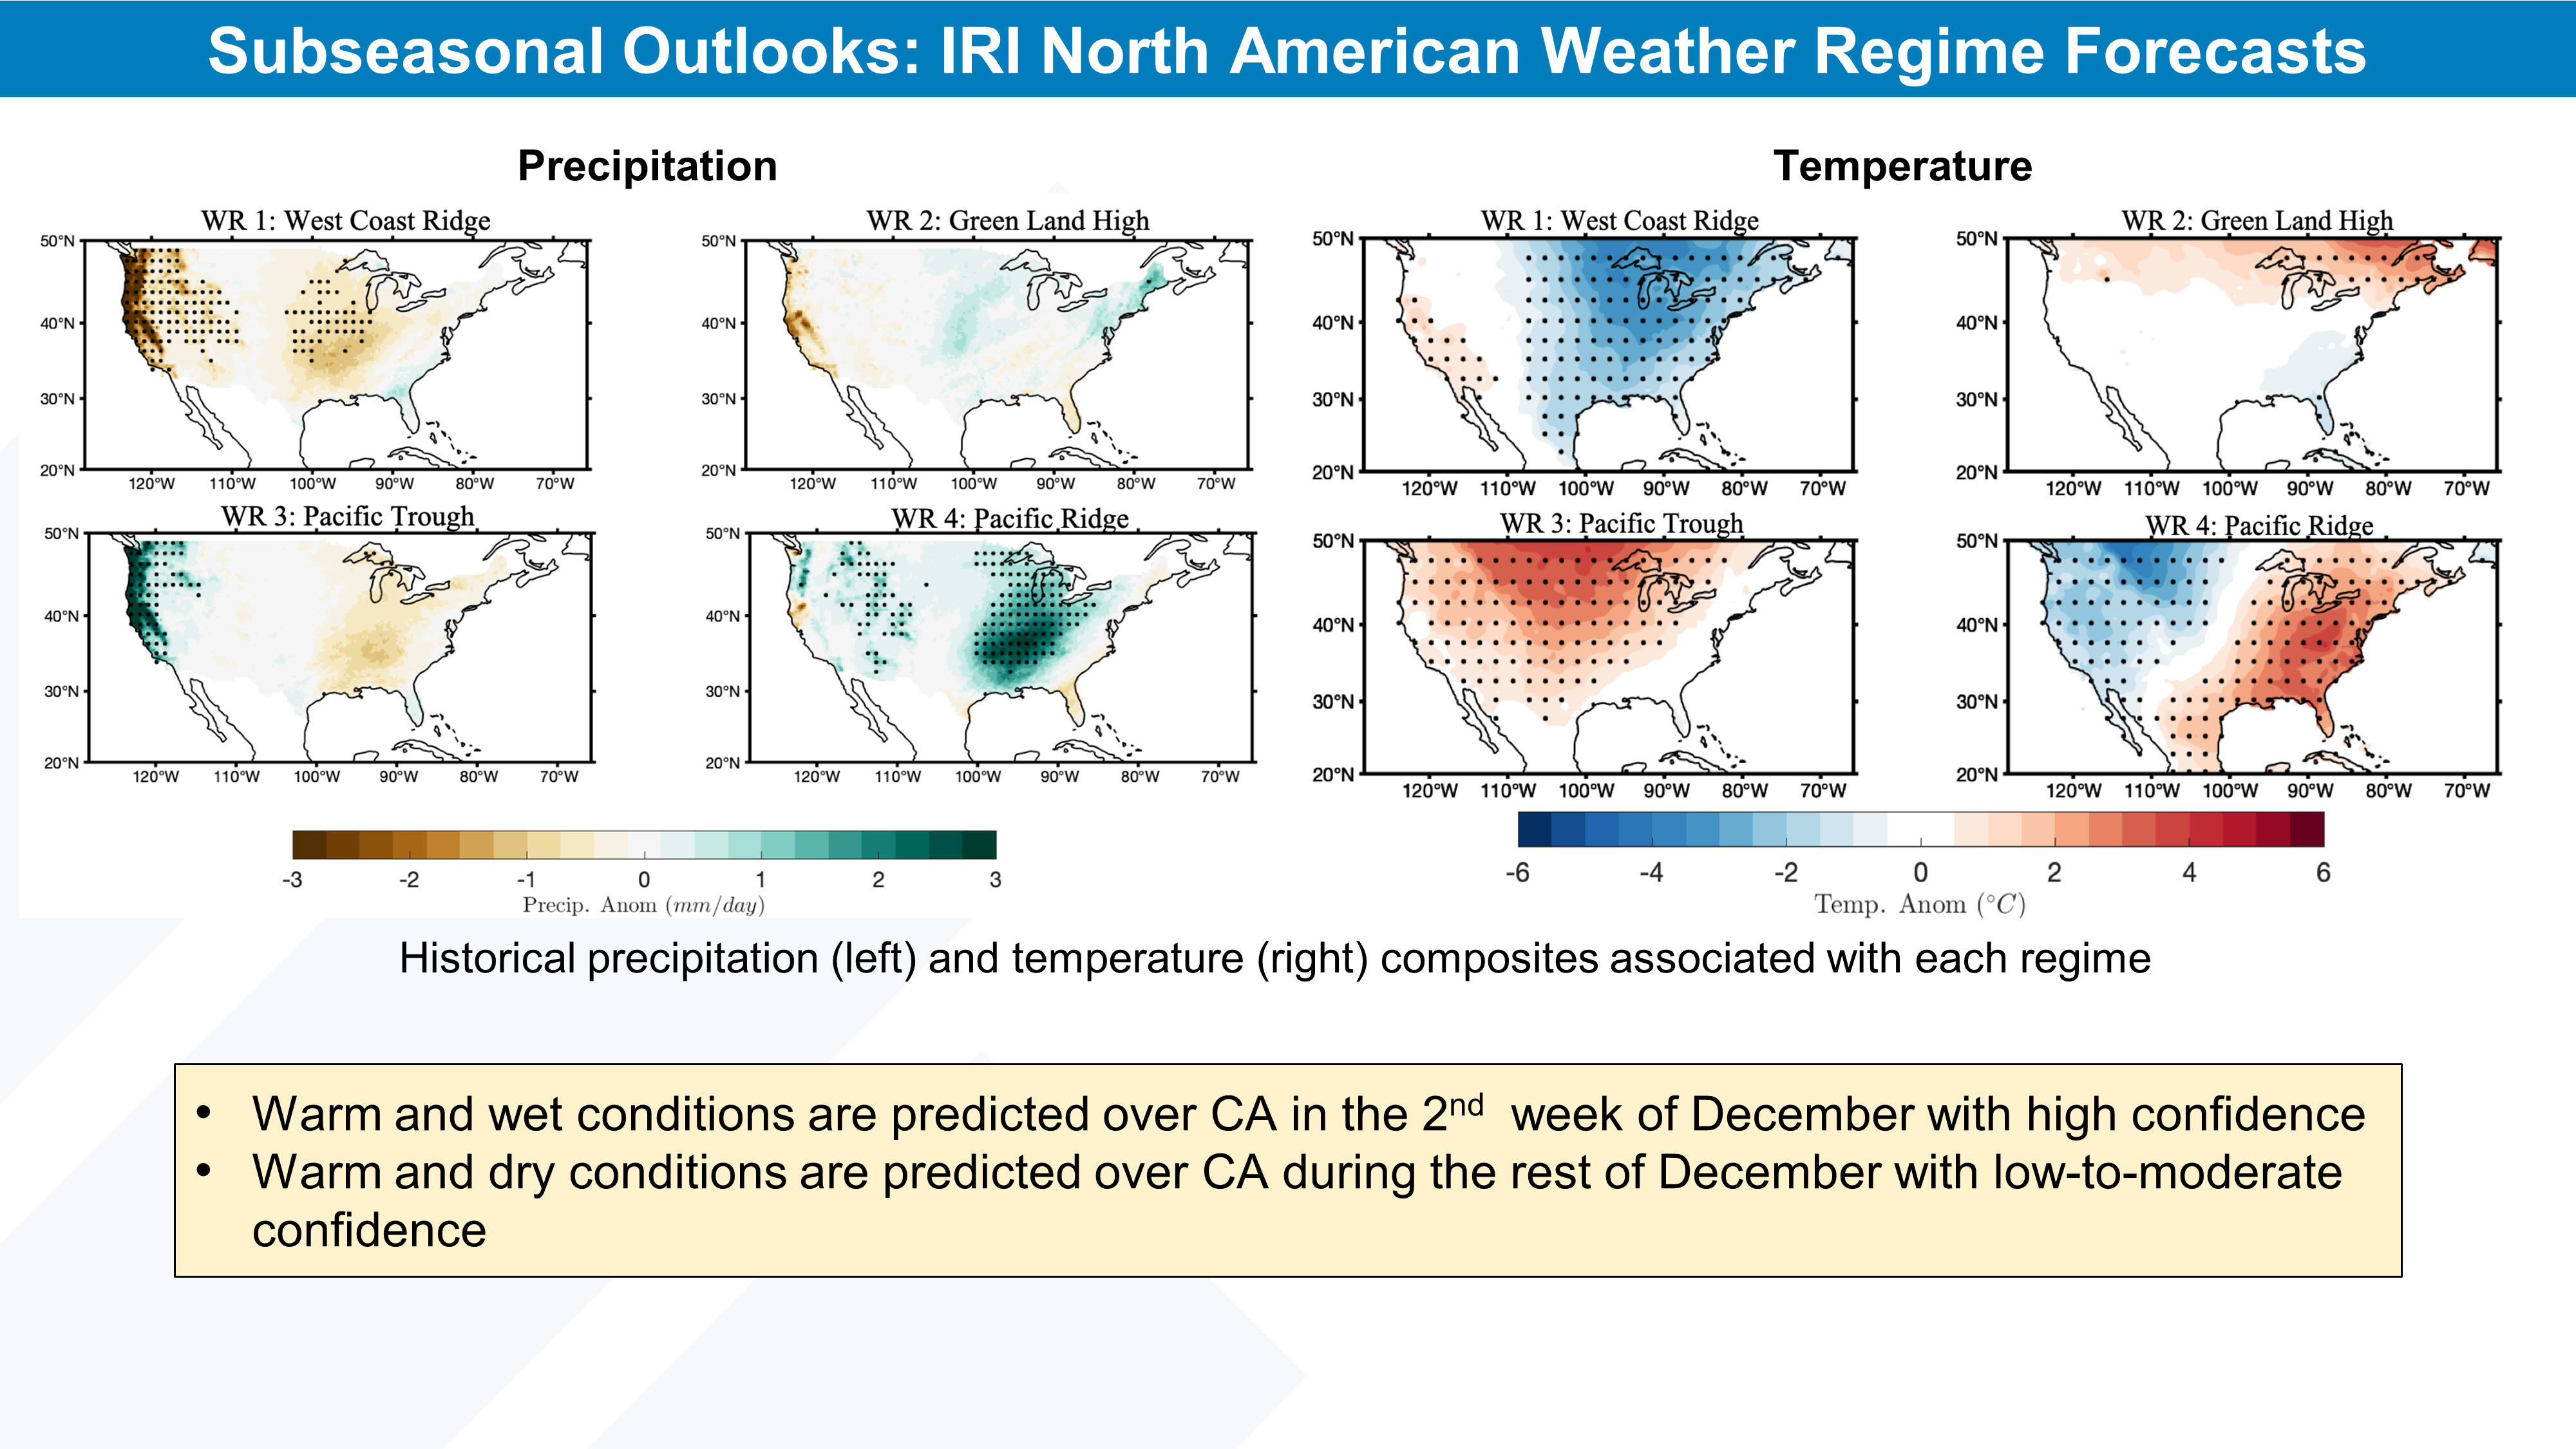
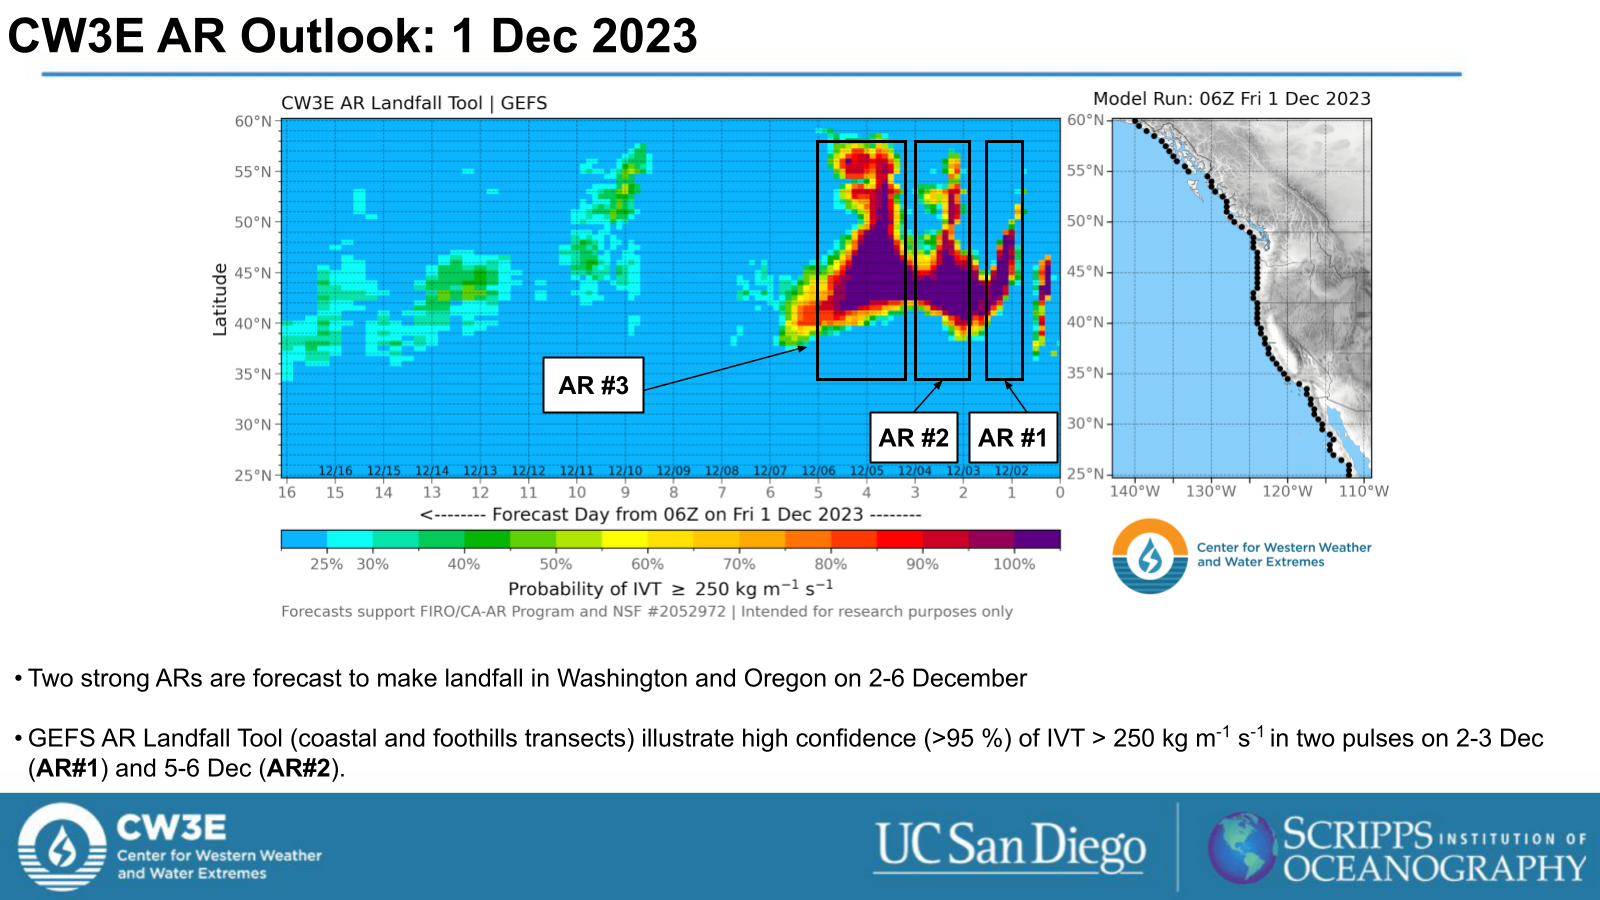
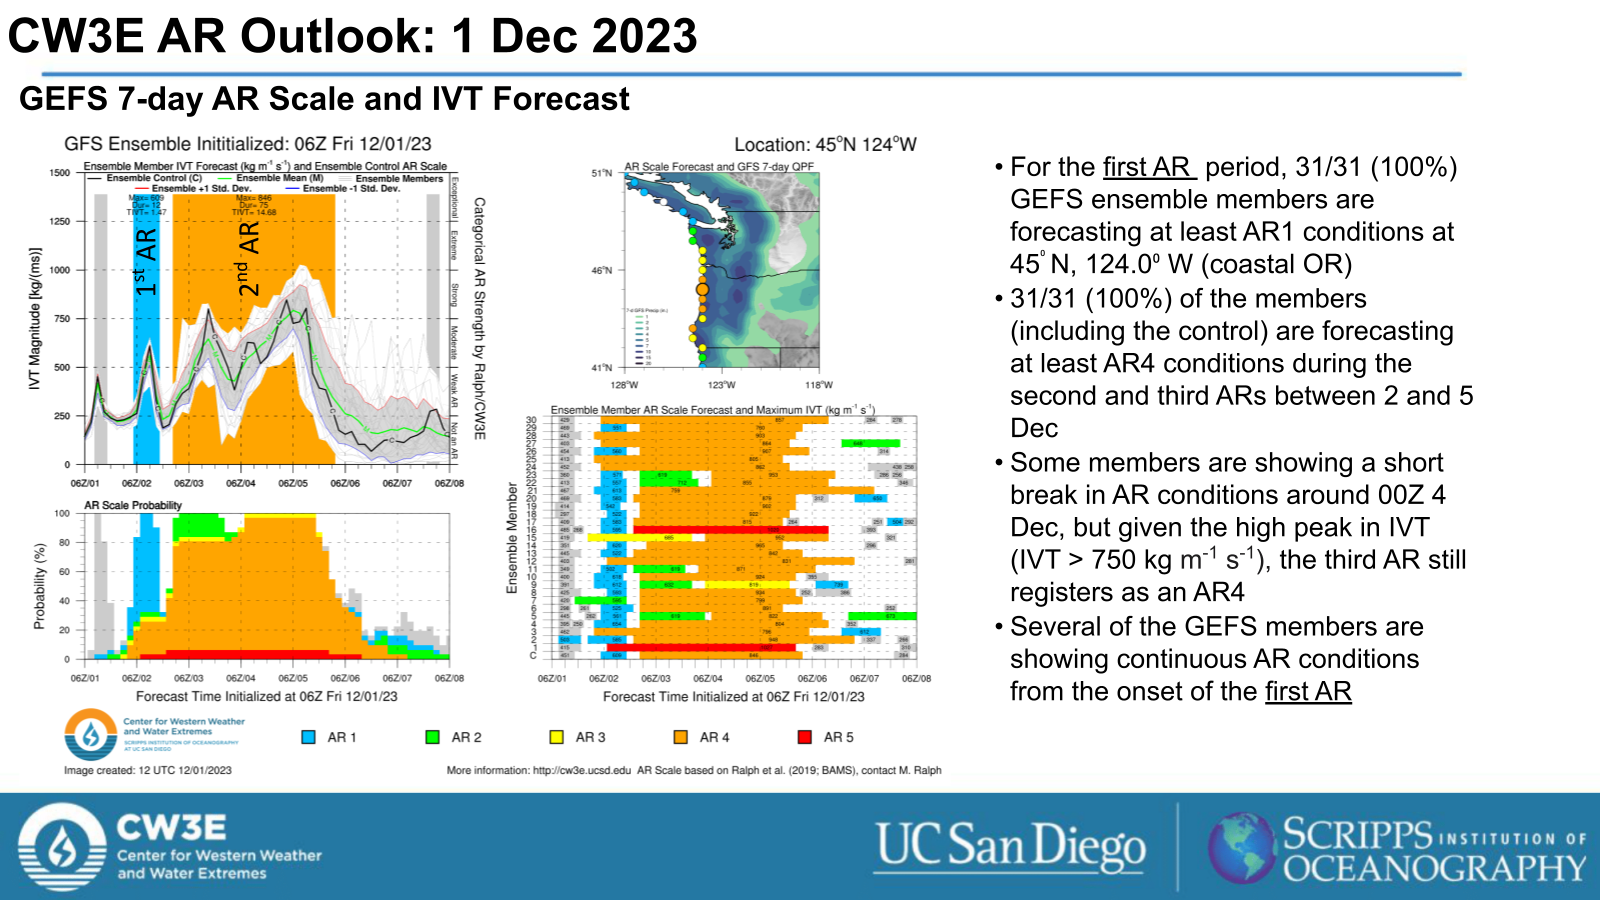
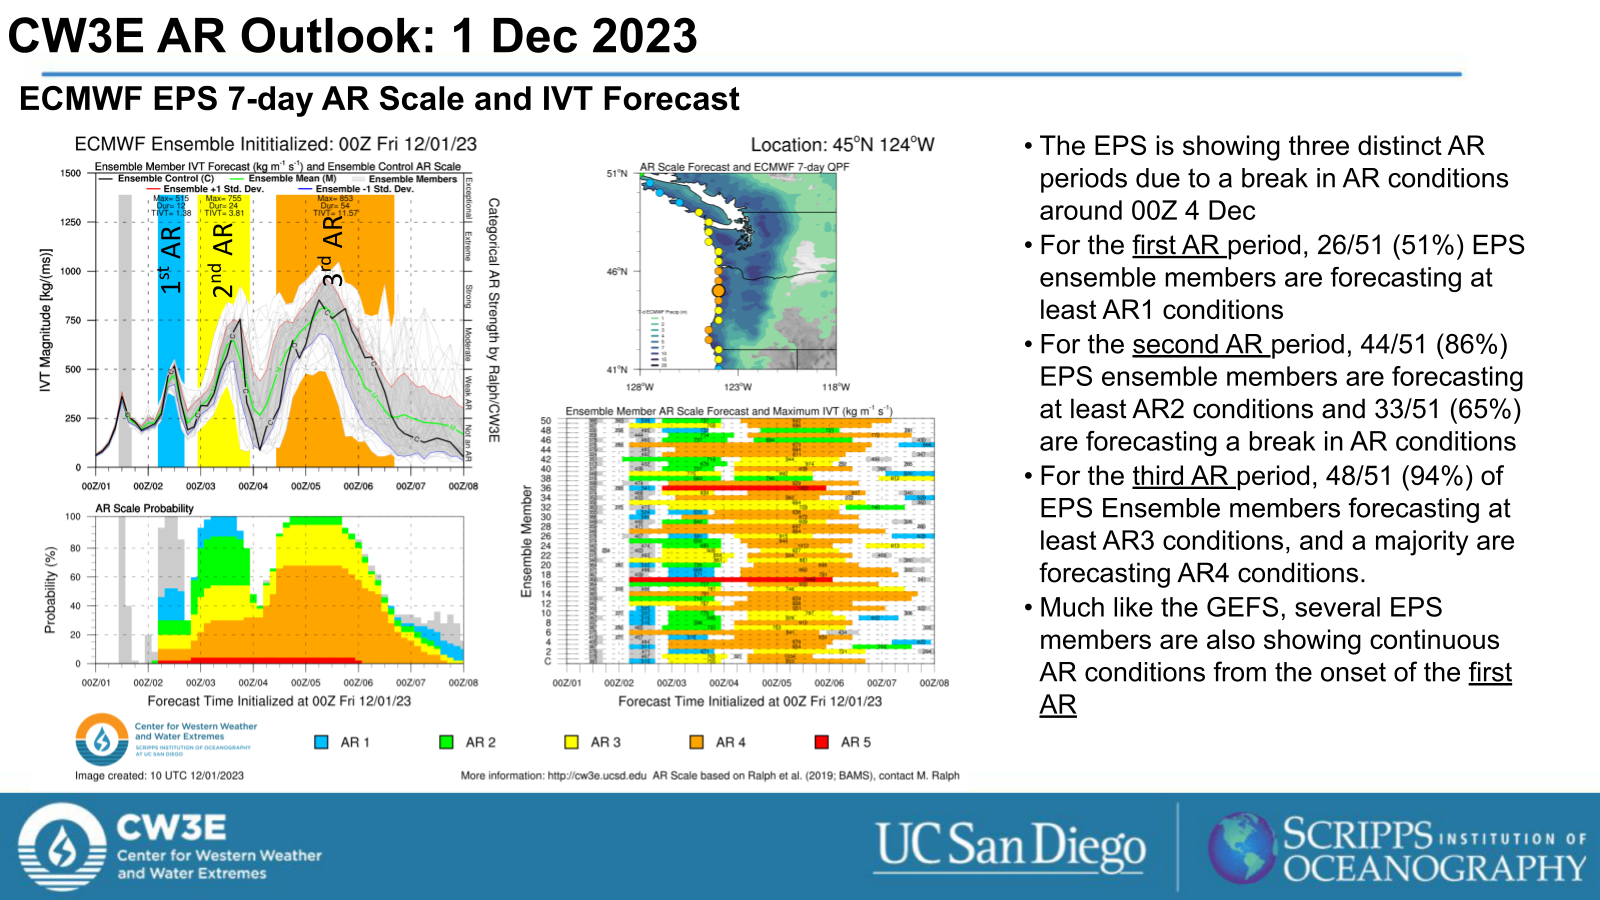
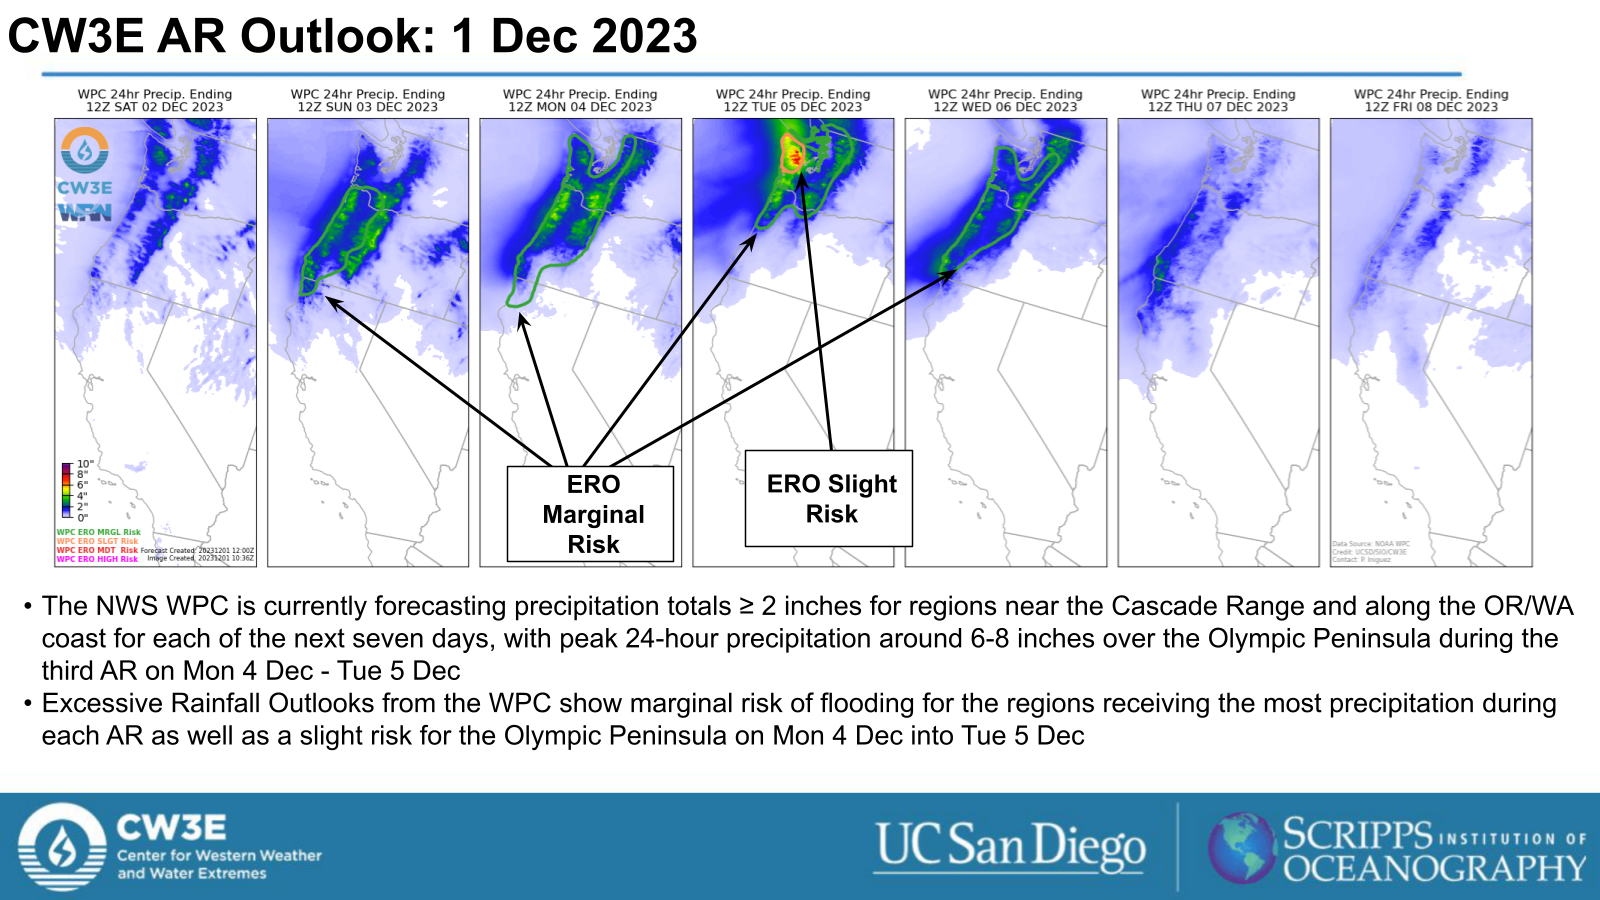
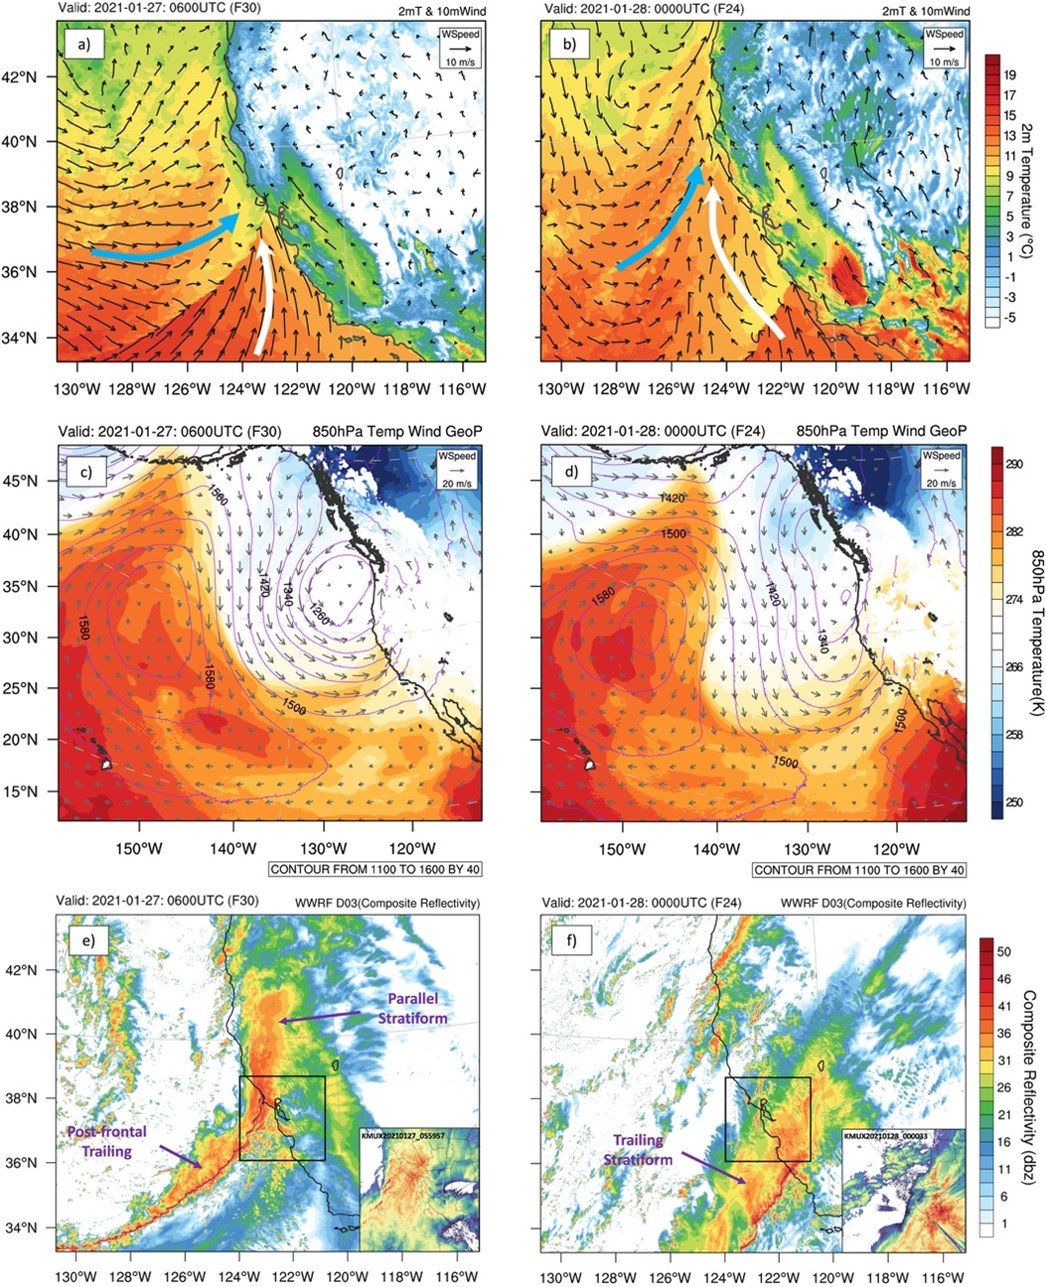
Breaking Ground to Expand Climate Monitoring Network in Upper Yampa River Basin
November, 28 2023
Building on a successful pilot study, two new climate monitoring stations will expand the coverage of the monitoring network and improve understanding of climate and water resources in the Yampa River Basin.
Steamboat Springs, Co., (November 27, 2023) – In early November 2023, two new climate monitoring stations were installed in the Upper Yampa River Basin. The first is on private property at the Howe Ranch, roughly 10 miles North of Hayden, CO, and the second is on private property roughly 7 miles northwest of Steamboat Springs, CO. The installations represent the breaking of ground for a new phase of collaboration between Yampa Valley Sustainability Council (YVSC), Colorado Mountain College (CMC), and the Center for Western Weather and Water Extremes (CW3E) at Scripps Institution of Oceanography at the University of California San Diego. The project team conducted a successful pilot installation near Stagecoach Reservoir in 2022 and is now working on expanding the network of monitoring stations thanks to additional funding from the Upper Yampa Water Conservancy District (UYWCD), the Colorado River District’s (CRD) Community Funding Partnership, and the Colorado Water Conservation Board’s (CWCB) Water Plan Grant.
|
 |
 |
|
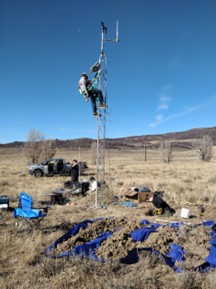
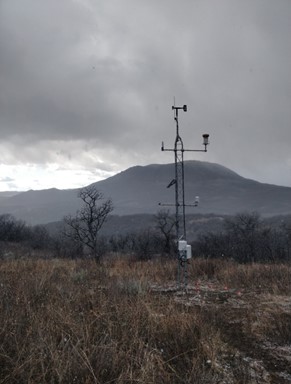
Left: The newly installed ELK station overlooking Elk Mountain, near Steamboat Springs, amid a light snow flurry. Right: The ELK soil pit prior to backfilling, showing the soil temperature/moisture sensors.
The climate monitoring network is motivated by increasing uncertainty in“snow-to-flow” predictions of water availability in the Colorado River Basin. Water managers are finding it harder to predict how much snowmelt runoff will enter rivers and reservoirs in the Colorado River Basin, and one theory is that drier soils are absorbing snow melt like a sponge. The hypothesis is that warming temperatures in recent years are causing soils to dry out and winter snowfall to sublimate or evaporate away, leading to reduced springtime run-off. Unfortunately, without reliable measurements of soil moisture and meteorological conditions throughout the basin, the “soil drying” hypothesis has been difficult to test. “Soil moisture is an under-observed reservoir of water in the basin” says Dr. Marty Ralph, the Director of CW3E and principal investigator on the project. The new monitoring stations were designed to rectify this problem by providing the much-needed observations of soil moisture and a baseline for long-term monitoring in the basin. Ralph’s vision for the project is to “develop methods to comprehensively reduce the uncertainty in that knowledge gap” by integrating the new data into forecasting and water management decision-making.
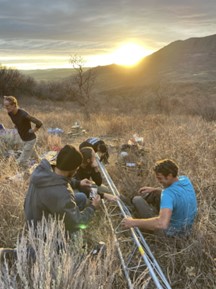
Left: CW3E, CMC, and YVSC team members assemble the tower for the meteorological sensors at ELK station.
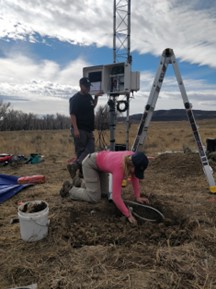
Center: Team members work to install the meteorological sensors on the HOW station tower, with soil from the soil pit laid out in foreground. Right: Team members work to install the HOW soil sensors and backfill the soil pit.
The new stations record soil temperature and moisture at six different depths down to 40 inches in the soil profile. The stations also include meteorological sensors measuring wind speed and direction, precipitation, snow depth, temperature, relative humidity, pressure, and solar radiation. Thanks to cellular communications, the data are available in near-real-time. Site locations were identified using a comprehensive geospatial analysis designed to maximize the impact of their observations and capture basin land surface complexity. First, the team analyzed spatial patterns in the various characteristics that drive soil moisture variability such as precipitation, topography, and vegetation cover. They then compiled records of all the existing soil and meteorological observations in the watershed to identify observational gaps in the basin. Gaps in the existing observations were confirmed by input from local stakeholders, water managers, forecasting agencies, and researchers and site locations were finalized. The newly installed and existing stations will be complemented by an additional six stations to be installed through 2026, resulting in a comprehensive network spanning the entire basin.
Widespread enthusiasm for the project is evident in the Yampa Valley. Executive Director of YVSC, Dr. Michelle Stewart, says “the Yampa Valley Sustainability Council sees this ground-breaking for the climate monitoring network expansion as critical in enhancing our ability to accurately monitor and respond to climate change in the Yampa Valley. YVSC greatly appreciates the investment and support from our funding partners to further this type of science-driven, decision-support project for the benefit of water and land use in the Yampa River Basin.”
Andy Rossi, the General Manager of UYWCD, adds that “the continued expansion of a soil moisture monitoring network across the Upper Yampa River Basin is critical to understanding spring runoff, especially as our climate becomes hotter and drier.” He also sees potential for benefits outside the basin, explaining that “the data collected from these stations will not only assist local water managers like UYWCD, but could lead to a more collaborative approach to water management decisions downstream.” The support from UYWCD, CRD and CWCB has been critical in continuing this effort to increase observational monitoring in the Upper Yampa.
Amy Moyer, Director of Strategic Partnerships at the Colorado River District, also recognizes the importance of the project. “In coordination with related efforts across our District, we see this climate and soil monitoring effort as an important piece of an overall strategy to better understand how water resources are changing in the Colorado River Basin, both from near-term operations and to long term planning perspectives.” She also praised the project for its commitment to community-oriented science, adding that “the project aligns well with our Community Funding Partnership Program goals, and we are proud to financially support this cooperative initiative that will achieve multiple benefits.”
To maximize the impact of the knowledge generated by the monitoring network, the project team is committed to collaborating with the residents and water interests of the Yampa River Basin. This involves partnering with local private landowners to host the stations, inviting students and volunteers from Colorado Mountain College to participate in the installations, and co-organizing the Yampa Basin Rendezvous–a conference dedicated to water and weather in the Yampa River Basin held at Colorado Mountain College in late spring each year, as well as coordinating with related regional and federal soil monitoring efforts.
Local partners Emily Howe and Jeremiah Psiropoulos described their motivation for participating in the project and the benefits they see for the community: “We are hosting this station to help provide a better understanding of how water behaves in the Elkhead watershed. As biologists ourselves, we’re excited to contribute data to scientists working to understand hydrology and climate change in our community, and we love the idea of helping to maintain a long-term dataset. We manage the Howe Ranch to conserve the land, water, flora, and fauna in our community. As water scarcity and drought accelerate in the Yampa Valley along with a warmer future, we hope that water use in our valley will be data informed and sustainable, and we hope our weather station will benefit efforts to ensure that.”
Nathan Stewart, Professor of Ecosystem Science at CMC and project collaborator, recognizes the value of the Climate Monitoring Network to undergraduate training in STEM: “our students participate in station installation alongside technical experts from CW3E, colleagues from YVSC, and local Yampa Valley landowners and witness dynamic community-engaged science first hand. Immediate benefits include mentorship in tower, sensor, and soil pit establishment; long term benefits include training in station maintenance, data analysis and visualization, and science communication. The network provides our basin with an unparalleled outdoor laboratory for student career training in meteorology and watershed science.”
This season’s station installations represent the groundbreaking of the newly funded expansion of the monitoring network. Expanding the network will generate additional observations and sample a wider range of soil and hydrological conditions, helping water managers to better determine exactly what is happening to snowpack in the basin and improve predictions of springtime reservoir inflows.
The data collected by the stations will be publicly available on the CW3E website, MesoWest, and the NOAA Physical Science Laboratory.
Contact:
El Knappe
Center for Western Weather and Water Extremes
Phone: 805-708-7472
Email: eknappe@ucsd.edu
Madison Muxworthy
Yampa Valley Sustainability Council
Phone: 970-871-9299, ext. 107
Email: madison@yvsc.org
Nathan Stewart
Colorado Mountain College
Phone: 970-870-4562
Email: nlstewart@coloradomtn.edu