CW3E and Colorado Partners secure funding for soil moisture network expansion
March 27, 2023
CW3E, Yampa Valley Sustainability Council (YVSC) and key partners Upper Yampa Water Conservancy District (UYWCD) and Colorado Mountain College (CMC) have secured funding for the project, “Enhancing Soil Moisture Observations to Support Water Resource Management in the Upper Yampa River Basin.” This funding enables the project team to expand upon the first soil moisture monitoring station that was installed in the Yampa River Basin in September 2022 and install eight more stations over the next two years.
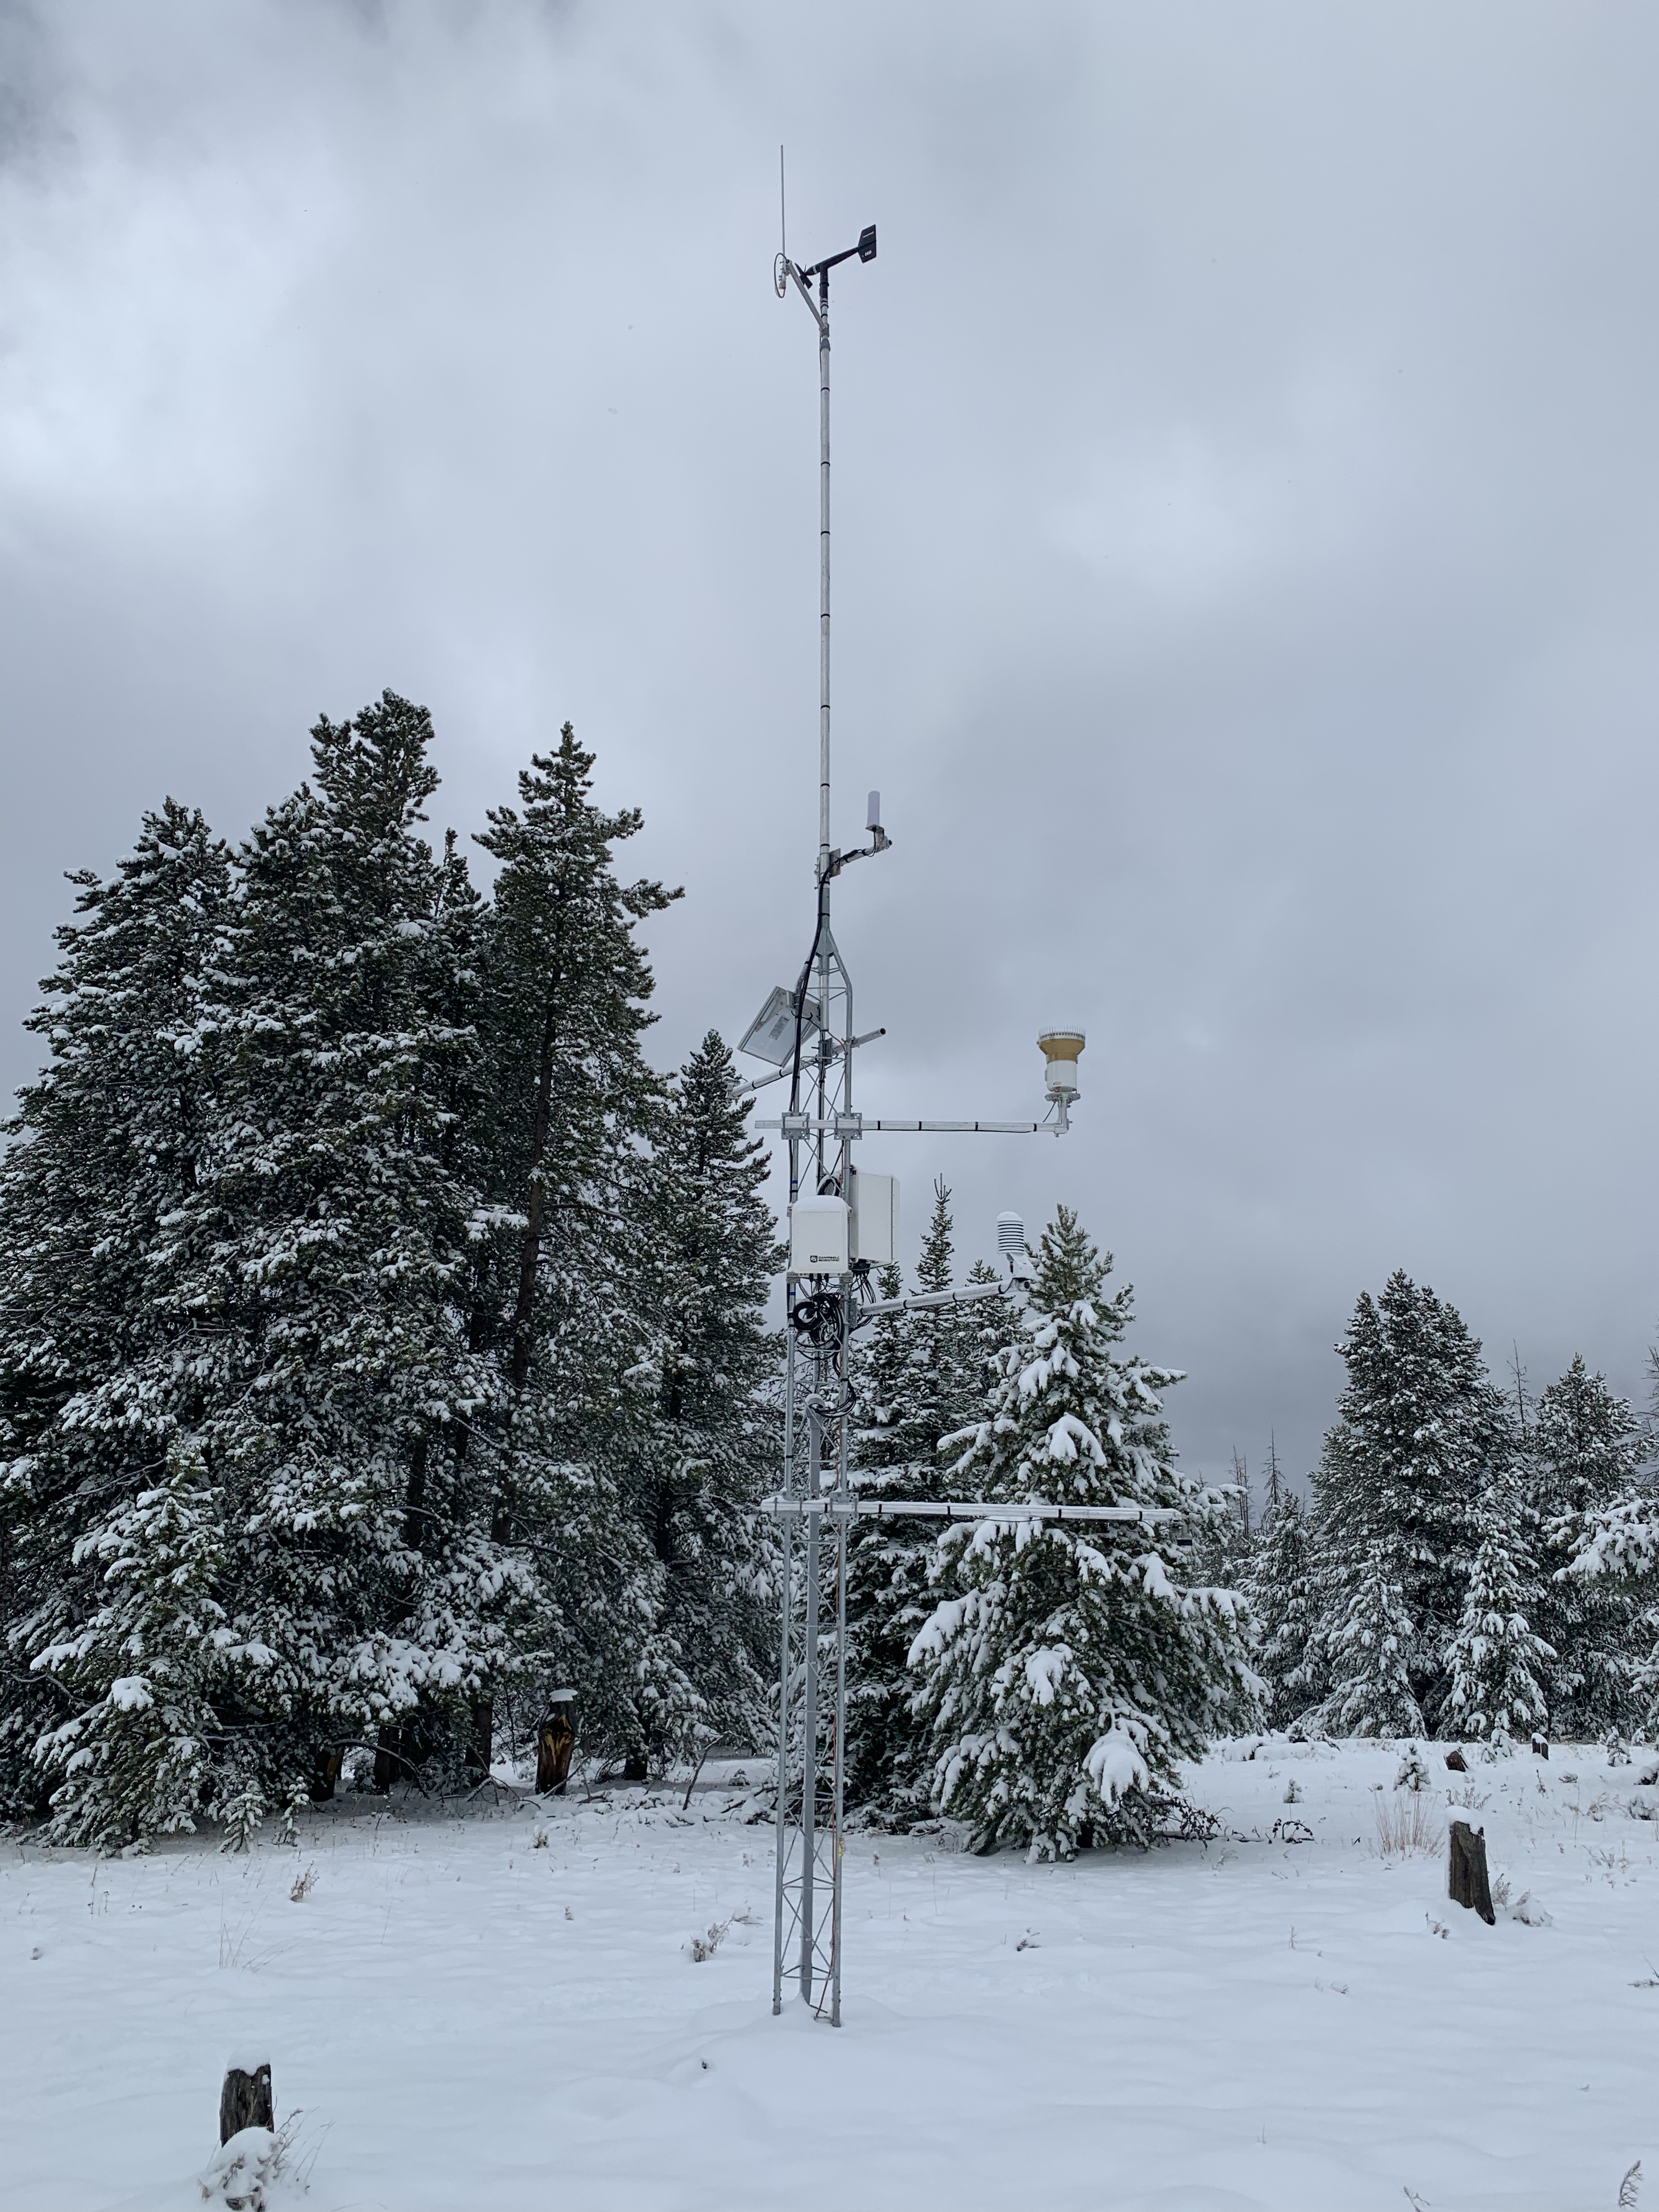
The expanding Yampa Basin soil moisture network measures moisture concentrations in the soil as well as soil and air temperature, precipitation, snow depth, fuel moisture, and other key climatic variables. Soil moisture data is key to understanding how snowpack relates to spring runoff and river flows. Snow-to-flow dynamics – or how much water is delivered to our rivers from our snowpack – are mediated by soil moisture. Drier soils in upland areas function like dry sponges and absorb water, reducing the amount of water delivered to rivers and thus reducing flows. The Yampa Basin is already experiencing changes in snow-to-flow dynamics, where normal snowpack years are followed by low spring and summer flows.
“The timing for the launch of the network is key,” said Dr. Michelle Stewart, Executive Director of YVSC. “Our snow-to-flow patterns have been changing considerably in recent years and monitoring soil moisture data is an important step towards a better understanding of how water in our basin is changing due to changing climate.”
The Yampa Basin soil moisture network stands to benefit forecasters, water managers, and water users to better understand water supply by increasing the understanding of soils, which Dr. Marty Ralph, Principal Investigator on the project and Director of CW3E, calls the “fourth reservoir” in
water planning. The primary types of reservoirs water managers think about are snow, rivers/streams, and reservoirs, but soils have been a missing part of the puzzle. The project goals are to reduce uncertainty in seasonal snowmelt runoff predictions and work with stakeholders in the Yampa Valley to appropriately integrate these data into water management decision support, including at sub-seasonal to seasonal forecast lead times ranging from weeks, months, and seasons. The network will be critical to establishing a baseline for long-term monitoring of new trends in soil moisture expected due to greater evapotranspiration – the cumulative transfer of moisture from soils and plants to the atmosphere – related to warming as climate changes.
The funding is an exciting development for the Basin because it allows for investments in infrastructure that increase resilience to water changes in the basin. According to Andy Rossi, General Manager of the UYWCD, “the data will be invaluable to UYWCD in forecasting runoff and assisting with reservoir and water resource management decisions,” and the hope is that, “this network will help close a data gap in the Yampa River Basin and serve as a useful tool for water managers in our basin and beyond.” UYWCD’s initial funding has been instrumental to the successful installation of this first station and an important anchor for building out the network.
Colorado Mountain College, which will partner to provide student career training in climate monitoring and instrument maintenance, sees the expansion of the network as an important contribution to regional workforce development. Dr. Nathan Stewart, Professor of Ecosystem Science and Sustainability, identifies this funding as integral to student career pathways in water. “Expansion of our region’s Soil Moisture monitoring network will provide us with a state-of-the-art platform for technical training in meteorology, hydrology, and ecosystem science,” he said. “Student engagement with this network is essential to the recruitment and development of our future western water workforce.”
The Yampa Basin soil moisture network began in 2021 when extreme drought conditions led CW3E and YVSC to partner with the UYWCD to identify critical areas for soil moisture monitoring in the basin through a basin analysis. In 2022, UYWCD funded the installation of the first soil moisture and surface meteorological monitoring station near Stagecoach Reservoir and the development of an online data portal site for project partners and public use.
This three year project was funded through a joint grant from the Colorado Water Conservation Board (CWCB) Water Plan Grants, Colorado River District’s (CRD) Community Funding Partnership and support from UYWCD.
“It is an exciting opportunity for our Center and key partners YVSC and CMC to pull together and create this network,” says Ralph. “It is envisioned as a pathfinder for the future. We are excited to be working closely with UYWCD, CRD, and CWCB to develop this capability and apply it to the special water management needs in the Yampa, from local to state and regional scales.”
This collaborative effort between CW3E, YVSC, CMC, and UYWCD includes additional project partners at Aspen Global Change Institute and Natural Resources Conservation Service.